KINERJA
J U R N A L B I S N I S D A N E K O N O M I
TERAKREDITASI SK NO. 68a/DIKTI/Kep/2010
KINERJA
DAFTAR ISI
Daftar isi
Food Demand in Yogyakarta: Susenas 2011
Agus Widarjono ... 104-118 Impacts of Sugar Import Policy on Sugar Production in Indonesia
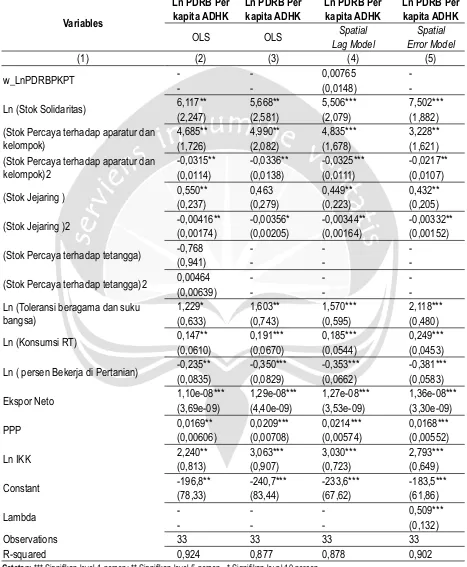
Agustinus Suryantoro, Albertus Magnus Susilo dan Supriyono ... 119-144 Pengaruh Modal Sosial Terhadap Pertumbuhan Ekonomi Provinsi di Indonesia:
Analisis Data Susenas 2009
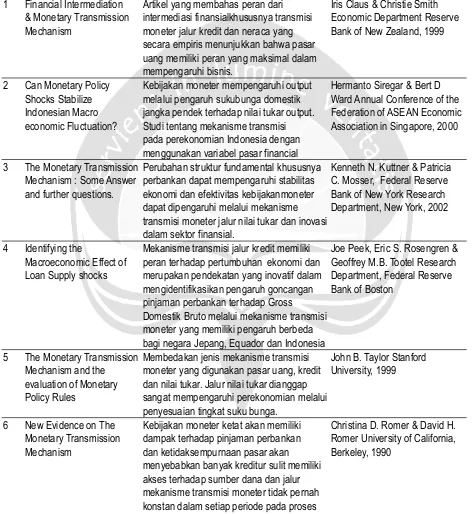
Bambang Suryanggono ... 145-157 IdentiÀ kasi Mekanisme Transmisi Kebijakan Moneter di Indonesia Tahun 2000-2011
Deswita Herlina ... 158-173 Analisis Faktor-Faktor yang Mempengaruhi Kedalaman Jangkauan (Depth of Outreach)
Lembaga Keuangan Mikro di Kabupaten Sleman
Purwaningsih Handayani dan Lincolin Arsyad ... 174-187 Pengaruh Risiko Usaha Berbasis Informasi Akuntansi Terhadap Premium Penerbitan
Saham Perdana di Indonesia
Melisa Marianni Manampiring dan Dewi Ratnaningsih. ... 188-196 Praktik Perencanaan Keuangan: Studi Empiris Tentang Sikap dan Perilaku Keuangan
Rumah Tangga Desa
Perminas Pangeran ... 197-216 Pedoman Penulisan
FOOD DEMAND IN YOGYAKARTA:
SUSENAS 2011
Agus Widarjono
Department of Economics
Faculty of Economics Universitas Islam Indonesia
Email: [email protected]Abstract
The impacts of economic and demographic variables on food demand in Yogyakarta are estimated using the Almost Ideal Demand System (AIDS). Data from the national social and economic survey of households (SUSENAS) in 2011 are used to accomplish the goal of this study. Food demand consists of cereals, sh, meats, eggs and milk, vegetables, fruits, oil and fats, prepared foods and drinks, other foods and tobacco products. Results show that except for meat and tobacco products, demand elasticities for the rest of foods are inelastic and cereals is the least responsive to price change. All ten studied foods are normal good, but their income elasticities are very inelastic.
Keyword:Almost Ideal Demand System (AIDS), price and income elasticity, Yogyakarta.
1. INTRODUCTION
Inflation in Special Region of Yogyakarta province and hereafter it is called Yogyakarta for the rest of the paper over 2009-2011 was stable below two digits but relatively high in 2010. Inflation rates during those three years were 2,98 %, 7.38 % and 3.88 % respectively. However, interestingly food groups significantly contributed inflation during those years. Inflation rate of food stuffs were 3.91 %, 18.06 % and 1.82 % while inflation rate of prepared food, beverage and tobacco products products were 7.81 %, 6.96 %, and 4.51 % over 2009-2011. When we look at detail in subgroup of food stuffs, contribution of inflation rate of cereals, cassava and their product, preserved fish, vegetables, fruits, species, and fats and oil to inflation rate in 2010 were relatively high by 18.92%, 17.18%, 44.40%, 27.01%, 59.89% and 15.89%. Even though inflation rate went down in 2011, the inflation rate of cereals, cassava, and their product, preserved fish and fats and oils were still high by 11.75%, 8.87% and 7.41%. The contribution of subgroup prepared food, beverage and tobacco products mainly came from tobacco products and alcoholic beverages to inflation in Yogyakarta in 2010 by 8.32 % and increased to 12.23% in 2011 (CBS Yogyakarta, 2011).
elasticities (Alston et al. 1994). This study estimate demand for food in Yogyakarta with the non-linear AIDS model. The analysis of food demand in Yogyakarta is expected to be one of the important information to local governments in the Yogyakarta in formulating food policy.
The rest of this paper is organized as follows. Section II discusses food consumption patterns in Central Java. Model of household food demand and data in Yogyakarta are presented in the following section. The next section discusses estimation procedures and results. The final section of this study presents some conclusions.
2. FOOD CONSUMPTION PATTERNS IN YOGYAKARTA
Household expenditure is one of the most important components of aggregate demand determining economic activity in a region. In addition, the social welfare can also be measured from the level of household expenditures. The higher household expenditure is the higher the level of society welfare. Household expenditure can be divided into two major groups, namely food and non-food expenditures. During the year 2011, the per capita household expenditures in Yogyakarta were Rp 625,043 consisting of food and non-food expenditure by Rp 276,325 and Rp 348,721 respectively. Whereas per capita household expenditure in 2010 were Rp 553,967 which expenditures of food and non-food respectively were Rp 244,004 and Rp 309,963. Per capita expenditures increased by 12.83 percent in 2011 driven by spending on food groups by 13.25 % and non-food group by 12.50%. When viewed by area of residence, per capita expenditures of urban households in 2011 were Rp 702,787 or increasing by 7.10 % compared to in 2010 that were only Rp 656,190. By contrast, the per capita expenditures of the rural population in 2011 were only Rp 472,165 but its growth was higher by 27.64% (CBS Yogyakarta, 2011). Per capita expenditure urban households were higher than the expenditure of the rural households during 2010-2011, so that on average the welfare of the urban families were better than the rural families in both years.
Household spending patterns will shift with increasing income. The higher income leads to decreasing the share of expenditure on foods and increasing share of expenditure on non-foods. In 2010, the percentage of food expenditure to the total expenditure was 44.05% and increased to 44, 21% in 2011. On the other hand, non-food expenditure share to total expenditure during 2010-2011was 55.95% and 55.79% respectively. The portion of non-food expenditure to total consumption in urban areas was still higher than the non-food groups in the amount of 58.72 percent and 56.89 percent in 2010 and 2011. However, expenditures on food were still relatively higher in rural areas as compared to non-food expenditures by 52.88% and 47.12% respectively in 2010. However, the opposite condition occurred in 2011 in which the non-food expenditures (52.57%) were higher than the food expenditures (47.43%) (CBS Yogyakarta, 2011).
Source: CBS Yogyakarta, 2011
Figure 1 presents the distribution of food expenditures per capita population in 2010. Expenditures on prepared food and drink mostly contributed to total food expenditures by 38%. Large expenditure share for prepared food and drink related to those resident who rent house especially students whom their consumption patterns tend to buy fast foods. Cereals with subgroups such as rice, cassava, maize (14%) also significantly contributed to total food expenditures. Expenditures on dairy product such as eggs, milk and their product and vegetables were 7%. However, spending on high-value foods from meat and its product, fish, oils and fats were relatively low by less than 3%. More interestingly share of tobacco products expenditure to total expenditure were relatively high (7%).
3. MODEL SPECIFICATION AND DATA
3.1. Model SpeciÀ cation
This study estimates demand foods in Yogyakarta. The demand for foods encompass cereals, fish, meat, eggs and milk, vegetables, fruits, oil and fats, prepared food and drink, other foods, and tobacco products. To estimate demand for ten food groups in Yogyakarta, we begin with the classical utility maximization framework. Economists use the concept of utility to define the level of satisfaction that comes from a specific allocation of income among different products. The basis of demand analysis is the problem of how to maximize utility subject to a given level of income. This can be expressed as:
(1)
where U is a utility function of the quantities of goods consumed, Y is total income, p and q are prices and quantities, respectively.
The solution to the equation (1) gives the amount demanded of each good as a function of its price, price of other goods and the consumer’s income. The problem exists for the empirical analyst when the number of good involved is too large. Some alternative approaches were proposes to solve. One is the composite commodity theorem that groups commodities based on the behavior of their relative prices. The others are separability and two-stage budgeting that makes assumption about the consumer’s preferences.
Figure 2. Household Utility Tree for foods Consumption in Yogyakarta
The Working (1943)-Leser (1963) food demand is chosen in the first-stage budgeting to estimate demand ealsticity for food and written as:
(2)
where i and j are goods, wi is the share of total expenditure allocated to the i th good, pj is the price of the j th good, is the household expenditures on goods, Mk is the demographic variables consisting of urban, household size, years of schooling of household head, age of household head, gender of household head, and two quarter dummy variables (Quarter 2 and quarter 3).
From equation (2), we can derive uncompensated (Marshallian) price and expenditure elasticities. Uncompensated price ∈ij and expenditure ∈i elasticities are:
(3)
(4)
where is the Kronecker Delta that is zero if ≠ and unity otherwise. Own-price, cross-price and expenditure elasticity are evaluated at sample means. Because the Working-Lesser does not provide a direct estimate of income elasticity, this study uses Engle function as follow:
where Ȥ is the household expenditures on foods, X is total expenditure on food and non-food, P is price index of foods, and Zk is the demographic variables that are same as previously defined in equation (2). The income elasticity is estimated as (Chern et al, 2003):
(6)
In the second-stage budgeting a almost ideal demand system (AIDS) developed by Deaton and Muellbauer (1980) is used to analyze demand for ten food groups. The AIDS model is
(7)
where i and j are goods, wi is the share of total expenditure allocated to the i th good, Pj is the price of the j th good, X is the household expenditure on goods in the system, a(P) is the price index, γij, i, and (Ļi are parameters to be estimated, and ui is an error term. The price index a (P) is
The demand for food is influenced not only economic variables but also demographic variables. To capture demographic variables in estimating demand for food, we incorporate demographic variables into the intercept in equation (7) as defined Ļi = (Ļi0 + Ļ(k = 1)Ĺ m (
Ļik dĻk where dk is the demographic variables consisting urban, of household size, educational level of household head (years of schooling), age of household head, gender of household head, and two quarter dummy variables (Quarter 2 and quarter 3).
Because expenditure variables in the AIDS model are endogenous variable, it likely happens that error terms and expenditure variable in equation (7) is correlated and lead to biased parameter estimates. The two-step estimations proposed by Blundell and Robin (1999) is applied to correct for the endogeneity problem in the AIDS model. The first step is to run the following equation:
lnY = H + e (8)
Where Y is total food expenditure of the studied food groups and H a set of explanatory variables encompassing of income, square of income, prices of the studied goods, and demographic variables that are used in equation (7). Total household expenditure is used as a proxy for income (Deaton, 1996; Moeis, 2003). Assuming E (vi|H,e) = 0, residual ê from the first step are incorporated into equation (7) as follow:
uĻi = (Ļi ˆ + vĻi (9)
Following Deaton and Muellbauer (1980), the properties of classical demand theory can be imposed on AIDS model. The adding-up restriction is given as:
Homogeneity is imposed as:
(11)
Slutsky symmetry is given as:
γij = γji, i ≠ j.
(12)
3.2 Data
This study used the national social and economic survey of household in Indonesian (SUSENAS) in 2011 from quarter 1 to quarter 3. The total sample of households in the 2011 SUENAS for Yogyakarta consists of 2,714 households from 1 city and 4 regencies encompassing Yogyakarta City, Sleman, Kulonprogo, Bantul and Gunung Kidul respectively. SUSENAS in 2011 provides food and non-food expenditures. Food expenditures consist of 225 food commodities. For the purpose of this study, we classify to 10 food groups encompassing: (1) cereals (2) fish; (3) meat; (4) eggs and milk; (5) vegetables; (6) fruits; (7) oil and fats; (8) prepared food and drink ;(9) other foods; and (10) tobacco products. Non-food expenditures consist of 6 commodity groups encompassing housing and household facility, goods and services, clothing, footwear, and headgear, durable goods, taxes and insurance, and parties and ceremony.
In the first-stage budgeting, food and non-food demand are estimated using monthly food and non-food expenditures data. The 2011 SUSENAS provides information prices for each food commodities. Weighted average of price within groups using budget share as a weight is used to calculate aggregate price for each food groups (Moschini,1995). Since information prices for non-food expenditures are not available in the 2011 SUSENAS, consumer price indexes in every regency/city are used to calculated non-food price (Jensen and Manrique, 1998).
In the second-stage budgeting, this study estimate demand for ten food groups. Weekly food expenditures data are used in estimating food demand. Estimating demand system requires complete price information. If missing or unreported aggregate price exists in the second-stage budgeting, this price is calculated by regressing observed prices on four regional dummies (Kulonprogo, Bantul, Yogya City and Sleman), seasonal dummies (quarter 2 and quarter 3), and income ( Heien and Wessells,1988). The SUSENAS in 2011 reports household income but missing income data for Yogyakarta are 25.09 % of total sample. Total household expenditure, therefore, is used as a proxy for income (Deaton 1996; Moies, 2003).
4. ESTIMATION AND RESULTS
4.1. Estimation Procedures
As previously discussed, in the first-stage budgeting total expenditure are allocated between food and non-food expenditure. The household survey reported by the SUSENAS reports both non-food and non-non-food expenditure. However, the SUSENAS provides some zero expenditures in given type food expenditures in the second-stage budgeting. Unavailable data from the 2011 SUSENAS for cereals, fish, meats, eggs and milk, vegetables, fruits, oil and fats, prepared foods and drinks, other foods and tobacco products are 11.13%, 57.77%, 56.82%, 20.93%, 15%, 20.93%, 13.85%, 9.73% and 48.31% respectively for Yogyakarta. Prepared food and drink group has no zero expenditures. The non-purchase for given food might be due to no preference, infrequency of purchase, and survey error during survey period.
biased estimation for a system of equations with limited dependent variables in the demand system can be solved by using the consistent two- step estimation procedure for cereals, fish, meats, eggs and milk, vegetables, fruits, oil and fats, other foods and tobacco products proposed by Shonkwiler and Yen (1999). Probit model is applied to determine the probability of buying a given type of food group in the first-step estimation. Because it is possible correlation among the different foods, this study employs the multivariate probit regression (Pan, Monhanty, and Welch, 2008). In this case, the multivariate Probit regression is estimated simultaneously for the ten food groups. The explanatory variables are the logarithms of prices of the ten studies food groups, the logarithms of total household expenditure and demographic variables that are same as those used in equation (7). The probit regression is defined as :
prob (yĻit = 1| ZĻh ) = 1 - ((ZĻhĹ(τ
Ļi) (13)
prob (yĻit = 0| ZĻh ) = 1 - ((ZĻhĹ(
τĻi) (14)
where Zh is a vector of explanatory variables in probit estimation and τi is the vector of associated parameters for the commodities in probit estimation.
Both the estimated standard normal probability density function (PDF) and the estimated standard normal cumulative distribution function (CDF) from the first-step estimation are augmented in the AIDS model. Finally, the AIDS model in the second-stage budgeting is (Shonkwiler &Yen 1999):
wĻi = {Ļi + Ļ ( j = 1)Ĺn γ
Ļij lnpĻj + Ļi ln (X / (P) ) + uĻi }( (.) + τĻ (.) + Ļi (15)
where ( and () are cumulative distribution function (cdf) and probability distribution function (pdf), respectively. Incorporating ( and into the system of equation (15) in the second step estimation causes heteroscedasticity (Shonkwiler&Yen 1999). This heteroskedasticity in the second-step estimation of demand system leads to inefficient but consistent parameter estimates (Shonkwiler and Yen, 1999; Green, 2012).
The Marshallian price and expenditure elasticities of the AIDS model with censoring model in the second-stage budgeting are calculated as follows:
eĻij = 1/ WĻi {γĻij - Ļi (Ļih + Ļ ( j = 1)Ĺn γĻij lnpĻj ) } (Ļi - (Ļij (16)
eĻi = 1 + 1/ WĻi [ Ļi ] (Ļi eĻi = 1 + 1/WĻi [ Ļi ] (Ļi (17)
where eij and ei are Marshallian price and expenditure elasticities, (Ļij is the Kronecker delta (1 if i = j and 0 otherwise).
The price and expenditure elasticities are computed on the basis of parameter estimated and sample means of independent variables using equation (16) and (17) and the delta method is used to calculate standard errors of both price and expenditure elasticities.
Demand elasticity for price and expenditure elasticities of demand for ten food groups in the second-state budgeting are conditional on total food expenditure in the first-stage budgeting. Unconditional price (σij) and expenditures (ωi ) elasticities are calculated following procedures proposed by Edgerton (1997) and are given as:
(Ļi j = eĻij + eĻi [wĻ j + ʲ
Ļij wĻ j ] (18)
(Ļi = eĻi ʲ
where eij is the conditional Marshallian price elasticity, ei is the conditional expenditure elasticity for j th food groups, ʲ
ij is the Marshallian price elasticity of food in the first-stage budgeting, wj is the expenditure share of j th food groups, and ʲ
i is the unconditional expenditure elasticity for food in the first-stage budgeting. Finally, following Park et al (1996) the income elasticity for i th food groups is given:
(Ļi = (Ļi ʲ
Ļy (Ļi = (Ļi ʲĻy (20)
where (Ļi is the unconditional expenditure elasticity for i th commodity within food groups and (Ļy the income elasticity of food in the first-stage budgeting.
4.2. Results and Discussion
There are only two broad commodity groups for the first stage of the demand system: food and non-food commodity and the second stage consists of ten commodities within the food group: cereals, fish, meats, eggs and milk, vegetables, fruits, oil and fats, prepared food and drink, other foods and tobacco products. The Working-Leser is estimated by the Ordinary Least Squares (OLS). The first stage demand system results an unconditional price and expenditure elasticities of food. The results for the first-stage commodity groups show that own-price, expenditure and income elasticity of food are -0.925; 0.68; and 0.376 respectively. Meanwhile, own-price, expenditure and income elasticity of food are -0,202; 1.356; and 0.793. Demand are less price elastic for both food and food in Yogyakarta. Income elasticities for food and food are all less than one. Therefore, both food and non-food are necessity good but non-food are less elastic than non-non-food1.
Table 1 represent probit estimation for nine food groups except prepared food and drink since the prepared foods and drinks have no zero expenditures. As previously mentioned, there are three explanatory variables namely demographic, price and income variables that affect the probability of buying food in probit model. Among 61 demographic variables, 31 variables are statistically significant at 10% or lower levels but gender and dummy variable for quarter 2 and 3 do not influence strongly demand for the ten foods. 41 of 90 price variables are statistically significant at 10% or lower levels. Of 9 expenditure variables, 7 variables are statistically significant at 10% or lower levels. In general, most of explanatory variables ( 54.97%) in the probit model are statistically significant. Therefore, demographic, price and income variables play a important role in determining whether household buy or not foods in Yogyakarta.
The second step the AIDS model includes PDF and CDF from the first step probit model for food demand and is estimated by Full Information Maximum Likelihood (FIML) estimation with imposition of homogeneity and symmetry. Table 2 reports estimated parameters of the AIDS demand system for food demand in Yogyakarta. 9 of 10 parameter estimates for the standard normal PDF in the AIDS model are statistically significant at the 1% level. These results indicate that the probability of buying a given type of food groups for those households who did not buy foods during survey period exists. These findings provide strong evidence that zero observations must be included in estimating demand for food in Yogyakarta. The Dependent variables in the AIDS demand system are expenditure share and the explanatory variables consists of economic (price and expenditure) and demographic variables. Among 100 price variables, 79 price coefficients (79%) are statistically significant at 10% or lower levels. Of 10 expenditure variables, all expenditure variables are statistically significant at 10% or lower levels. Among 70 demographic variables, 52 (72.29%) variables are statistically significant at 10% or lower levels. Therefore, including demographic variables could explain better demand for food in Yogyakarta
Table 3 reports the full matrix of the conditional Marshallian (uncompensated) price and expenditure elasticities for the 10 food groups. All price and expenditure elasticities are evaluated on the basis of parameter estimated and sample means of independent variables using equation (16) and (17). Standard errors of both price and expenditure elasticities are calculated using the delta method. The diagonal elements in table 4 are own-price elasticities. All own-price elasticities are negative and statistically significant at 1% level. The estimated conditional
Marshallian cross-price elasticities are indicated by the non-diagonal elements in table 4. Among 90 cross-price elasticities, 72 cross-price elasticities are statistically significant at 10% or lower levels. The last row of table 4 presents the estimated conditional expenditure elasticities. All conditional expenditure elasticities are positive and statistically significant at 1% level.
Of interest demand elasticity is unconditional demand elasticity because demand for foods are conditional on demand for all commodities. The unconditional Marshallian price and expenditure elasticities are shown in Table 4. Unconditional demand elasticity is calculated using equation (18) and (19). All own-price elasticities are negative and range from -0.429 for cereals to -1.463 for meat. These results indicate that food demands in Yogyakarta are consistent with economic theory. All own-price elasticities are less than unity, except for meat and tobacco products. demand for cereals is least responsive to price change. On other hand, demand for meat is most responsive food groups to price change. As expected, these results are consistent with the diary habits of consumer in Yogyakarta because cereals with rice as one of subgroups is a basic food and meats are not a main dish. The signs of cross-price elasticities show the studied food products are a mixture of gross substitutes and complements. Fish category, for instance, is a gross substitute for cereals, vegetable, oils and fats, other foods but it is a gross complement for, eggs and milk, fruits, prepared foods and drinks, and tobacco products category. Egg and milk category is a gross substitute for cereals, meat, oils and fats, other foods, and tobacco products, but it is a gross complement for, fish, fruits, vegetables, and prepared foods and drinks. All unconditional expenditure elasticities are positive and from 0.2896 for fish to 0.8156 for prepared food and drink. However, economist and policy maker concern about income elasticity instead of expenditure elasticity in formulating and designing economic policy. Unconditional income elasticities range from 0.1089 (fish) to 0.3067 (prepared food and drink). All income elasticities are very low and less than 0.4 so that all ten food groups are necessities goods but very inelastic to income change. Consequently, relatively low income elasticities for the ten studied foods imply that consumers in Yogyakarta are not responsive to per capita change as income increase.
5. CONCLUSIONS
Separability and two-stage budget procedures are applied to analyze the demand for the ten studied foods in Yogyakarta. The complete demand system of Yogyakarta household for the ten studied foods is estimated using the almost ideal demand system (AIDS). To accomplish this goal, the national social and economic survey of household in Indonesian (SUSENAS) in 2011 are used. Because of zero expenditures in given types of food in the 2011 SUSENAS, this study applies the two-step consistent estimation.
REFERENCES
Alston, J. M, K. A. Foster and R. C. Green.1994.“ Estimating Elasticities with the Linear Approximate Almost Ideal Demand System: Some Monte Carlo Results.” Review of Economics and Statistics, 76, pp. 351-56
Blundell, R., and J.M. Robin. 1999. Estimation in Large and Disaggregated Demand Systems: An Estimator for Conditionally Linear Systems.” Journal of Applied Econometrics, 14, pp. 209-232.
Cern, S. Wen, K. Ishboshi, K. Taniguchi and Y. Tokoyama. 2003. Analysis of Food Consumption Behavior by Japanese Households. Food and Agricultural Organization: Economic and Social Development, Paper 152.
Central Bureau of Statistics (CBS) Yogyakarta, 2008-2012.
Deaton, Angus and J. Muellbauer. (1980). An Almost Ideal Demand System, American Economic Review, 70, pp. 312-326.
Deaton, Angus. 1996. The Analysis of Household Surveys: A Microeconometric Approach to Development Policy. Baltimore: John Hopkins University Press.
Edgerton L. David. 1997. “ Weak Separability and the Estimation of Elasticities in Multistage Demand System.” American Journal of Agricultural Economics, 79, pp. 62-79.
Fabiosa, J.F., Jensen, H., and Yan, D. 2005. “Household Welfare Cost of the Indonesian Macroeconomic Crisis”. Selected Paper prepared for presentation at the American Agricultural Economic Association Annual Meeting, Rhode Island, 24-27 July. http://ageconsearch.umn.edu/bitstream/19311/1/sp05fa01.pdf. (Accessed December, 21, 2011)
Green, William H. 1997. Econometric Analysis, 3th edition. Prentice Hall, New Jersey.
Heien, D., and Wessels, R. 1988. The Demand for Dairy Products: Structure, Prediction, and Decomposition American Journal of Agricultural Economics, 70, pp.219-28.
______.1990. “Demand System Estimation with Microdata Censored Regression Approach.” Journal of Business and Economic Statistics, 8, pp. 365-71.
Jensen, Helen H., and Justo Manrique. 1998. “Demand for Food Commodities by Income Groups in Indonesia.” Applied Economics 30, pp. 491-501.
Leser, C.E. 1963. “Forms of Engle Functions.” Econometrica, 31, pp. 694-763.
Moeis, J. Prananta. 2003. “Indoesian Food Demand System: An Analysis of the Impact of the Economic Crisis on Household Consumption and Nutritional Intake.” Unpublished Doctor of Philosophy’s Dissertation.The Faculty of Columbian College of Art and Sciences, George Washington University.
Moschini, G,. 1995. “Unit of Measurement and the Stone Index in Demand System Estimation.” American Journal of Agricultural Economics, 77, pp. 63-68.
Pan, S., S. Monhanty, and M. Welch. 2008. “India Edible Oil Consumption: A Censored Incomplete Demand Approach.” Journal of Agricultural and Applied Economics, 40, pp. 821-35.
Pangaribowo, E. Hanie and D. Tsegai. 2011. “Food Demand Analysis of Indonesian Households with Particular Attention to the Poorest.” ZEF-Discussion Papers on Development Policy No. 151.http://ageconsearch.umn. edu/bitstream/116748/2/DP151.pdf.Accessed December, 21, 2011.
Shonkwiler, J.S., and S.T. Yen. 1999. “Two-Step Estimation of a Censored System of Equations.” American Journal of Agricultural Economics, 81, pp. 972-82.
Widodo, T. 2004. Demand Estimation and Household’s Welfare Measurement: Case Studies in Japan and Indonesia. http://harp.lib.hiroshima-u.ac.jp/bitstream/harp/1956/1/keizai2006290205.pdf.(Accessed December 21, 2011).
Yen, S. T., K. Kan and Shew-Jiuan Su. 2002. “Household Demand for Fats and Oils: Two Step Estimation of a Censored Demand System.” Applied Economics, 14, pp. 1799-806.
Yen, S.T., B. Lin., and D.M. Smallwood. 2003. “ Quasi-and Simulated-Likelihood Approaches to Censored Demand Systems: Food Consumption by Food Stamp Recipients in the United States.” American Journal of Agricultural Economics, 85, pp. 458-78.
Food Demand in
Yogyakarta: Susenas 201
(Agus W
idarjono)
Cereals Fish Meat Eggs and
Milk Vegetables Fruits Oils and fats Other foods
Tobacco products
Constant 17.445*** -11.287*** -5.736*** -2.607 26.705*** -7.057*** 23.982*** 24.980*** 3.786
Area -0.500*** -0.036 0.237 0.050 -0.539*** 0.254*** -0.487*** -0.574*** -0.063
Household size 0.785*** 0.127*** 0.134*** 0.312*** 0.626*** 0.065** 0.666*** 0.635*** 0.111***
Age of household head 0.018*** 0.008*** 0.011*** 0.010*** 0.015*** 0.014*** 0.015*** 0.008** -0.007***
Education of household head 0.022 0.012 0.003 0.007 0.009 0.009 0.013 0.024 -0.058***
Gender -0.007 0.318*** 0.250*** -0.058 0.060 -0.224*** 0.023 -0.128 0.821***
Quarter 2 -0.094 0.110* 0.075 0.101 -0.122 0.040 -0.149 -0.148 -0.002
Quarter 3 0.019 0.106 0.192 0.121 0.019 0.062 -0.017 -0.006 0.029
Price of cereals 0.270 0.419* 0.413* 0.128 -0.130 0.336 -0.107 -0.186 0.141
Price of fish -0.391*** -0.727*** 0.015 -0.101* -0.349*** -0.071 -0.355*** -0.304*** -0.012
Price of meat -0.183 -0.017 -0.047*** -0.497 -0.132 -0.065 -0.165 -0.202 -0.026
Price of eggs and milk -0.507*** 0.201 -0.157 -0.061*** -0.615** -0.003 -0.561*** -0.510*** 0.045
Price of vegetables -0.145*** 0.018** 0.022* -0.157 -0.198*** -0.623 -0.244*** -0.224*** -0.092
Price of fruits 0.171 -0.033 -0.154 0.354** -0.693** -0.015*** -0.277*** -0.132** -0.156*
Price of oils and fats -0.338 -0.039 -0.114 -0.275** -0.477*** -0.078 -0.470 -0.431 -0.054
Price of prepared food and drink
-0.035*** 0.223 0.230* 0.172*** 0.183*** 0.223 0.092*** -0.457*** -0.088
Price of other foods -0.674 0.120*** 0.295*** -0.177*** -0.685*** -0.091*** -0.710 -0.566*** -0.486*
Price of tobacco products -0.170*** 0.069 -0.846*** -0.183 -0.280*** -0.126 -0.265*** -0.232*** -0.041***
Total expenditure -0.085 0.588*** 0.590*** 0.677*** 0.162* 0.846*** 0.145 0.193* 0.206***
Note: Single, double and triple asterisk denote statistical significance at the 10%, 5% and 1% respectively.
11
olume 17, No.2, Th. 2013 Hal. 104-1
18
Item Cereals Fish Meat Eggs and
Milk Vegetables Fruits
Oils and fats
Prepared food and
drink
Other foods
Tobacco products
Constant -0.0783*** 0.1152*** 0.1054*** 0.1461*** 0.1889*** 0.1699*** -0.0248** 0.0220** 0.0984*** 0.1855***
Area -0.0601*** 0.0006 -0.0002 0.0066*** -0.0283*** 0.0126*** -0.0285*** 0.1003*** -0.0066*** 0.0077***
Quarter 2 0.0163*** -0.0020 -0.0024 -0.0024 -0.0129*** -0.0022 0.0045*** 0.0273*** -0.0220*** -0.0055***
Quarter 3 0.0202*** -0.0045*** -0.0011 -0.0004 -0.0268*** 0.0008 -0.0047*** 0.0259*** -0.0025** -0.0073***
Household size 0.0328*** -0.0027*** 0.0001 -0.0012 0.0060*** -0.0085*** 0.0095*** -0.0369*** 0.0014*** 0.0000
Age of household head 0.0007*** -0.0001 -0.0003*** -0.0002*** 0.0003*** 0.0000 0.0007*** -0.0005*** 0.0000 -0.0010***
Education of household head
-0.0009*** 0.0010*** 0.0001 0.0021*** -0.0013*** 0.0017*** -0.0003 0.0004 -0.0003** -0.0030***
Gender 0.0221*** -0.0052* 0.0074** -0.0217*** -0.0059*** -0.0168*** 0.0046** -0.0110*** -0.0044*** 0.0594***
Price of cereals 0.0890*** -0.0120*** -0.0012 -0.0156*** -0.0010 -0.0223*** 0.0128*** -0.0389*** -0.0034*** -0.0075***
Price of fish -0.0120*** 0.0018* 0.0002 0.0027*** -0.0042*** 0.0051*** -0.0047*** 0.0095*** -0.0005 0.0020*
Price of meat -0.0012*** 0.0002 -0.0145*** -0.0002 -0.0079*** 0.0037*** -0.0030* 0.0115*** -0.0034*** 0.0147***
Price of eggs and milk -0.0156*** 0.0027*** -0.0002 0.0109*** 0.0004*** 0.0034*** -0.0011 0.0024*** -0.0010** -0.0020***
Price of vegetables -0.0010 -0.0042*** -0.0079*** 0.0004 0.0136*** 0.0003 -0.0049*** 0.0070*** 0.0007 -0.0041***
Price of fruits -0.0223*** 0.0051*** 0.0037*** 0.0034*** 0.0003 0.0179*** -0.0054*** -0.0023*** -0.0010* 0.0006
Price of oils and fats 0.0128*** -0.0047*** -0.0030* -0.0011 -0.0049*** -0.0054*** 0.0178*** -0.0117*** 0.0032*** -0.0031
Price of prepared food and drink
-0.0389*** 0.0095*** 0.0115*** 0.0024*** 0.0070*** -0.0023*** -0.0117*** 0.0119*** 0.0013 0.0092***
Price of other foods -0.0034*** -0.0005 -0.0034*** -0.0010** 0.0007 -0.0010* 0.0032*** 0.0013 0.0086*** -0.0045***
Price of tobacco products
-0.0075*** 0.0020* 0.0147*** -0.0020*** -0.0041*** 0.0006 -0.0031** 0.0092*** -0.0045*** -0.0054***
Expenditures 0.0118*** -0.0130*** -0.0080*** -0.0146*** -0.0109*** -0.0195*** 0.0076*** 0.0841*** -0.0061*** -0.0230***
PDF 0.0801*** 0.0214*** 0.0312*** 0.0498*** 0.0215*** 0.0493*** 0.0049 0.0275*** 0.0983***
Note: Single, double and triple asterisk denote statistical significance at the 10%, 5% and 1% respectively.
Food Demand in
Yogyakarta: Susenas 201
(Agus W
idarjono)
Cereals Fish Meat Eggs and
milk Vegetables Fruits Oils and fats
Prepared food
and drink Other foods
Tobacco products
Cereals -0.443*** -0.085*** -0.007 -0.111 -0.015*** -0.154*** 0.079*** -0.246*** -0.019** -0.047***
0.027 0.009 0.013 0.007 0.015 0.008 0.018 0.010 0.008 0.012
Fish -0.452*** -0.862*** 0.007 0.197*** -0.108*** 0.307*** -0.183*** 0.397*** -0.039 0.079*
0.058 0.046 0.034 0.024 0.036 0.029 0.040 0.043 0.025 0.043
Meat -0.012 0.035 -1.464*** 0.035 -0.221*** 0.161*** -0.089 0.365*** -0.118*** 0.468***
0.063 0.027 0.048 0.022 0.042 0.028 0.055 0.040 0.028 0.042
Eggs and milk -0.245*** 0.075*** -0.003 -0.772*** 0.039*** 0.102*** -0.013 0.039*** -0.026*** -0.036***
0.018 0.009 0.011 0.017 0.013 0.009 0.013 0.014 0.009 0.010
Vegetables 0.002 -0.034*** -0.090*** 0.024*** -0.831*** 0.024** -0.052*** 0.078*** 0.004 -0.047***
0.027 0.010 0.015 0.008 0.022 0.011 0.018 0.010 0.009 0.014
Fruits -0.444*** 0.159*** 0.079*** 0.141*** 0.058*** -0.539*** -0.106*** -0.054*** -0.038*** 0.008
0.029 0.015 0.019 0.012 0.021 0.027 0.023 0.020 0.014 0.018
Oils and fats 0.145*** -0.066*** -0.035* -0.028*** -0.070*** -0.080*** -0.788*** -0.139*** 0.041*** -0.036**
0.033 0.012 0.020 0.009 0.019 0.013 0.034 0.016 0.012 0.018
Prepared food and drink
-0.112*** 0.000 0.028*** -0.025*** -0.008*** -0.039*** -0.033*** -0.970*** 0.011*** 0.024***
0.004 0.003 0.004 0.002 0.002 0.002 0.004 0.005 0.002 0.003
Other foods -0.090** 0.008 -0.109*** -0.001*** 0.047*** 0.000 0.106 0.040*** -0.733*** -0.147***
0.038 0.019 0.027 0.016 0.026 0.019 0.031 0.026 0.023 0.025
Tobacco products -0.047*** 0.041*** 0.131*** 0.014*** -0.011 0.040*** -0.023* 0.081*** -0.048*** -1.050***
0.017 0.009 0.012 0.005 0.011 0.007 0.014 0.009 0.007 0.014
Expenditure 1.075*** 0.426*** 0.741*** 0.747*** 0.876*** 0.575*** 1.091*** 1.199*** 0.805*** 0.624***
0.005 0.030 0.026 0.011 0.011 0.012 0.015 0.001 0.017 0.013
Note: Numbers in the first and second row are the estimated elasticities and t values respectively. Single, double and triple asterisk denote statistical significance at the 10%, 5% and 1% respectively.
11
olume 17, No.2, Th. 2013 Hal. 104-1
18
Cereals Fish Meat Eggs and
Milk Vegetables Fruits
Oils and Fats
Prepared Food and Drink
Other Foods
Tobacco products
Price of Price Elasticity
Cereals -0.4299 -0.0840 -0.0055 -0.1074 -0.0095 -0.1524 0.0863 -0.2080 -0.0170 -0.0438
Fish -0.4390 -0.8610 0.0082 0.2006 -0.1027 0.3092 -0.1762 0.4348 -0.0374 0.0818
Meat 0.0006 0.0359 -1.4624 0.0383 -0.2153 0.1630 -0.0818 0.4025 -0.1165 0.4712
Eggs and milk -0.2322 0.0754 -0.0016 -0.7691 0.0445 0.1040 -0.0064 0.0768 -0.0242 -0.0336
Vegetables 0.0142 -0.0328 -0.0883 0.0274 -0.8249 0.0258 -0.0455 0.1161 0.0054 -0.0445
Fruits -0.4312 0.1600 0.0807 0.1442 0.0642 -0.5367 -0.0992 -0.0160 -0.0363 0.0113
Oils and fats 0.1573 -0.0656 -0.0336 -0.0244 -0.0640 -0.0776 -0.7815 -0.1015 0.0431 -0.0334
Prepared food and drink -0.0992 0.0008 0.0295 -0.0220 -0.0023 -0.0368 -0.0260 -0.9318 0.0124 0.0266
Other foods -0.0771 0.0085 -0.1073 0.0027 0.0527 0.0018 0.1125 0.0783 -0.7307 -0.1438
Tobacco products -0.0338 0.0420 0.1331 0.0175 -0.0053 0.0416 -0.0158 0.1188 -0.0465 -1.0472
Expenditure and Income Elasticity
Expenditure 0.7312 0.2896 0.5041 0.5080 0.5955 0.3908 0.7421 0.8156 0.5473 0.4246
Income 0.2749 0.1089 0.1895 0.1910 0.2239 0.1469 0.2790 0.3067 0.2058 0.1597
IMPACTS OF SUGAR IMPORT POLICY ON SUGAR PRODUCTION IN INDONESIA
Agustinus Suryantoro Albertus Magnus Susilo
Supriyono
Faculty of Economics Universitas Sebelas Maret E-mail : [email protected]
Abstract
Production of sugar unful lled consumption of Indonesia society. The lack of consumption and production have ful lled by import. Assumption national consumption 2,7 million ton, Indonesia will import sugar in 2013 predicted about 300.000 ton (Tempo.co, August, 21, 2012).
The aims in general of this research are to understand the impact of sugar import policy on sugar production. Especially (1) to understand the factors that in uence sugar import price, (2) to understand impact of sugar import price on sugar domestic price and (3) to understand the impact of sugar domestic price on sugar production.
Model analysis of this research is Simultaneous Error Correction Model. This model can estimate the structural parameter exactly (unbiased parameter) (Gujarati, 2010). Policy made on this research can be responsibly. The results of this research are shown that price of sugar import in uenced by world sugar price and the quantity of sugar imported and tariff is not. Price of domestic sugar in uenced imported sugar price. And domestic sugar price has in uence the sugar production.
Import policy in sugar to ful ll lack of consumption and production will make decreased sugar domestic price. The decrease of sugar domestic price will impact on decrease of sugar production. That policy have dilemma on consumption and production.
Keywords:sugar imported, price of sugar imported, sugar domestic price, sugar production and policy dilemma.
1. BACKGROUND ISSUES
Indonesian sugar industry faces a variety of interrelated issues, such as the placement of sugar as one of the basic needs. Consequences are distribution and prices intervention by the government; producer of sugarcane as raw materials and sugar factory that process raw materials into sugar and its distribution is a separate organization. Also inefficiency both at the farm and the factory is still going on, the bias of government policy, as well as the high trade distortions in the international market. As a result, productivity and yield tends to decrease, which in the long run will threat the existence of the sugar industry in Indonesia.
National sugar stock is currently prone (AGFI, 2012). According to the Indonesian Sugar Council report of January 2012, the national sugar stock position at 15 December 2011 was 667,000 tons. With an average consumption of 220,000 tons a month, it is only enough supplies for a period of 2.5 months.
Physically AGFI sugar farmers’ living record of 30,000 tons (4.6%), sugar traders belonging 378.000 tons (57%), sugar mills owned by 258 000 tons (38%). Of physical stock report could be summed sugar farmers’ relatively already sold out. Compared to sugar production by 2011 realized that only 2.1 million tons from 2.7 million tons a target for the stock is safe, then the conditions of production of sugar Indonesia will experience a major shortage in the coming years.
Lack of sugar consumption will be covered with imports. Since 1995 sugar imports have continued to rise; although in 2004 imports slightly decreased compared to the previous year (around 1.35 million tons to 1.34 million tons). Since 2004, imports have continued to rise, and even in 2010 imports reached 2.37 million tons, which is 55 percent of consumption. Condition suggests that the Indonesian sugar commodity markets become highly dependent on external markets.
From one side, sugar consumption increases, but on the other hand the performance of Indonesian sugar industry has declined. Diminishing performance of Indonesian sugar industry caused by a variety of interrelated issues. In general, these problems are:
1) Decrease irrigation sugarcane area and increase dry land area 2) Inefficiency farming
3) Inefficiency at the plant level 4) Unfair competition
1) Decrease irrigation sugarcane area and increase dry land area
In the decade of the 1990s, Indonesia sugarcane acreage declined at a rate of -0.50% / year, in which the irrigation area of sugarcane fields to decline and dry land area moor up. Condition is partly due to higher competition in land use, especially with rice. The movement of area for sugarcane to rice growing stronger as a result of government policy bias to the rice. For example, the ratio of the original price of sugar and rice around 2.40, has dropped to 1.86 (Rusastra, et al, 2000; Sudana, et al 2000).
Government policy in the provision of credit for sugarcane farming is often late and inadequate numbers also have contributed to the decline in sugarcane acreage (Woeryanto, 2000). Sugarcane cultivation requires more time than the farming of food crops such as rice (Woeryanto 2000) so that the availability of credit is necessary. Uncertainty in the availability of credit to make farmers hesitant to even divert sugarcane cultivation farming faster payback period, such as rice or onion (Husodo, 2000; Murdiyatmo, 2000; Pakpahan, 2000; Woeryanto, 2000).
2) Inefficiency Farming
Along with the decrease in acreage, sugarcane farming is inefficient, as reflected in a decrease in productivity. In 1990, the productivity of sugarcane approximately 76.90 tons of cane/ha, and in 1999 only 62.70 tons/ha (Hadi and Sutrisno, 2000 ) or decreased -2.24%/year. Productivity stemming from non optimal low cropping systems due to 1) the quality of the plant material is not good, 2) profit-sharing system between farmers and sugar factory were assessed farmers lacked transparency, 3) the low price especially in the last decade, and 4) unfavorable government policies.
3) Inefficiency in the factory
The second factor is the limited availability of raw materials so that the plant operates under optimal capacity. Decline in sugarcane acreage has reduced the availability of raw materials. Sugar factory is often difficult to achieve minimal capacity. In the last 10 years, from 59 sugar factory in Java, 17 factories have a total day ground below the national standard milled 150 days/year. With minimum criteria milling capacity of 2,000 tons cane/day, 28 million does not meet these standards (Arifin, 2000).
4). Unfair Competition
Before 23 September 2002, when the policy of import trade system implemented, Indonesian sugar industry faced with unfair competition, both in the aspect of production and trade. Very distorted world sugar industry, sugar industry while Indonesia only protected by a tariff of 25%. The main producer and consumer nations do subsidies and protect. This condition became the world sugar trade highly distorted (Devadoss and Kropf, 1996; Noble, 1997; Groombridge, 2001; Kennedy, 2001). Average world sugar prices in the last decade of U.S. $ 8.36 ¢ / lb (1 lb = 0.48 kg) are far below production costs averaged U.S. $ 17.46 ¢ / lb. Groombridge (2001) and Kennedy (2001) states that the sugar industry is an industry with the highest level of distortion due to the strong intervention of the government to protect the sugar industry respectively.
2. RESEARCH PROBLEMS
The problem in this study can be seen from the condition of the domestic sugar industry in terms of production, consumption and its relation to the world sugar market. From the production side, in the conditions of inefficient production and diminishing land area will be able to survive in the era of globalization? Whether the increasing gap between production and consumption which shows the dependence of consumption on imports can be sustained?
Of issues related to some aspects of the sugar industry, then this study more emphasis on production, consumption and imports of consumer needs. Election studies on aspects of production, consumption and imports as sugar import policy will greatly affect the structure and the national sugar production. With the import policy, the national sugar producers will be faced with competition from international sugar levels. The domestic sugar production has a higher competitiveness compared to other countries, it will increase sugar production and sugar markets will be more extensive. However, the opposite will happen if the national sugar industry competitiveness is lower when compared to other countries, the production will have an adjustment.
Increase in sugar price in the market is seen as signaling a lack offers in comparison to demand. Situation is resolved by importing sugar to meet the shortfall of supply. With the influx of imported sugar will affect the domestic sugar prices and production.
For producers, government intervention policy in the commodity is not seen in the range of policies, but its effect on the price of the commodity itself, so the price of the product used as consideration in production.
Therefore, it is specifically the main issues raised in this research are: What factors are affecting the price of imported sugar?
What is the relationship between the domestic sugar market and world sugar markets on the domestic sugar price?
3. LITERATURE REVIEWS
3.1. Theory Overview
Discussion of theoretical models of industry begins with a discussion of theoretical models of production, then the market of commodities.
1. Sugar Production
Actors in the production of the sugar industry consist of farmer as landowners and sugar factory as a provider of processing services to sugarcane. Since the President Instruction No. 9 of 1975, is no longer a sugar mill plantation company, as its main task to processing or grinding sugarcane produced by farmers.
Production of sugarcane produced by farmers will be processed into sugar in the sugar mills. How big is the amount of sugar produced from sugarcane is processed depends on yield ratio (“rendemen”); which is the ratio between the amount of sugar produced by the sugarcane milled.
Production of sugar produced is the product of the yield of the sugarcane production amount, or,
QDGL = REN * QTB (1)
Where, QDGL is sugar production, REN is yield ratio and QTB is a sugarcane production.
By looking at the sugar factory function only as a sugarcane mill, the sugar production is largely determined by the farmers who grow sugarcane. Farmers as land owners are also faced with the alternative use of the land for other crops.
Farmers in choosing which plants will be grown on beside depending on the expected results of the plants, also take into account the opportunity costs of other plant.
TR = QDGL *PDGL (2)
TR is total revenue and PDGL is the price of sugar.
Figure 1. Production Possibility Curve
With a number of its factors of production, farmers can produce maximum production alternatives on the production possibility curve. The production possibility curve can be formulated:
A 0 = f (QDGL, QGB) (3)
where:
A 0 : Factors of production are owned by farmers (in this research is area) QDGL : The amount of domestic sugar production
QGB : The amount of un hulled rice grain production
At equilibrium, the farmers who have given input will produce a combination of production in which the marginal rate of product transformation (MRPTGL.GB = dQGB/dQGL) is equal to the ratio between sugar and grain prices (PGL / PGB). In other words, the slope of the production possibilities curve equal with iso-revenue curve slope, so the optimum combination of sugarcane and rice production reached at: MRPTGL.GB = dQGB/dQGL) = (PGL / PGB). Therefore, the use of inputs (e.g. land) to produce output such as sugar (cane) can be written as follows:
AGL = f (PDGL, PGB, PX) (4)
where,
AGL : Sugarcane acreage PDGL : Price of domestic sugar PGB : Rice price
PX : Input price
X = PGL.QGL/X - PXX/X = 0 (5)
PDGL . MPX = PX
This means that producer will reach equilibrium where the value of the marginal product of inputs used together equal with input prices.
So the demand for factors of production/input (area) can be represented by the price of output and prices of input and formulated as follows:
DAGL = f (P
DGL,PGB,PA) (6) Through the response area, the total production can be calculated by multiplying the area planted with sugarcane productivity, YTB:
QDGL = ADGL.YTB (7)
Since ADGL and YTB is a function of product prices, commodity prices and input prices competitors, the sugar production is a function of the prices of sugar, un-hulled grain prices and input prices, or:
QDGL = f (PDGL, PGB, PA) (8)
2. Sugar Market
As the country is still importing sugar, the domestic sugar production faced competition from imported sugar. With the competition from imported sugar, then the behavior of domestic sugar producers will be faced with the behavior of the import manufacturers. The production of sugar in the country, mostly by state-owned enterprises (PTPN) and the rest is done by the private enterprise. In the sugar production, PTPN role as a processor of sugar cane into sugar. This phenomenon indicates that the limited number of sugar producers; so that the behavior can be seen as an oligopoly market.
Oligopoly market indicates that the sugar industry is only a few manufacturers that domestic producers are private companies, state-owned companies and importers. Behavior of producers (in this case domestic producers) engaged in oligopoly markets are strongly influenced by the behavior of other producers (importers/producers from abroad).
The combination of price, quantity and profit of oligopoly producers depend on the actions of other manufacturers (Henderson and Quandt, 1980). Manufacturers can control their own level of output (or price if the product differentiated), but can not control other variables that affect profit. Profit earned is the result of interaction between actors in the market decision.
No assumptions are generally accepted to see the behavior of producers engaged in an oligopoly market. Assuming sugar producers are only two domestic producers and foreign (imported), the theoretical analysis of the sugar market can be seen more clearly.
a) Quasi Competition Model
Suppose that in the market there are only two companies that produce homogeneous goods. Inverse demand function where the price is a function of the aggregate quantity sold:
P = F (q1 + q2) (9)
q1 and q2 are output level of duopolies. Total revenue from each duopoly depended on the level of output itself and its competitors:
R1 = q1 * F (q1 + q2) = R1(q1 + q2) (10)
R2 = q1 * F (q1 + q2) = R2(q1 + q2) (11)
Rates of return / pro t of each firm are equal to total revenue minus costs, which depend only on its own output level:
1 = R1 (q1 + q2) - C1 (q1) (12)
2 = R2 (q1 + q2) - C2 (q2) (13)
The solution indicated in the perfectly competitive price is equal to the Marginal Cost(MC); while the quasi-competitive duopoly market solution to be defined solution can be achieved if the two seller behavior/rules of the competition. In other words the two producers competing completely, so that the solution conditions on the duopolies are:
P = F (q1 + q2) = C1’ (q1 + q2) (14)
P = F (q1 + q2) = C2’ (q1 + q2) (15)
for P, q1 and q2.
b) Collusion Model
Duopolies can make cooperation (collusion) to maximize the total profit in the industry. Both the output level of the two companies may be controlled and treated as a single output in monopoly markets. Thus,
R(q1+q2) = R1(q1 + q2) + R2(q1 + q2)= (q1 + q2)*F(q1 + q2) (16)
Aggregate profits are,
= 1 + 2 = R1 (q1 + q2) - C1(q1)- C2(q2) (17)
Where, the profit function duopolies as monopolist profit function of both companies. In other words, the company is a “one” monopolist, so the rst order condition shown in MC equal to MR for overall output.
c) Cournot Model
the Cournot duopolies solution each company is going to maximized profits by assuming that the quantity of production of its competitors depends on the quantity produced. First duopolies maximize 1, which depends on q1 to q2 as a parameter considered, both duopolies will maximized 2, which depends on q2 with regard q1 as a parameter.
By taking the partial derivative of equation (17) and equating zero,
1/q1 = R1/q1 - C1/q1 = 0 R1/q1 = C1/q1 (18)
2/q2 = R2/q2 - C2/q2 = 0 R2/q2 = C2/q2 (19)
Maximization process for Cournot solution is not the same for the two cases of oligopoly, in which the two actors will always control the output levels of both. Here, each actor will be profit-maximizing variables that can only be controlled. This means that the MR (marginal revenue) of the two are not the same.
Let q = q1 + q2 and q /q1 = q /q2 = 1.
Ri/q = P + qi p/q (20)
Producers who have a greater output will have a smaller MR.
Manufacturers will seek to maximize profits with respect to output the other manufacturers. In other words, the output of the producer will depend on the output of other manufacturers, so there will be a reaction which is a function of duopolies production output which depends on the output of its competitors, solve the equation (18) above for q1 and equations (19) for q2,
q1 = ψ (q2) (21)
q2 = ψ (q1) (22)
Reaction function is a relationship between q1 and q2 with respect to the value of qi to maximize other benefits. Reaction function of the two equations, it can be found output solution for each manufacturer that provides the maximum benefit for both.
d) Stackelberg Model
In general, the advantages of each duopoly are a function of both the level of output:
1 = h1(q1, q2) (23)
2 = h2(q1, q2) (24)
Each company will make an assumption about the reaction of competitors. Profit maximization of the two is:
In the Stackelberg solution, two duopolies are divided into two categories only leader and one follower. Therefore behave as duopolies will leader commented optimal profits without regard behavior of his followers, while the follower behavior will be based on the behavior of its leader, thus,
2 = h2 [q2 , ψ (q2)] (27)
e) Bertrand Model
Bertrand duopoly model build in 1883 (Koutsoyiannis, 1983, p. 225). The model is different from the Cournot that assumes constant prices set competitors. Assuming the company will behave to maximize profits by assuming competitors will not change the price.
In the Bertrand model reaction curve is the reaction rates, the company will change its price depends on the price set by competitors. Therefore it can be said that products company engaged in the duopoly market depends on the price of its competitors, or,
P 1 = f (P 2) (28) P1 is the price set by the company 1 and P 2 is a set price on a competitor.
3.2. Previous Studies
The study of the sugar has been done since the 1970’s era. Alcantara and Prato (1973) view of the production that emphasizes the scale and input elasticity in Brazil. Similarly Suryantoro (1992) who conducted a study on the behavior of non-TRI farmers in sugarcane production. From the cropping pattern by Djoyosuwardho (1984), the area of the Tjokrodirdjo and Rusli (1984), Systems and Implementation of Community Sugarcane Intensification Program (Adisasmito, 1984), the price of sugar by the Sweep and Hasan (1984), the institutions involved (Prabowo, Suryantoro and Prakosa , 1992a), the marketing of sugar (Prabowo, Suryantoro and Prakosa, 1992b; Swoop 1998; Sugar Study Team, 1990; Gapegti Bulog, 1992). Assessment of socioeconomic done by Mubyarto and Daryanto (1991), and is generally performed by Bulog (1985). Studies specifically on sugar saw its bid response made by Ramulu (1996) in Andhra Pradesh India.
Studies related the analysis of government policy has been done, but the scope of studies tends focus on one policy. The study by the Indonesian Sugar Council (1999) and Wahyudi and Erwidodo (1999) focused on aspects of the analysis of import tariffs. On the other hand, Malian (1999) emphasizes comparative effectiveness pricing policy and tariffs on sugar in the development of the sugar industry in Indonesia. Abidin (2000) analyzed several policies, but policies have not analyzed the period 2002-2003 was very different from the previous policy. Sudana, et al (2000) is more focused study of the reallocation of resources as a result of the liberalization of sugar trade. With a partial view, and Nuryanti Hadi (2005) looked at the effects of non-tariff and tariff policies on the performance of the sugar industry from both macro and micro aspects of farming.
Susila (2004) looked at the effects of the sugar industry protection, Susila and Sinaga (2005) combine policy trade restrictions in the form of tariff rate quotas also combine with domestic policy in the form of input subsidy to the sugar industry in Indonesia. Widyatmini (2006) looked at the effects of sugar import tariffs, the exchange rate of the volume of imports of sugar. The effects of tariff rate quota in the United States conducted by Haley, Jerardo and Kelch (2006) and USDA (2008). Suryantoro (2010) studied on the effects of the sugar trade liberalization on production, consumption and welfare.
4. EMPIRICAL MODEL
and can be written,
Yt-1 = Yt-1 + ut (31)
where = ( - 1) and is the change in the first level (first difference operator). In practice tested whether the value of = 0. If = 0, then = 1, which means there is a unit root problem, which means that the time series data are non-stationary.
2) Degree of Integration Testing
Along with the above test, the test can also be done the degree of integration. Test the degree of integration is performed when the unit root test observed data was not stationary. This test is intended to determine the degree or order of differentiation observed data stationer. Test the degree of integration is an extension of the unit root test. A formal definition: data time series X is said to integrate the degree d or I (d) if the data needs to be differenced times as much data to be stationary or I (0), tests are performed with the following estimation autoregressive models (Insukindro, 1993: 30):
D2X
t = e0 + e1 DXt -1
∑
=k
1 i
i i
f
β
D2Xt (32)
D2X
t = g0 + g1 t + g2 DXt-1 +
∑
=k
1 i
i
h
BiD2Xt (33)
Where Dimana D2X
t = DXt – DXt-1, t = time trend variable and Xt is observed variable in period t.
After the above steps, the next step is to test the value of DF and ADF statistics can be determined by looking at the value of t statistics in regression coefficients DXt-1. If e1 and g2 equal to one, then the variable Xt is said stationary at first differentiation or integration on the degree of one or I (1). Conversely, if e1 and g2 equal to zero, then the variable X has not been stationer at the first differentiation, so that the degree of integration test should be continued until a stationary condition.
3) Co-integration Test
Co-integration test is a continuation of the unit root test and test the degree of integration. To be able to perform co-integration test must first believe that the variables involved in this approach has the same degree of integration or not. In general, most of the discussion of issues related to it has focused on the integration variable zero I(0) or an I(1) (Insukindro, 1993: 132). If two or more related variables have different degrees of integration, the variables can not be co-integrated.
To get an idea of the co-integration approach, considered a set variable X is said co-integrated time series on the degree d, b or CI (d, b) if every element of X integration on the degree d or I (d) and there is a vector k is not equal to zero so that w = k’ X ~ I (db) with d> 0 and k is a co-integration vector (Engel and Granger, 1987:265-270; Insukindro, 1993:132).
An important implication of the illustrations and the above definition is that if two or more variables have a different degree of integration, say X = I (1) and Y = I (2) the two variables can not be co-integrated (Insukindro, 1993: 132). CDRW (Co-integration Regression Durbin-Watson) test, DF (Dickey-Fuller) and ADF (Augmented Dickey-Fuller) is a statistical test of this approach. To calculate CRDW, DF and ADF co-integration regression estimated following the method of ordinary least squares (OLS):
economy), and internal changes resulting from changes in the domestic economy or because of changes sugar policy towards Indonesia.
The approach used to analyze the relationship between variables such as the approach to economic theory, the theory of statistics and econometric theory. This research will use Error Correction Model to analyze the effect between dependent and independent variables. The analysis tool is more relevant if the data is analyzed stationary, because one of the requirements to apply time series regression is the fulfillment of the data that is stationary (Gujarati, 2003).
According Insukindro (1999:2) ECM has the ability to analyze economic phenomena short and long term and assess whether the model is consistent with empirical economic theory, as well as in the search for solutions to the problem of time series variables are not stationary and spurious regression (spurious correlation) in the econometric analysis. In addition, the ECM can also be used to deal with the imbalance (disequilibrium) where the desired economic actors are not the same as the reality of the matter, therefore needs to be adjusted. By using ECM, can also be analyzed empirically whether the model is generated in accordance with the theory or not.
4.1. Stationary Test
Models using time series data (time series) will cause problems if the data are not stationary. Why is it so important stationary in time series data? If the data is not stationary, then the behavior of economic variables only covered a specific time period. Each group of data represents only the observation period. As a consequence, it is not possible to generalize to other periods, so for the purpose of forecasting doubtful reliability. On the economic analysis, forecasting is an important part, especially for economic policy-making.
Economic variables in this study are a time series data that needs to be seen stationary or not. Tests on time series data necessary to examine the data are stationary or not. This is done to prevent the occurrence of spurious regression (spurious regression) in which the relationship between one variable with one or more other variables actually showed no association, but the indicators used statistical test as if there is a relationship (Gujarati, 2003: 792). One indication of spurious regression is that it contains a relatively high R2 and Durbin-Watson statistics are low showing symptoms of the strong autocorrelation. Granger and Newbold give simple instructions spurious regression by comparing the value of R2 and d-statistic. If the value of R2>d-statistic, we suspect occurrence of spurious regression.
1) Unit Roots Test
This test can be seen as a test of stationary, because in principle, examine it to see if certain coefficients of the model were estimated to have one or no value. So that the time series data must be differentiated several times in order to obtain stationary data. However, because the distribution of the standard model is not a standard statistical tests such as t test and F test was not quite proper to use the model to test the hypothesis in question; therefore, the model will use the test developed by Dickey and Fuller (Gujarati, 2010) with a model assessment autoregressive following:
Yt = Yt-1 + ut ut ~ (N, σ 2) (29)
where ut is a random variable with mean zero and constant variance. Hypothesis testing is to test whether the value of a1 = 1. If the value of = 1, then the value of the variance of a random Yt = t ut2.
By manipulating equation (21), then the equation is obtained:
Yt – Yt-1 = Yt-1 + Yt-1 + ut
where,
Yt: dependent variable X1t, X2t: independent variables et: stochastic variable
In this case it is considered that the Y, X1 and X2 have the same degree of integration, such as I (1).
Then the following regression estimated by OLS:
et^ = p
1et-1 + vt (36)
CRDW statistical value indicated by the value of DW statistic equation (35) and the DF and ADF statistics indicated by the value of the coefficient t et-1 in equation (36). The main objective is to test the integration test whether co-integration regression residuals stationary or not. Testing is especially important when a dynamic model is developed.
4) Co-integration Approach and Error Correction Model (ECM)
The purpose uses co-integration test is to assess whether the co-integration regression residuals stationary or not and to see the long-term equilibrium relationship among the variables were observed. Testing is very important if you want to develop a dynamic model, especially the model error correction or ECM, which includes the key variables related to the co-integration regression. Thus, it can be said that the error correction model is consistent with the concept known as co-integration or Granger Representation Theorem (Gujarati, 2010).
Granger Representation Theorem stressed that if two variables co integrated, the relationship between the two variables can be realized in the error correction model. As an illustration of the relationship between co-integration approach to error correction models, need to be scrutinized again the equation:
DYt = r0 + r1 DXt + r2 (X – Y)t-1 (37)
Following the theory developed by Engel and Granger (1987), when et-1 = I (0). Then et-1 can replace the variable Yt-1, X1t-1, and X2t-1 on the right-hand side of equation (37) to obtain the equation:
DYt = s0 + s1DXt + s2 et-1^ (38)
where:
Yt : dependent variable Xt : independent variable
et-1 ^ : estimated value of the residual co integration in previous period
From equation (38) can be seen that all the variables used in the model are stationary or I (0). This is known as the Engel-Granger ECM (Gujarati, 2010).
Having regard to the estimation ECM (3.29), it can be seen whether the value of the independent variable t significant, because the significance of this will be able to be used to describe the short-term direction. Please also note the significance of the coefficient of ECT. Significant t values will be able to be used to estimate the long-term.
4.2. Derivation ECM in Indonesia Sugar Industry
vary from one manufacturer to the other manufacturers. Similarly, in the analysis of consumer demand, consumer demand for a product is the aggregation of individual demand behavior.
Manufacturers are assumed to produce the goods and the prices of the inputs together to achieve the maximum profit (minimum cost) (Sugiyanto, 1992: 51). Consumers are also assumed to be aimed at obtainin