i
EXPERIMENTAL MODAL ANALYSIS ON FLEXIBLE PLATE STRUCTURE USING
FORCED VIBRATION METHOD
AHMAD SYAFIQ BIN BAHARIN
This Report Is Submitted In
Partial Fullfillment of Requirements For the
Barchelor Degree of Mechanical Engineering (Structural & Material)
Fakulti Kejuruteraan Mekanikal Universiti Teknikal Malaysia Melaka
ii
VERIFICATION
“I hereby declare that I have read this thesis and in my opinion this thesis is sufficient in terms of scope and quality for the award of degree of Bachelor
Mechanical Engineering (Structure & Material)”
Signature :………
Supervisor’s Name : Puan Rainah Ismail
iii
iv
DECLARATION
I hereby declare that this project report entitled
EXPERIMENTAL MODAL ANALYSIS ON FLEXIBLE PLATE STRUCTURE USING FORCED VIBRATION METHOD
is written by me and is my own effort except the ideas and summaries which I have clarified their sources.
Signature :………
Author : Ahmad Syafiq Baharin
v
ACKNOWLEGEMENT
Thanks to Allah, for giving me permission to complete this project. In here I would like to record my graceful thank to all the support, encouragement and inspirations that I have received during completing this project.
I also would like to express greatest thankfulness and appreciation to my supervising lecturer, Pn. Rainah Ismail of which we had a good working relationship, and who had offered me a wonderful help and encouragement. She also gives me full of support and advice.
vi
ABSTRACT
vii
ABSTRAK
viii
1.1 Research Background 1
1.2 Problem Statement 2
1.3 Objective 2
1.4 Research Scope 2
ix
CHAPTER 2 LITERATURE REVIEW
2.1 Introduction 4
2.3.1 Historical Background 13
Of Modal Analysis
2.3.2 Fundamental of Modal 15
Analysis
2.3.2.1 Modal Analysis Technique 17 2.3.2.2 Free and Forced Vibration 18 2.3.2.3 Frequency Response Function 19 2.3.3 Signal Processing for Modal Analysis 20
2.3.3.1 Fourier Analysis 20
2.3.3.2 Single Input Single Output 21 (SISO)
2.3.3.3 Multi Input Multi Output 22
(MIMO)
2.3.3.4 Curve Fitting 22
2.4 Forced and Ambient Method 23
2.5 Flexible Plate Structure 25
x
3.2 Experimental Modal Analysis 35
3.2.1 Material and Equipment 37
3.2.2 Experiment Setup 38
3.3 Initial Preparation 39
3.3.1 Setup Geometric Dimension 39
3.3.2 Software Setup 41
3.4 Experiment Procedure 45
CHAPTER 4 RESULT AND DISCUSSION
4.1 Introduction 47
4.2 Result 47
4.2.1 FFT Graph 48
4.3 Discussion 50
4.3.1 FFT Analyzer 50
4.3.2 Experimental Assumptions 51
4.3.3 Frequency Analysis 52
4.3.4 Analysis of Test Result 52
4.3.4.1 Comparison Data between 52 Experiment and True Value
xi
4.4 Experimental Error 66
CHAPTER 5 CONCLUSIONS AND RECOMMANDATIONS
5.1 Introduction 67
5.2 Conclusion 67
5.3 Recommendation for Further Study 68
REFERENCES 69
BIBLIOGRAPHY 74
APPENDICES
Appendix A 75
xii
LIST OF TABLES
TABLE NO TITLE PAGE
3.1 Aluminum Properties 39
3.2 Elements for each ratio 40
4.1 True and experimental data for each mode 53 4.2 Comparison of percentage error between true value
and experimental value
57
4.3 Simulation and experimental data for each mode 58 4.4 Comparison of percentage error between simulation
value and experimental value
xiii
LIST OF FIGURES
FIGURE NO TITLE PAGE
1.1 Methodology Flowchart 3
2.1 SDOF discrete parameter model 7
2.2 SDOF impulse response/ free decay 8
2.3 MDOF discrete parameter model 9
2.4 MDOF impulse response/ free decay 9
2.5 MDOF frequency response 10
2.6 SDOF modal contributions 10
2.7 Mode Shape 12
2.8 A System with single input and output 19
2.9 A rectangular plate with moments 28
2.10 A rectangular plate with shear forces 29
2.11 Clamped plate for a=b 33
3.5 The configuration of experimental modal analysis 38
xiv
FIGURE NO TITLE PAGE
3.13 Analyze data window 43
3.14 Control properties window 44
4.1 Graph FFT for ratio a/b 0.2 49
4.2 Graph FFT for ratio a/b 0.5 49
4.3 Graph FFT for ratio a/b 0.9 50
4.4 Histogram shows the different between true and experiment value for ratio a/b 0.2
53
4.5 Histogram shows the different between true and experiment value for ratio a/b 0.5
54
4.6 Histogram shows the different between true and experiment value for ratio a/b 0.9
55
4.7 Histogram shows the different between
experiment and simulation value for ratio a/b 0.2
59
4.8 Histogram shows the different between
experiment and simulation value for ratio a/b 0.5
60
4.9 Histogram shows the different between
experiment and simulation value for ratio a/b 0.9
61
4.10 Graph for frequency vs. mode for each ratio for experiment value
64
4.11 Graph for frequency vs. mode for each ratio for simulation value
64
4.12 Graph for frequency vs. mode for each ratio for true value
xv
xvi
E - modulus of elasticity - Poisson ratio
xvii
LIST OF APPENDIX
Appendix Title Page
1
CHAPTER 1
INTRODUCTION
1.1 Research Background
Modal analysis has become a major technology in the request for determining, improving and optimizing dynamic characteristics of engineering structure. Modal analysis has been used in mechanical and aeronautical engineering. Now days, modal analysis widely used in fundamental application for civil and building structure, biomechanical problems, space structure, acoustical instruments, transportation and nuclear plant. Contemporary design of complex mechanical, aeronautical or civil structure required them to become increasingly lighter, more flexible and strong. For example, the car manufactures have to achieve microscopic reductions of product body weight. Aerospace structure such as satellite antennas must have weight reduction of every possible gram to minimize their internal property during operation in space.
2 internal to the structure such as moving loads and engines. Heavy structure has small frequency than the lighter ones. The lightweight structure will produce higher frequency and this can lead to higher vibration. The higher vibration can cause crack, fatigue and failure of the structure. In this study, the frequency will be determine and analyzed.
1.3 Objective
The objectives of this study is to obtain frequency data for first three dominant modes by using forced vibration and to verify the results with the analytical finite element model that has been done by other researcher.
1.4 Research Scope
The scope of this study is:
1) To determine the frequency by using experimental modal analysis. The frequency is obtained from the Fast Fourier Transform (FFT) that will be computed by Dewesoft software used in this experiment. The flexible structure used in this study is Al-7001 that widely used in aircraft manufacturing.
3
1.5 Research Methodology
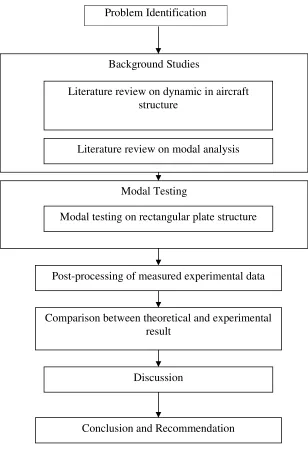
Methodology of this study is summarized in the Figure 1.1 below
Problem Identification
Figure 1.1: Methodology Flowchart Background Studies
Literature review on dynamic in aircraft structure
Literature review on modal analysis
Modal Testing
Modal testing on rectangular plate structure
Post-processing of measured experimental data
Comparison between theoretical and experimental result
Discussion
4
CHAPTER 2
LITERATURE REVIEW
2.1 Introduction
The term vibration describes repetitive motion that can be measured and observed in a structure. Unwanted vibration can cause fatigue or degrade the performance of the structure. Therefore it is desirable to eliminate or reduce the effects of vibration. In other cases, vibration is unavoidable or even desirable. In this case, the goal may be to understand the effect on the structure, or to control or modify the vibration, or to isolate it from the structure and minimize structural response.
5
2.2 Basic Vibration Theory
Vibration is the motion that repeats itself. The theory of vibration deals with the study of oscillatory motion of bodies and associated force. The phenomenon of vibrating involves an alternating interchange of potential energy to kinetic energy and vice-versa. Therefore any vibrating system must have a component that stores potential energy and a component that store kinetic energy. The components storing potential and kinetic energy are called a spring or elastic element and a mass or inertia element. In each cycle of motion the elastic element store potential energy and gives it up to the inertia element as kinetic energy and vice-versa.
6
2.2.1 Vibration Types
Vibrations can be classified into following type (Rao, 2004). 1. Undamped and Damped vibration
If there is no less or dissipation of energy due to friction or other resistance during vibration of a system, the system said to be undamped. If there is a energy loss to the presence of damping, the system is called damped. Although system analysis is simpler when neglect damping, a consideration of damping become extremely important if a system operates near resonans.
2. Free and Forced vibrations
If a system vibrations due to an initial disturbance (with no external force applied after time zero), the system said to undergo free vibrations. On other hand if the system vibrates due to the applications of external force, the system said to be under forced vibrations.
3. Linear and nonlinear vibrations
If all the basic components of a vibrating system (i.e. the mass, the spring and the damper) behave linearly, the resulting vibrating is called linear vibration. However, if any of the basic components at a vibrating system behave nonlinearly, the resulting vibration is called nonlinear vibration.
2.2.2 Equation of Motion
7
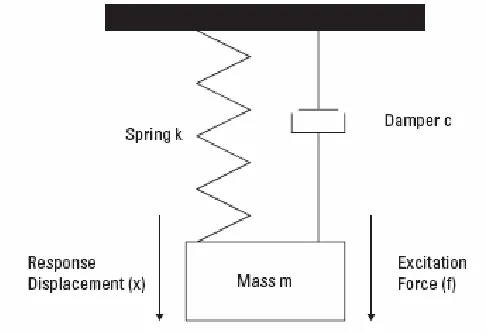
2.2.2.1Single Degree of Freedom (SDOF)
Figure 2.1: SDOF discrete parameter model
Although most physical structure is continuous, their behavior can usually represent by a discrete parameter model as illustrated in Figure 2.1. The idealization elements are called mass, spring, damper and excitation. The first three elements are described the physical system. Energy is stored by the system in the mass and the spring in the form of kinetic and potential energy. Energy enters the system through excitation and dissipated through damping.