Jurnal Natural
ANALYSIS OF SHALLOW SUBSURFACE STRUCTURE
AT GEOTHERMAL AREA OF IE JUE USING
RESISTIVITY METHOD
Syafrizal Idris
1,2, Muhammad Syukri
3, Muhammad Syukri Surbakti
3, Marwan
3,
Muchlis
4, Ibnu Rusydy
5and Nurul Aflah
41
Master Program of Physics, Faculty of Sciences, Syiah Kuala University, Banda Aceh,
Indonesia
2
Geophysics Engineering, Faculty of Engineering, Syiah Kuala University, Banda Aceh,
Indonesia
3
Department of Physics, Faculty of Sciences, Syiah Kuala University, Banda Aceh,
Indonesia
4
Department of Mining Faculty of Engineering, Syiah Kuala University, Banda Aceh,
Indonesia
5
Geological Engineering, Faculty of Engineering, Syiah Kuala University, Banda Aceh,
Indonesia
E-mail: [email protected]
Abstract. It has been conducted a geo-electrical resistivity survey at geothermal area of Ie Jue, Aceh Besar.
The survey aims to measure resistivity value in the area. It is expected that the values of resistivity will image the subsurface structure in the area. In addition geological features in the area are shown after we process it. The data acquisition in this study was acquired using a SuperSting R8/IP resistivitymeter and its data processing using EarthImager 2D software to get the image of resistivity pseudosection. The two lines of measurement crossed the surface geothermal manifestation. Each line has 330 m in length, and 56 electrodes with electrode space of 6 m. The result of resistivity pseudosection model interpreted based on geological condition and observation in the area. Resistivity pseudosection model shows the study is water-saturated (<64.0 Ω m) to a depth of ±65 m and a highly conductive zone (0.6-3.5 Ω m) with a thickness of 30-50 m. This conductive layers below the embodied surface at a distance of 158-160 m on the IJ-Y1 line and at a range of 130-185 m on the IJ-Y2 line. This conductive zone is indicated as a weak zone where geothermal fluids are transported to the surface.
Keywords: Geothermal, Ie Jue, geo-electrical resistivity survey, resistivity
I INTRODUCTION
Around Seulawah Agam volcano, the existence of geothermal manifestations appears at several locations; Heutz Crater, Cempaka Crater, Ie Jue, Ie Broek, and Ie Seu'um. One of them, Ie Jue is a geothermal area traversed by the fault and consists of volcanic rock formations of Lam Teuba in the form of andesitic to dacitic volcanic, pumiceous breccias, tuffs, agglomerates, ash-flows and lahars/mudflows contained in the rock formations [1]. Manifestations in the geothermal area of Ie Jue are directly observed in the form of fumaroles, steaming ground and mud pool. Unlike the others geothermal manifestations, the manifestation is in the form of hot springs [2]. We then conducted the geo-electrical resistivity
Analysis of shallow subsurface structure at geothermal area of Ie Jue using resistivity method (Syafrizal, M. Syukri, M. Syukri Surbakti, Marwan, Muchlis, Ibnu Rusydy, Nurul Aflah)
__________________________________________________________________________________________________
19 Figure 1 Geological map of the research area modified from the geological map of Banda Aceh [1]. The map shows the surface lithology distribution along the research area. The lithology mainly consists of volcanic rocks
Figure 2 The location of which the geoelectrical cables lay. The first line is IJ-YI and second is IJ-Y2. The lines across the geothermal prospect
of Seulawah volcano and Ie Jue [5,6]. They conclude the possibility of local fault which associates with geothermal manifestation. Measurements using resistivity methods have been common in the geothermal area to determine more detail shallow subsurface structure. For example, in the geothermal field Ie Seu'um explains that the possibility of hot spring flows (<5 Ω m) in Ie Seu'um is controlled by fault (Seulimum segment) [2]. As for the Ie Jue area, resistivity measurements have been performed using the Very Low Frequency (VLF) method, where the resistivity model obtained is a more resistive layer covered by a conductive layer near the surface (10- 60 Ω m) [7].
II METHODOLOGY
The research was conducted on Ie Jue geothermal manifestation area and administratively located in Meurah Village, Seulimum Subdistrict, Aceh Besar District Aceh Province (Figure 1).The data acquisition process at that location uses the resistivity method of the Wenner-Schlumberger array. The two lines of measurement crossed the surface geothermal manifestation. The spacing between line is 100 m and 56 electrodes with electrode space of 6 m. These two lines oriented from the Southwest-Northeast with the coordinates of the initial and final positions of IJ-Y1 (791114.95E 609192.77 N and 791300 E 609464 N) and the starting and ending
Analysis of shallow subsurface structure at geothermal area of Ie Jue using resistivity method (Syafrizal, M. Syukri, M. Syukri Surbakti, Marwan, Muchlis, Ibnu Rusydy, Nurul Aflah)
__________________________________________________________________________________________________
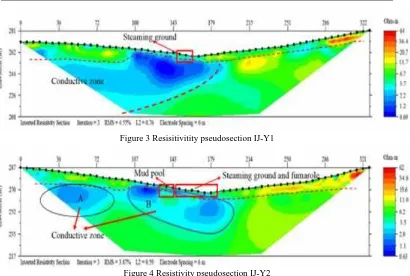
20 Figure 3 Resisitivitity pseudosection IJ-Y1
Figure 4 Resistivity pseudosection IJ-Y2
positions of IJ-Y2 (791213.91 E 609189.24 N and 791402.74 E 609460.65 N) 46 N zone in UTM system. The data acquisition process on both lines is done using Resistivity meter SuperSting R8/IP, while data processing is done using EarthImager 2D software to obtain the resistivity pseudosection.
III RESULT AND DISCUSSION
The resistivity pseudosection model was interpreted based on the resistivity value of the geology area [2] and cover field observations. The observation in the field shows that in the location of Ie Jue there are geothermal manifestations that appear are steaming ground (A), steaming ground in the west and fumaroles on the eastern (B), mud pool (C) and mud pool heat accompanied by gas bubbles (D). The resistivity pseudosection model obtained the subsurface layer of the geothermal area of Jue and a water-saturated layer up to a depth of ±65 m. The resistivity value obtained is <64 Ω m, but is typically in the range of 6 Ω m. A more resistive layer (6-64 Ω m) is seen in the uppermost layer with a thickness of ±10 m. This layer is a non-dense surface layer composed of clays mixed with andesite and volcanic breccia. While the value of resistivity is low (conductive), that is with the resistivity value of 0.6-3.5 Ω m which is imaged by blue (conductive zone). This layer is below the surface of the appearance of the manifestation (158-160 m distance on IJ-Y1 line and at a distance of 130-185 m on IJ-Y2 line) with variations in depth from ±2 downwards (thickness 30-50 m). It indicates that this layer
is a weak zone consisting of weathered rock so that the geothermal fluids leakage to surface. In both pseudosections (Figure 3 and 4) can be seen that the manifestation appears to be on a low topography. They show areas of contrast resistivity values are almost thinner. In addition, field mapping indicates the possibility position of the hot thermal. This becomes the initial indicator of faults appearance. However, this needs geophysical methods to prove the appearance. On the other hand, based on the low resistivity of subsurface rocks, the subsurface layer of the geothermal area of Ie Jue indicates very good aquifer spot.
CONCLUSION
The resistivity pseudosection image provides information that the subsurface layer of Ie Jue is generally a water-saturated layer (<64 Ω m) to a depth of ±65 m. Manifestation arises from the presence of a weak zone layer below the surface which is indicated by a very low resistivity value (0.6-3.5 Ω m).
ACKNOWLEDGEMENTS
Analysis of shallow subsurface structure at geothermal area of Ie Jue using resistivity method (Syafrizal, M. Syukri, M. Syukri Surbakti, Marwan, Muchlis, Ibnu Rusydy, Nurul Aflah)
__________________________________________________________________________________________________
21
REFERENCES
1. Bennet, J.D., Bridge, D.McC., Cameron, N., Djunuddin, A., Ghazali, S.A., Jeffrey, D.H., Kartawa, W., Rock, M.N.S., Thomson, S.J., Whandoyo, R., 1981. Peta Geologi Lembar Banda Aceh, Sumatera,
Puslitbang Geologi. Bandung.
2. Syukri, M., Saad, R., Nordiana, M., & Azwin, I. 2014. Preliminary Study of Sumatera Fault Using 2-D Resistivity Imaging Method. Electronic Journal of
Geotechnical Engineering, 19.
3. Knödel, K., Lange, G., & Voigt, H.J., 2007.
Environmental geology: Handbook of field methods and case studies: Springer Science
& Business Media.
4. Telford, W. M., Geldart, L. P., Sheriff, R. E. 1990. Applied Geophysics Second Edition, Cambridge University Press, USA
5. Marwan, M., Rusydy, I., Nugraha, G.S. and Asrillah, A., 2014. Study of Seulawah Agam’ s Geothermal Source Using Gravity Method. Jurnal Natural, 14(2).
6. Asrillah, A., Marwan, M., Rusydy, I. and Nugraha, G.S., 2014. Application of Magnetics Method to Mapping the Geothermal Source at Seulawah Agam Area. Jurnal Natural, 14(2).
7. Ismail, N.,Ramadhan, S., 2013. Karakterisasi Struktur Dangkal pada Lapangan Panas Bumi Seulawah Agam
Menggunakan Metode Very Low
Frequency (VLF). Prosiding Semirata FMIPA Universitas Lampung. Lampung,
![Figure 1 Geological map of the research area modified from the geological map of Banda Aceh [1]](https://thumb-ap.123doks.com/thumbv2/123dok/3582114.1451601/2.595.108.487.321.547/figure-geological-research-area-modified-geological-banda-aceh.webp)