Design and Simulation on Compressor Metal Matrix Composite
By Investment Casting
Taufik
1,a, S.Sulaiman
2,b, T.A.Abdullah
1and Sivarao
11
Faculty of Manufacturing Engineering, Universiti Teknikal Malaysia Melaka, Hang Tuah Jaya, 76100 Durian Tunggal, Melaka, Malaysia
2
Department of Mechanical and Manufacturing, Faculty of Engineering, Universiti of Putra Malaysia, 43400 UPM Serdang, Selangor, Malaysia.
a
[email protected], [email protected]
Key words: Design, simulation, compressor, metal matrix composite, investment casting.
Abstract. Compressor is a part of turbocharger approaches that utilize the exhaust gas of an automobile to drive the compression device. The purpose of turbocharging is to increase the intake pressure and the amount of air into the combustion chamber to improve the efficiency of the engine. Compressor impeller determines the service life of the turbocharger. This paper proposes the new methodology of producing the compressor impeller using Metal Matrix Composite (MMC) material by investment casting. In general, this study presents the tasks pertaining to metal matrix composites and their interactions in designing of compressor impeller. This study presents the use of genetic algorithm (GA) and computer programs for designing a new compressor and determined the wax pattern dimensions based on three-dimensional finite-element simulations as a preliminary study by using investment casting method. The model of thermal and mechanical analysis was developed by ANSYS. As the results, the simulation model was generated and it could be used for improving the design of turbine-compressor assembly through the bottom geometry changes of the compressor.
Introduction
The design of mechanical elements is considerably more difficult than the problem of mechanical analysis because generally, for the latter, both geometry and material assumed to be constants and limitations such as space restrictions are not significant. The design of mechanical elements is always based on the satisfaction of mathematical equations, graphical information and tabulated data. The graphical information and tabulated data can be conveniently expressed as design equations.
Engine is sometimes described as the heart of an automobile [2]. Engine is where the burning of a mixture of fuel and air takes place and it produces mechanical energy to drive the automobile. However, engine cannot work by itself; it has to work together with other automotive parts, for instant, the manifold system [8]. While new engines are not redesigned very frequent, it has the necessity to undertake major redesign of the manifold systems on a more regular basis [11].
The intake and exhaust manifolds affect engine performance, as well as emissions of noise and pollutants [11]. The potential for energy release in the combustion process, which is manifested as the indicated mean effective pressure or the torque generated, is related to the amount of air entering the cylinders. The majority of engines used in automobile applications is naturally aspirated and operate on the four-stroke cycle, in which distinct strokes of the piston are used to induce the air and exhaust it [1]-[3]. There are also other means to introduce the air into the cylinders. The most common methods are supercharging, which uses a prime mover to drive the compression device; and turbocharging, a method that utilize the exhaust gas to drive the compression device [5]. These methods are having the same objective that is to increase the intake pressure and the amount of air into the combustion chamber; thus improving the efficiency of the engine. Generally speaking, a turbocharger is more efficient than a centrifugal supercharger. The scope of this study will be limited on the turbocharging method only.
One of the main problems with turbochargers is that they do not provide an immediate power boost when the accelerator pad is pressed, and the car accelerate forward suddenly when the turbo gets moving. Usually a delay is produced between pressing on the accelerator pedal and the boost. This is due to the loss of energy to overcome the rotational inertia of the turbine rotor. This problem is usually described as turbo-lag [7].
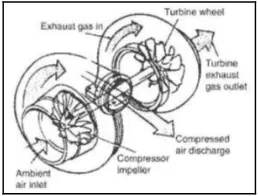
Turbochargers are a type of forced induction system that compresses the air flowing into the engine [8]. Compressing the air introduces more air into the engine, and more air means that more fuel can be added. Thus, more power can be provided by the combustion process and in other word, the efficiency or power-to-weight ratio for the engine is improved [3]. The flow of gas through a turbocharger is shown in figure 1:
Fig. 1 Inlet and Exhaust Gas Flow through a Turbocharger (Source: Nunney, 2006)
The turbocharger itself is rather a simple device; the typical turbocharger consisting a single turbine attached by a shaft to a single compressor [3]. The exhaust gas at high temperature and pressure drives the turbine from the exhaust manifold. The work of the turbine drives the compressor, and the air entering the intake manifold is compressed [4]. Although this arrangement seems simple, due to its inherently unsteady operating environment, turbocharger design process is still quite complex. Despite the complications of transient operation of an engine, the advantages associated with the implementation of a turbocharger are universally accepted when applied to high efficiency diesel engines [5]. Significant effort has been aimed at improving the efficiency and power to weight advantages of turbocharged engines.
The author concludes that by reducing turbocharger inertia the operating speed are increased; and that the optimum dimensions of the turbocharger wheels have to be obtained to match a specific application, however, it should be noticed that the wheels dimensions are established as a non-linear and will cause complex trade off between efficiency, overall size and response.
The main method of this research is to reduce the turbo-lag time of a turbocharger. And one simplest way to achieve that is by reducing the mass of the turbine-compressor assembly. Design Improvement of the compressor has been developed as shown in figure 2. The turbine and compressor blades are nothing much different with the original design. The major difference between the new design and the existing ones is at the bottom of the compressor [10].
Fig. 2 The proposed compressor
Material and Method
Aluminium Silicon Carbide was used in this study. Aluminium alloy as a matrix material and SiO2- quartz as a particulate reinforce added in different percentage [12-13].The main composition of Aluminium is about 85.95% , 11% to 13% of silicon.
Based on the turbocharger’s design evolution described in the introduction, a such geometry as illustrated in Figure 2, was adopted in this work. Due to the asymmetry introduced by the depth of surface, the first two modes of this structure are hybrid [6]; however, the maxima amplitude of each component practically coincides at the same position. The normalized maxima of these two modes:
y x h
H0 = 0 + andH1=−x+h1y, with propagation constant β0 andβ1, respectively, β0>β1, where0≤h0,h1≤1. In order to achieve the unity of the components h0andh1, the more hybrid the modest means the nearer to unity the components.
By considering the total magnetic field Has a linear combination of these two modes, its maximum amplitude writes as follow:
H=Hxx+Hyy (1)
Where, ∆β =β0−β1. This situation defines the diameter of shaft dimension to the turbocharger, Ls
given by:
It is understandable that more hybrid the transient response of turbo-lag get closer to the ideal situation, i.e., Max Hx =1 and Min Hy =0. The normalized power Pc transient response is given by
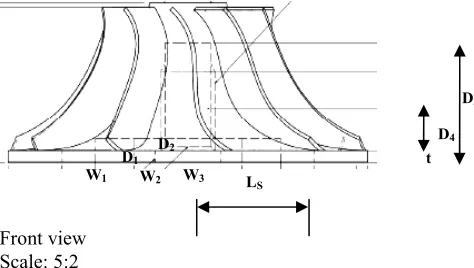
Figure 3 shows the new geometrical design parameters of compressor in turbocharging system.
Front view Scale: 5:2
Fig. 3 New geometrical design parameters of compressor
The parameters t = 6 mm and D4 = 10.73 mm of the adopted profile (figure 3), were kept fixed,
while the other six parameters were allowed to vary in the interval as shown in Table 1.
Table 1 Interval limit for variable parameters
W1 (mm) W2 (mm) W3 (mm) D1 (mm) D2 (mm) D3 (mm)
Max. Value 14.0 8.5 10.0 4.0 3.2 30.0
Min. Value 12.0 7.2 9.0 3.8 1.9 27.5
Where vmin and vmax are the minimum and maximum value of the variable parameter v,
respectively, and bj, j=0,1,2… N-1 are the N bits describing v. Total of four bits to each variable
parameter is used what resulted in a total of 24 bits to each possible solution.
The second step is to choose fitness or cost function to compare the searched profiles. This is one of the most important criteria of a GA-based algorithm. In this work, two different, and usually conflicting, goals have to be satisfied. First, a profile that has high hybrid nature, which means to make Pc, given in (3), as close to 1 as possible. Second, the desired turbocharger has to be as short
as possible, to integrate the component easily. The value of∆β is increased in order to reduce the length. With these two goals, the following fitness functions:
)
Here, ξ is a sensitivity parameter to be adjusted. The first attempt ξ = 1000 is applied. During the GA process, particular care must be taken when the first two modes of the trial profiles are nearly cut off. These situations were handled allocating very low values to the fitness function and replacing the population exactly over those structures, for the first ten generations. The next ten generations had a random replacement of 30%.
The first result were defined that W1 = 13.0 mm, W2 = 8.0 mm, W3 = 9.2 mm, D1 = 3.85 mm,
D2 = 3.2 mm, and D3 = 28.6 mm. For this profile, the transient response achieved of 96% for a
conversion length of 93 mm. Due to the short length of this devise, material loss can be neglected, and therefore, only insertion loss is important. Comparing these values with the allowed values from table 1, the only variable that is not at one extreme of its interval is D2. This strongly suggested that
these intervals do not cover the optimum region of this problem.
Table 2 New interval limit for variable parameters
W1 (mm) W2 (mm) W3 (mm) D1 (mm) D2 (mm) D3 (mm)
Max. Value 13.50 8.30 9.80 3.95 3.20 30.0
Min. Value 11.60 7.50 9.30 3.85 1.90 28.0
Results and Discussion
It would hardly be possible without an optimization technique if the fisrt result considered as the optimum result. By considered to vary one variable, these result will be restricted to local maxima. Since an approach would only work in linear problems, and it is clear that this problem could not use linear function. The next step was to shift the intervals extremes to more appropriate values, for such variables whose computed values were at one extreme of its corresponding intervals. The intervals shown in Table 1 were then replaced by the new intervals limit given in Table 2.
With these new intervals, the solutions became poor because of the high value of ∆β reached right from the beginning, as a consequence, the best results achieved very high ∆β but low transient normalized power Pc. The reason was that the fitness function defined in (5) with ξ =1000, became
unsuitable. Hence, for these case a new sensitive parameterξ=250 is applied in order to reduce the influence of∆β . With the new intervals and the new fitness function, the new results adjustment was determined. The new results were W1 = 13.35 mm, W2 = 7.65 mm, W3 = 9.64 mm, D1 = 3.91
m, D2 = 2.07 mm, and D3 = 29.15 mm. The performance of this geometry was then confirmed using
the computational fluid dynamics simulation.
In addition, the pressure at the compressor outlet is calculated to be 128,313 Pa. The pressure boost provided by the turbocharger is 27,013 Pa. It is obvious that the turbocharger introduces 26.7% more air into the engine intake. Thus, a 26.7% of improvement is expected on the engine performance.
Fig. 4 Temperature change at the compressor side. (A) Top view; (B) 3D view; (C) Back view; and (D) Front view.
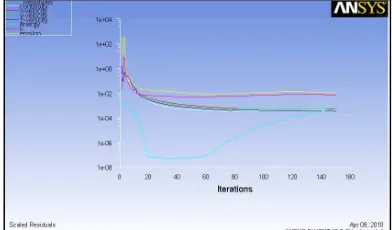
The design simulation begun with varies of temperature inlet from 300 K to 400 K. As a result, at temperature 400 K in fluid flow process, the air and heat flow in the turbocharger is become more even and stable. Figure 5 shows the beginning flow rate in turbocharger at temeprature 400 K, air flow is evenly distributed in each direction and the representative flow variables and energy shows that the residuals have starting at the highest but become decrease from the 15 iteration and changed from starting and slightly constant on range 20 to 65, and for the further iteration the energy increased. It is observed that the metal matrix composite material selected might have the relation with this air flow rate.
Fig. 5 Beginning Air Flow Rate in the Turbocharger at temperature 400 K
Conclusion
The use of genetic algorithm for compressor impeller could participate efficiently in the industrial design process in order to reduce the development time and cost of new product improvement as well as elevate the final product to high-tech equipment with optimum performance and efficiency. The simulation has been generated by using ANSYS CFX software. The compressor impeller was simulated by using casting software in order to determine the wax pattern of the compressor impeller.
The design parameters of compressor by investment casting process were determined in this study. The main material was used in this project is Aluminium Silicon Carbide. Aluminium alloy as a matrix material and SiO2- quartz as a particulate reinforce added in different percentage. The
Design improvements of the turbine compressor assembly have been achieved both in the turbo-lag and the transient response in the design. Through the utilization of simulation, genetic algorithm, and computational fluid dynamic analysis offers the ability to examine design parameters, which play a key role at design stage.
Acknowledgements
The authors would like to express their thanks to the Center for Research & Innovation Management (CRIM) and Faculty of Manufacturing Engineering, Universiti Teknikal Malaysia Melaka (UTeM).
References
[1] Ceausu, R. V. “Improving Turbocharged Diesel Engine Transient Response.” Michigan: Wayne State University. PhD Thesis. (2006)
[2] Heisler, H. “Vehicle and Engine Technology.” 2nd Edition, Warrendale: SAE International. (1999)
[3] Heywood, J. B. “Internal Combustion Engine Fundamentals.” New Zealand: McGraw Hill. (1988).
[4] King, A. J. “A Turbocharger Unsteady Performance Model for the GT-Power Internal Combustion Engine Simulation.” Indiana: Purdue University. PhD thesis. (2002)
[5] Kolmanovsky, I. and Stefanopoulou, A. G.“Evaluation of Turbocharger Power Assist System Using Optimal Control Techniques.” SAE Paper 2000-01-0519. (2000)
[6] Jefffrey A. Joines, Michael G, Kay, “Utilizing Hybrid Genetic Algorithms.” Evolutionary Optimization. Kluwer Academic Publsher. Pp. 199-225. (2002)
[7] Nice, K. (n.d.). “How Turbochargers Work: Design Consideration.” [Online]. Available: http://auto.howstuffworks.com/turbo2.htm [2007, August 2].
[8] Nunney, M. J. “Light and Heavy Vehicle Technology.” 4th Ed. London: Elsevier. pp. 224-227. (2006)
[9] Saravanan R. 2006. “Manufacturing Optimization through Intelligent Techniques.” Taylor & Francis Group. pp. 17-31. (2006)
[10] Taufik, C.T. Kuah, A. Tajul Ariffin. “Design Improvement of Turbocharger Using CFD.” Proceedings of National Conference on Design and Concurrent Engineering 2008. pp. 153-156. (2008)
[11] Winterbone, D. E. and Pearson, R.J. “Theory of Engine Manifolds Design – Wave Action Methods for IC Engines” UK: SAE International. pp. 125-134. (1999)
[12] S. Sulaiman, M Sayuti, R. Samin, “Mechanical properties of the as-cast quartz particulate reinforced LM6 alloy matrix composite,” Journal of Materials Processing Technology, vol. 201, pp. 731-73. (2008)
Design and Simulation on Compressor Metal Matrix Composite by Investment Casting