OBSERVATIONS OF THE INSTANTANEOUS NEARBED
STREAMWISE FLOW VELOCITIES
IN CONSTANT FLOWRATES
Yusron Saadi
Department of Civil Engineering, University of Mataram, NTB
E-mail : [email protected]
ABSTRACT
Seven series of laboratory experiments were carried out in a re-circulating glass sided tilting flume to investigate the instantaneous nearbed streamwise flow velocities in different duration of constant flowrates. Each series were observed at different time elapsed to represent the flow condition at different time of bed exposures. The instantaneous nearbed streamwise flow velocities were recorded using an Acoustic Doppler Velocimeter (ADV), which was positioned in such a way the probe could easily traverse the grid points to collect measurements. The experiments suggest that the instantaneous nearbed streamwise flow velocities within the grid varied throughout the constant flowrates with lower range of variations occurred in the shorter tests and wider variations in the longer tests.This means the constant flowrates produced different level of turbulences in a relatively small area even at adjacent points. With a relatively stable standard deviations regardless of the time elapsed of measurement it was also found that the average values of instantaneous nearbed streamwise flow velocities are slightly lower particularly for the shorter time interval between measurements and generally decreased towards the end of each test. This indicates that there was always a spatial variation in the average instantaneous nearbed streamwise velocities throughout the test.
Keywords: instantaneous – nearbed – streamwise – flow - velocity
INTRODUCTION
An understanding of the turbulence characteristics of open channel flow is needed to explain the natural phenomenon of sediment erosion and transport processes. Field studies show that during the passage of a flood, the bed load movement and the suspended load distribution as well as the river processes are different from those in steady flow. Turbulent flows are characterised by the interactions between flow structures of
turbulent boundary layer. However, when examining velocity time series obtained from a single instrument, the detection of these flow structures rest on the pairing of velocity fluctuations around the mean in the streamwise and vertical direction (Roy et al, 1999). A major problem has been the non-availability of velocity measurements collected simultaneously over a 3-D space to identify the flow structures (Saadi, 2000). Generally only time series of flow velocity measurements made at a single position in space are available. The observation of flow patterns have been hindered by interpretation difficulties encountered when trying to relate single point measurement to spatial flow patterns. In this experiment, a measurement technique was developed in which the measurement of simultaneous flow velocity over a period of time at many points could be obtained.
LITERATURE REVIEW
Turbulent flow is the key role to the entrainment process that determines the variation of bed configuration. Previous studies in this area included detailed measurement of turbulent velocity fluctuation characteristics close to rigid boundaries of varying roughness in two dimensional water channel flows. Grass (1971) and Kim et al. (1971) investigated the production of turbulence near a smooth wall in turbulent boundary layers. Other studies of the structure of turbulent flow, mainly over fixed rough boundaries, have been conducted by Nowell and Church (1979), Nezu and Nakagawa (1993), and Nikora and Goring (1999), who studied the characteristic of turbulence structure in quasi 2-D flows with static and weakly mobile bed in an irrigation canal. An important point indicated by these studies
is that the vertical distribution of turbulence characteristics is split into three main layers in the flow depth: a near water surface region, an intermediate flow region and a near bed layer.
friction or shear velocity. In the third region (sometimes called the roughness sub layer), turbulent intensity was a maximum near y/D = 0.25 and then decreased toward the bed. This agrees with Song and Graf (1996) who found that turbulent intensity decreases with an increase of y and the maximum value is just above the bed. The work of Nowell and Church (1979) also clearly demonstrated that the value of turbulence intensity scaled with shear velocity varied depending on the roughness density within the roughness sublayer. The largest values were seen when the roughness density was equal to 0.125. For values below or above this, the levels of turbulence reduce. This clearly showed that the bed surface arrangement could influence the near bed turbulence.
METHODOLOGY
The aim of this experiment was to study the consistency of the instantaneous streamwise near-bed flow velocities during the constant flowrates. Therefore the instantaneous streamwise nearbed flow velocity measurements were carried out to investigate the pattern of near-bed flow so that changes in the fluid force distribution could be estimated. All instantaneous streamwise nearbed flow velocity measurements were taken using an Acoustic Doppler Velocimeter (ADV) over a selected grid. The ADV probe seen in Figure 1 was located 9 m from the flume inlet and positioned in such a way that the distance from the sensor head to the sampling volume was approximately 50 mm. Seven series of measurements were conducted with each series had 9 observation points within the grid during
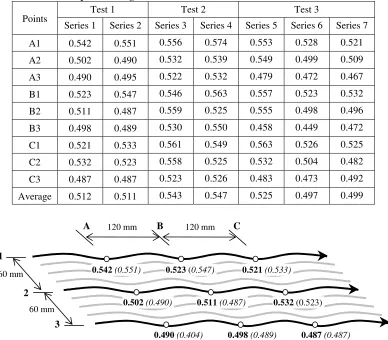
the course of 6, 9 and 12 hours of constant flowrates. Each series of measurement started at different time elapsed in each test but the measurement of the grid points were carried out with the same order. The gap between series of measurement was intended to allow the bed to stabilise and also to obtain the instantaneous streamwise nearbed flow velocities from both the early and the later stages of constant flowrates at different points within the selected area. All measurements were made at the centreline of the flume (row 2) and another two adjacent rows (row 1 and row 3). Row 1 and row 3 were relatively close to the centre line to minimise side-wall effects. The ADV probe was positioned at 10 mm above the average bed surface and moved in a grid pattern of three streamwise rows 60 mm apart (row 1, row 2 and row 3 respectively). Each row had three measurements position 120 mm apart (lines A, B and C). Measurement at each point provided 5000 time series of velocity data being available for analysis. Details of order and the number of measurements made at selected points are presented in Table 1.
Figure 1. A 3-D down looking Acoustic Doppler Velocimeter (ADV)
Table 1. Experimental arrangement and the number of instantaneous nearbed streamwise flow velocities data carried out in each series of measurements
3 + ; 4 ' 0 + "
5 # 7 =
0 # 7
5 1 $# =
5 $ 7 =
0 1
5 8 =
5 71 =
5 7 $ 8 =
0 $ #1
5 6 76 =
0 " , . 7$
RESULTS AND DISCUSSION
Different time intervals between measurements of the instantaneous nearbed streamwise flow velocity within the grid were applied in an attempt to represent different time length of bed exposure by the constant flowrates as it was suspected that the bed surface structures may constantly changes during the course of each test. It can be seen in Table 2 that the average instantaneous nearbed streamwise flow velocities measured at different time elapsed were sensibly varied throughout each series. In Test 1 the variations of changes between Series 1 and Series 2 are ranging from 4.7 % decreased to 4.6 % increased. The average instantaneous streamwise nearbed flow velocities at points A1, B1 and C1 were increased as the test progressed to the end. This is interesting, as these points were located in the same line in the streamwise direction (Figure 2). The opposite pattern found in line 2 with decreasing values at points A2, B2 and C2 in the second measurement, whilst line 3 had no systematic pattern. The upstream point A3 experienced a decreased in the average instantaneous nearbed streamwise velocities as well as
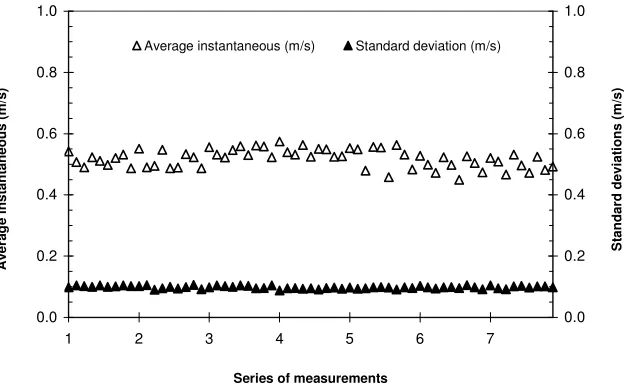
the next point B3. The furthest downstream point C3 has a constant average value. These patterns indicate that variations in the instantaneous nearbed streamwise flow velocities occurred over a relatively small area. As flow discharge was kept constant, it is suspected that variations in the instantaneous nearbed streamwise flow velocities were due to the changes in the bed surface structure caused by constant exposed by the flow. The disturbances were unlikely exist during experiment as the standard deviation of the instantaneous nearbed streamwise flow velocities were stable throughout the measurement of each grid point (see Figure 3). The integrated effects of the pattern of instantaneous fluid velocities over and around grains may destabilise the bed materials and produced movement to form different bed surface as the time progressed.
an increased in the average values. It can be seen in Table 2 that the average instantaneous nearbed streamwise flow
velocity with longer interval between measurements (Series 3 to Series 4) were
Table 2. Grid point averaged of instantaneous nearbed streamwise flow velocities
Test 1 Test 2 Test 3
Points
Series 1 Series 2 Series 3 Series 4 Series 5 Series 6 Series 7
A1 0.542 0.551 0.556 0.574 0.553 0.528 0.521
A2 0.502 0.490 0.532 0.539 0.549 0.499 0.509
A3 0.490 0.495 0.522 0.532 0.479 0.472 0.467
B1 0.523 0.547 0.546 0.563 0.557 0.523 0.532
B2 0.511 0.487 0.559 0.525 0.555 0.498 0.496
B3 0.498 0.489 0.530 0.550 0.458 0.449 0.472
C1 0.521 0.533 0.561 0.549 0.563 0.526 0.525
C2 0.532 0.523 0.558 0.525 0.532 0.504 0.482
C3 0.487 0.487 0.523 0.526 0.483 0.473 0.492
Average 0.512 0.511 0.543 0.547 0.525 0.497 0.499
Figure 2. Distribution of average instantaneous nearbed streamwise flow velocities (m/s) in Test 1 (values of Series 1 in bolds and Series 2 in brackets)
more fluctuated than that found in Test 1. The changes in the time-averaged values of instantaneous nearbed streamwise velocity were wider with the range of variations from 6.1 % decreased to 3.8 % increased. Although the difference in standard deviation between two series presented in Figure 3 were relatively constant, it shows that during the period of measurement in
Series 3 the instantaneous nearbed streamwise flow velocities were more widely dispersed. This suggests that there were other factors that contributed to the fluctuation of instantaneous nearbed streamwise velocities. These factors were likely caused by rigorous disruption of the bed at initial stage of Test 2. The level of disruption decreased during the
0.542(0.551)
0.502 (0.490)
0.490 (0.404)
0.523 (0.547)
0.511 (0.487)
0.498 (0.489)
0.521 (0.533)
0.532 (0.523)
0.487 (0.487)
1
2
3
60 mm
60 mm
120 mm 120 mm
0.0
Average instantaneous (m/s) Standard deviation (m/s) measurement in Series 3 taken 420 minutes
after this series started.
As experienced in the shorter steady constant flowrates (Test 1 and Test 2), variations of the average instantaneous
nearbed streamwise velocities were also found in Test 3 (see Table 2 and Figure 3). The longer duration of Test 3 made possible to carry three series of ADV
Figure 3. Variations of average instantaneous nearbed streamwise flow velocities and the standard deviation
measurements within the measurement grid. This allows comparison of the changes in the instantaneous nearbed streamwise flow velocities between a short and a longer time intervals in one experiment. Table 2 shows that the average values of instantaneous nearbed streamwise flow velocities of all points were decreased after almost 6 hours of the constant flowrates. All points in Series 5 have experienced a decrease in the average instantaneous nearbed streamwise velocities as indicated by the measurement results in Series 6. A further 5 hours later, where measurements of Series 7 were conducted, the average instantaneous nearbed streamwise velocities continued to decrease at some points but increased slightly at other points. This indicates that
a relatively similar level of variations in the average instantaneous nearbed streamwise velocities throughout the experiment (see Figure 3), it can be suggested that the average instantaneous nearbed flow velocities are reducing as it is difficult to expect the streamwise nearbed flow velocities would perform in a similar manner throughout the experiment. The mobile bed as it deforms would have different bed roughness at different observed time elapsed. The level of variations in the instantaneous nearbed streamwise velocities with longer time interval between the early and the later stages of constant flowrates in Test 3 (between Series 5 and Series 7) are notably wider than the variation in Test 1 and Test 2 respectively. The variations are ranging between 3.1 % increased and 10.6 % decreased from the average values of instantaneous nearbed streamwise flow velocities. It is believed that the variations of instantaneous nearbed streamwise flow velocities which resulted in different level of turbulences at different points were caused by the variations of bed roughness even at a small adjacent area within the measurement grid. It is worth noting that the measurement was carried out at 10 mm from the bed surface so that the influence of either isolated exposed grains or valley-formed bed features would be relatively closed and would therefore be likely to affect the instantaneous nearbed streamwise flow velocities. Overall, the average values of the instantaneous nearbed streamwise flow velocities within measurement grid decreased with time while the average standard deviations were sensibly constant throughout the length of experiment.
The experiments enable some conclusions to be drawn as the following :
- All series of measurement suggest that the instantaneous nearbed streamwise flow velocities varied throughout constant flowrates. The range of variations for the shorter tests is lower than for the longer tests. In Test 1 the range of variations of the point averaged instantaneous nearbed streamwise flow velocity is 9.3 % whilst in Test 2 is 9.9 % and notably wider in Test 3 with 13.7 % .
- The variations in the instantaneous nearbed streamwise flow velocities show that different level of turbulences occurred during constant flowrates even at an adjacent point within a relatively small area of the measurement grid. - Regardless of measurements time
elapsed, the standard deviations of the instantaneous nearbed streamwise flow velocities are relatively stable with very low variation but the time averaged instantanous nearbed streamwise flow velocities are generally decreased towards the end of each test.
Recommendations
Given that the bed surface changes were not observed in this particular study, the changes in bed surface corresponding to different flow condition could not be estimated. It is therefore necessary to analyse the bed surface changes to discover if there is any link between the
variations of instantaneous nearbed streamwise flow velocities and the changes in the bed surface roughness. It would also be helpful to carry out comparable measurements with another low-noise flowmeter to obtain information on the turbulence measurement using different techniques so that comparisons between methods can be investigated.
REFERENCES
Garcia, M., Nino, Y., and Lopez, F., 1996, Laboratory Observations of Particle Entrainment into Suspension by Turbulent Bursting; in Coherent Flow Structures in Open Channels, eds. P.J. Ashworth, S.J. Bennet, J.L. Best and S.J. McLelland, John Wiley and Son, Chichester, 63 - 86.
Grass, A.J., 1971, Structural Features of Turbulent Flow over Smooth and Rough Boundaries, Journal of Fluid Mechanics, 50 (2), 233-255.
Kim, H.T., Kline, S.J., and Reynolds, W.C., 1971, The Production of Turbulence Near A Smooth Wall, Journal of Fluid Mechanics, 50, 133-160.
Nezu, I., and Nakagawa, H., 1993, Turbulence in Open-Channel Flows, A.A. Balkema, Brookfield, V.T.
Nikora, V.I., and Goring, D.G., 1999, Turbulence Structure in Gravel-Bed Flows with Static and Weakly Mobile Beds: A Comparative Study, Internal Report, NIWA, New Zealand.
Nowell,, A.R.M., and Church, M., 1979, Turbulent Flow in A Depth-Limited Boundary Layer, Journal of Geophysical Research, 84 (C8), 4816-4824.
Roy, A.G., Buffin-Belanger, T., and Deland, S., 1996, Scales of Turbulent Coherent Flow Structures in A Gravel-bed Rivers; in Coherent Flow Structures in Open Channels, eds. P.J. Ashworth, S.J. Bennet, J.L. Best and S.J. McLelland, John Wiley and Son, Chichester, 147 -164.
Roy, A.G., Biron, P.M., Buffin-Belanger, T., and Levasseur, M., 1999, Combined Visual and Quantitative Techniques in the Study of Natural Turbulent Flows, Water Resources Research, 35 (3), 871-877.
Saadi, Y., 2000, The Impact of Unsteady Flows on the Erosion and Movement of Mixed Grain Size Sediment, Transfer Report (unpublished), Department of Civil and Structural Engineering University of Sheffield.
Song, T., and Graf, W.H., 1996, Velocity and Turbulence Distribution in Unsteady Open-Channel Flow, Journal of Hydraulic Engineering, 122 (3), 141-154.