Trop. For. Manage. J. VII (2) : 33-45 (2001)
GIS-BASED METHOD IN DEVELOPING WILDFIRE
RISK MODEL
(
Case Study in Sasamba, East Kalimantan, Indonesia
)
JARUNTON BOONYANUPHAP1), F. GUNARWAN SURATMO2),I NENGAH SURATI JAYA3) and FAHMI AMHAR4)
ABSTRAK
Analisis pemetaan lengkap (Cemplete Mapping Analysis) yang berbasis sistem informasi geografis (SIG) digunakan untuk melakukan pembobotan terhadap nilai “vulnerability” dari faktor -faktor resiko dalam rangka membangun suatu model dan memetakan kelas-kelas resiko kebakaran liar. Ada dua faktor utama, yaitu faktor lingkungan fisik dan aktifitas manusia yang sangat mempengaruhi terjadinya kebakaran hutan. Model yang ditemukan pada saat ini memperlihatkan bahwa kelembaban relatif adalah faktor terpenting diantara faktor lingkungan fisik, sementara jarak terhadap pusat-pusat pemukiman merupakan faktor terpenting diantara faktor aktifitas manusia. Diketahui juga bahwa, terjadinya kebakaran liar lebih banyak dipengaruhi oleh faktor aktifitas manusia daripada faktor lingkungan fisik. Pada studi ini, wilayah resiko kebakaran liar dibagi atas 3 kelas, dimana ditemukan bahwa kelas resiko kebakaran tertinggi mendominasi lokasi penelitian, selanjutnya diikuti dengan kelas resiko sedang dan rendah. Berdasarkan hasil verifikasi, model hanya berhasil menduga kelas resiko tinggi yaitu sebesar 76,05%, sementara gagal dalam menduga resiko kebakaran sedang dan rendah (lebih rendah dari 40%).
INTRODUCTION
Reports within the past two decades have evidently showed that forest and land fire had increased severely and for longer periods. Normally, fires occur every year but a prolonged and extremely severe fire season occurred in years of unusually long drought associated with the El-Niño-Southern Oscillation (ENSO). Wildfires in Indonesia are almost always human caused; Dennis (1999) noted that smallholders clearing land for cultivation were primarily blamed for starting fires that rapidly spread out of control.
Fire losses often make it impossible to reach sustainable forest management; therefore in order to have an effective and efficient sustainable forest management, the fire prevention should be considered as high priority because it is the key to solving the fire
1) Scientist at the Department of Natural Resources and Environmental, Faculty of Agriculture and Natural
Resources and Environmental Science, Naresuan University, Tumbon Thapho, Ampho Muang, Phisanulok, 65000, Thailand E-mail: [email protected]
2) Professor at the Laboratory of Forest Pest, Faculty of Forestry, Bogor, Agricultural University, Indonesia 3) Lecturer and scientist at the Laboratory of Forest Inventory, Faculty of Forestry, Bogor Agricultural
University Kampus IPB Darmaga, Bogor. Email: [email protected]
problem. Furthermore, the focus on this principal problem should not be on fire fighting, but in identifying major factors and interactions among them that contribute to wildfires.
A wildfire risk model can serve as an early warning system to predict the severity level of future fire risks which significant for wildfire prevention and fighting strategies. In addition, a GIS method is able to use information from many different sources, in many different forms, as well as be able to analyze such information in a quick and more efficient manner. The map of wildfire risk zone provides information for identifying the critical areas, and supports the control of large fire risk areas. Information for fire risk areas is essential to define corrective measure, which act on the existing environment and to implement defensive infrastructures that will prevent high incidence of fire ignition.
The main goal of this study is to use a GIS application to develop a wildfire risk model through the study of the spatial dimensions of interacting factors associated with the likelihood of wildfires. The specific objectives are:
1. To assign and analyze the physical-environmental and human activity factors those are associated with the location of fire starting in the study area.
2. To map the severity class of wildfire risk.
MATERIALS AND METHODS
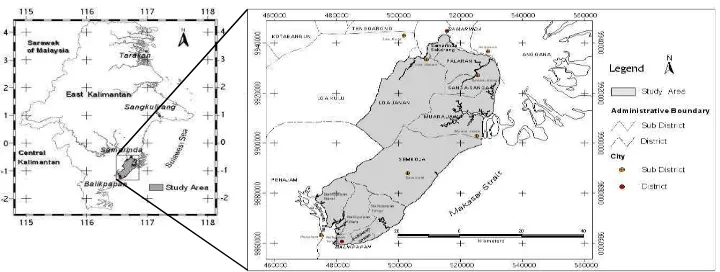
Site Description
The study was conducted within the Integrated Economic Development Zone (KAPET) of Sasamba, East Kalimantan, Indonesia, during the period of January to July 2001. The study area is approximately 249,516 hectares or 79 % of the total area of Sasamba. It is situated in equatorial area between 116º43´30´´ and 117º18´30´´ East Longitude and –0º33´30´´ and –1º13´30´´ South Latitude. This area is dominated with forest-protected area. It was chosen because of the availability of data as well as this zone is being developed to enhance the development in hinterland's prime sectors for supporting the growth of East Kalimantan. Approximately 219,487 hectares or 87.96 % of the study area was fire affected during the great fires in 1997/98.
Materials and Tools
Maps and supporting data were collected from several agencies in Indonesia such as BAKOSURTANAL (National Coordinating Agency for Surveys and Mapping of Indonesia), GTZ Samarinda Office (Integrated Forest Fire Management Project: IFFM), and BPPT (Agency for the Assessment and Application of Technology). The collected data included topographic maps, weather data, and thematic maps in both digital and hard copy format. The PC ARC/INFO 3.5.1 software was used for inputting data, while data manipulation and analysis was implemented the using the ArcView GIS Version 3.1.
Research Method
A GIS-based method of CMA was used to determine the severity level of a wildfire risk zone in terms of wildfire vulnerability mapping by assessing the relative importance between wildfire factors and the location of fire ignition. The general flow of the research activities is shown in Figure 2.
Data Manipulation
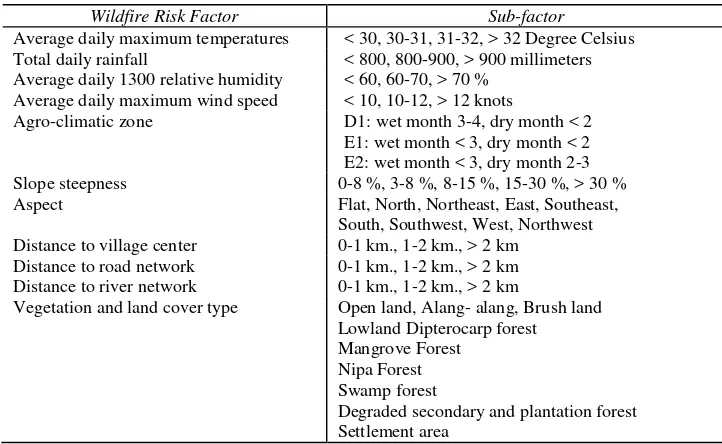
The wildfire risk factors were grouped into two major groups, i.e. physical-environmental and human activity factors (Table 1). A DEM dataset was interpolated in order to derive slope and aspect dataset. All of the weather data that was associated with the El-Niño-Southern Oscillation (ENSO) were collected for the May 1997 to May 1998 period. Afterwards, the data was transferred to an ArcView GRID dataset using the Kriging interpolation method. The buffer function was used to generate buffer zones ranging from 1 km up to 2 km from the human activity features. The vegetation and land cover type factor was placed under the human activity factor because it was not directly related to the fire starting, but was strongly associated with the use of land by humans in the study area.
All of the dataset were converted into 1-hectare gird cell size in ArcView Grid format. A grid cell size of 1 hectare was assigned because the Hot Spots was recorded as a point feature, thus the number of Hot Spots in the grid format must be considered. The result showed that the comparison of the number of Hot Spot between original data and grid dataset is exactly the same.
Defining the Wildfire Risk Factors
Table 1. Classification of sub-factor for wildfire risk factors
Wildfire Risk Factor Sub-factor
Average daily maximum temperatures < 30, 30-31, 31-32, > 32 Degree Celsius Total daily rainfall < 800, 800-900, > 900 millimeters Average daily 1300 relative humidity < 60, 60-70, > 70 %
Average daily maximum wind speed < 10, 10-12, > 12 knots
Agro-climatic zone D1: wet month 3-4, dry month < 2 E1: wet month < 3, dry month < 2 E2: wet month < 3, dry month 2-3 Slope steepness 0-8 %, 3-8 %, 8-15 %, 15-30 %, > 30 % Aspect Flat, North, Northeast, East, Southeast,
South, Southwest, West, Northwest Distance to village center 0-1 km., 1-2 km., > 2 km
Distance to road network 0-1 km., 1-2 km., > 2 km Distance to river network 0-1 km., 1-2 km., > 2 km
Vegetation and land cover type Open land, Alang- alang, Brush land Lowland Dipterocarp forest Mangrove Forest
Nipa Forest Swamp forest
Degraded secondary and plantation forest Settlement area
Analysis for the wildfire vulnerability value
In this study, the actual burnt area was not chosen for analyzing wildfire vulnerability value because the study area was mostly (87.96 %) affected by the 1997/98 fires. The composite vulnerability value of wildfire starting was calculated using the following equation:
wi = weight of each physical-environmental factor related between them
yi = weight of each human activity factor related between them
xi = vulnerability score of physical-environmental sub-factors
zi = vulnerability score of human activities sub-factors
100
Where: xi = vulnerability score of the physical-environmental sub-factors
zi = vulnerability score of the human activity sub-factors
oi = number of observed Hot Spots in each sub-factor
ei = number of expected Hot Spots in each sub-factor
T = total number of observed Hot Spots
F = the percentage of area in each sub-factor
The weighing score of both physical-environmental and human activity factors were calculated using the following two equations:
N
Mi = average of the percentage of Hot Spots for each physical-environmental
factor.
M = total average percentage of Hot Spots from all physical-environmental
factors.
Ni = the percentage of Hot Spots within buffer zone 1 km for each human
activity factor.
N = total percentage of Hot Spots within buffer 1 km from all human activity
factors.
E = ; H =
Mapping the wildfire risk model
The map of wildfire risk zone was created from the dataset of composite vulnerability value. The zone was grouped into 3 severity classes of wildfire risks i.e., low, moderate, and high, using the equal interval range as class breaks (that means, the 33.33% of the lowest values were put in the first class, the next 33.33 % in the second class and so on), using the following equation.
Level of wildfire risk = Maximum – Minimum value of the composite vulnerability 3
Accuracy Assessment of the Model
The burnt scar map was used as the reference dataset to evaluate the accuracy of wildfire risk model. This model assessment used the relationship between the burnt scar map and each wildfire risk class. Overlaying the burnt scar map onto map of wildfire risk
did a basic verification of the wildfire risk model. To check the coincided value (CV), the
following equation (Boonyanuphap, 1998) was used:
F
CV = the Coincided Value of each fire risk class as compared with the burnt area
(0-100 %)
R = the area of burnt scar in 1997/98
F = the area of each class of fire risk
S = the coincided area of burnt scar and each class of fire risk
Figure 2. General flow of research activities
Human Activities Factors Physical-Environmental
- Distance to road - Distance to river - Distance to village center - Vegetation and Land cover - Rainfall
- Temperature - Relative Humidity - Wind Speed - Agro-Climate Zone - Slope
- Aspect
Location of Hot Spot
- During May 1997 to May 1998
GIS-Based Data Manipulation
Analysis of Hot Spot Pattern
Vulnerability score for sub-factor
Assign and ignore
Relative weighting score of each
Wildfire Risk Model & Wildfire composite vulnerability
Fire Damage Class in 1997/98
Map of Wildfire Risk Zone
Burnt area in
Data Extraction
Model Assessment
Coincided Value
Model Development with reclassification of sub-factor
GIS-Based Modeling of CMA
RESULTS AND DISCUSSIONS
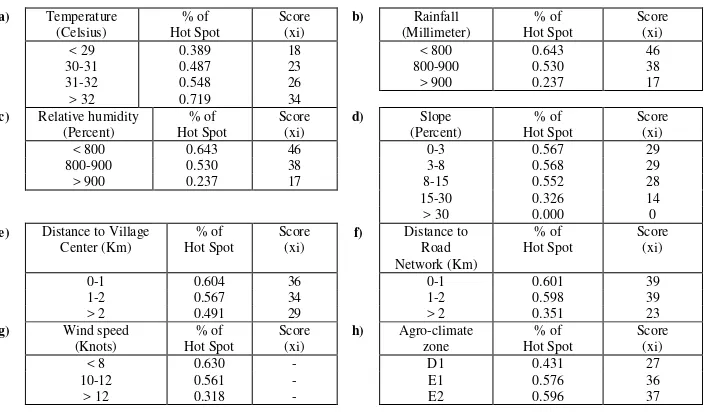
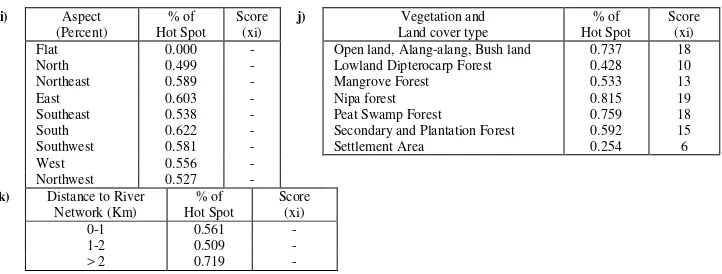
Hot Spot pattern and Relative vulnerability scores of each sub-factor
The Hot Spot pattern simply depicted the relationship between the sub-factors of each wildfire factor and the percentage of Hot Spots occurrences. The high percentage of Hot Spot occurrences expressed a higher probability of fire ignition. In addition, the vulnerability score of the sub-factors strongly relate to the percentage of Hot Spot occurrences in each factor (Table 2).
It was found that the average daily maximum wind speed, aspect and river network factors had an illogical relationship between percentage of Hot Spot and each sub-factor. These factors conflict with former research study literatures (Heikkilä et al., 1993). Normally, the probability of wildfire occurrence increases when the wind speed increases to produce a successful ignition. This study shows that it decreases with the increasing of wind speed. For the aspect, the areas generally get heat and drying from the sun and wind in the afternoon were easier to start a fire than areas that get heat only in the morning. In this study area, the southern aspect has the highest percentage of Hot Spot occurrences; followed by area on east and northeast aspects. Moreover, the Hot Spot pattern of river network had no relationship between the percentage of Hot Spot occurrences and the distance from rivers. It seems to be different from the other human activity features (village center and road), the area with more than 2 kilometers away from river network has the lowest percentage of Hot Spots occurrence.
Table 2. The percentage of number of hot spots and vulnerability scores of all factors
a) Temperature
e) Distance to Village
i) Aspect
Hot Spot pattern of physical-environmental and human activity factors
The relative effects of the distance from human activity factors and the physical-environmental factors suggested that the human activity factors had a higher percentage of Hot Spots occurrences than the physical-environmental factors (Table 3).
Table 3. The number of hot spots inside 1 km and outside 2 km buffer zones
Buffer Interval (km) Total Cell Number of Hot Spot % of Hot Spots
0-1 188,717 1126 0.597
1-2 35,690 208 0.583
Outside 2 25,125 76 0.302
Relative weight of the physical-environmental and human activity factors
From Table 4, the average daily 1300 relative humidity gave the highest weight, while the slope factor gave the lowest influence of all physical-environmental to start a fire. The percentage of Hot Spots within the 0-1 km buffer zone from village and road network factors was used for calculating the weighting score of each human factor. The result showed the location of village center was the most important factor to probability of starting fire.
Table 4. Weighting score of each physical-environmental and human activity factor
Physical-environmental Factor Weight (wi)
Human Activity Factor Weight (yi)
Daily 1300 Relative Humidity 0.23 Village center 0.34 Daily Maximum Temperature 0.21 Road network 0.33 Agro-Climatic Zone 0.21 Vegetation and Land Cover Type 0.33 Total Daily Rainfall 0.19
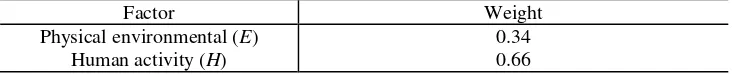
Relative weight between the physical-environmental and human activity factors
The relative weighting score of physical-environmental and human activity factors as shown in Table 5, evidently showed that the human activity factor had greater influence than physical-environmental factor in causing wildfire.
Table 5. Weighting score of environmental physical and human activity factors
Factor Weight
Physical environmental (E)
Human activity (H)
0.34 0.66
Analysis of the wildfire vulnerability values
The final vulnerability and weighting scores for each sub-factor and factor were then entered in the equation of the wildfire vulnerability model as follows:
V = {[0.34 (0.21 x1 + 0.19 x2 + 0.23 x3 + 0.21 x4 +0.16 x5)] + [0.66 (0.34 z1 + 0.33 z2 + 0.33 z3)]}
Where:
V = the composite wildfire vulnerability value
x1 = vulnerability score of sub-factors in average daily maximum temperature
x2 = vulnerability score of sub-factors in total daily rainfall
x3 = vulnerability score of sub-factors in average daily 1300 relative humidity
x4 = vulnerability score of sub-factors in agro-climatic zone x5 = vulnerability score of sub-factors in slope
z1 = vulnerability score of sub-factors in location of village center z2 = vulnerability score of sub-factors in road network
z3 = vulnerability score of sub-factors in vegetation and land cover type
The composite wildfire vulnerability values had a range from 21.40 to 33.76, in which the higher values of wildfire vulnerability expressed the higher probability of the fire starting. This vulnerability value also forecasts the wildfire risk level and assesses the susceptibility in wildfire.
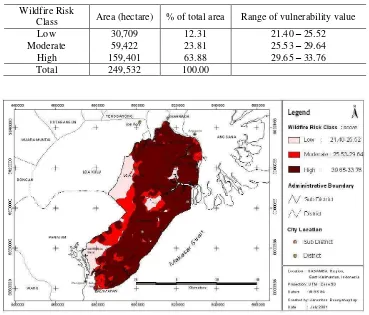
Mapping the wildfire risk model
forest, the settlement area in southern part of Balikpapan city and the secondary or plantation forest area. The high wildfire risk zone covered the largest area of 159,401 hectares or 63.88 % of the study area. It was mostly situated in a flat area of Nipa forest and the hilly area of secondary and plantation forest. This zone was also located in the northern area of settlement close to Samarinda. In the eastern side along of the main coastal towns of Balikpapan and Samarinda, the zone was bare land and grassland, secondary forest, mangrove forest, and pest swamp forest. In this zone it also evidently shows that the areas within 1 kilometer from human activities had very high potential to wildfire starting.
Table 6. Area of wildfire risk class
Wildfire Risk
Class Area (hectare) % of total area Range of vulnerability value
Low 30,709 12.31 21.40 – 25.52
Moderate 59,422 23.81 25.53 – 29.64
High 159,401 63.88 29.65 – 33.76
Total 249,532 100.00
Accuracy Assessment of the Model
From Table 7, the higher coincided values describe the greater accuracy of the wildfire risk model. It also shows the influence of wildfire factors can highly affects in the future wildfire occurrence. The high wildfire risk class had the highest coincided value (76.05); followed by medium and low wildfire risk classes respectively. It means that 76.05 % of the high wildfire risk area can probably be burnt.
Table 7. The coincided value (CV) of each wildfire risk class
Fire Risk Class S R F CV
(Hectare) (Hectare) (Hectare) (%)
Low 27,667 219,487 30,709 22.12
Medium 47,749 219,487 59,422 34.24
High 144,071 219,487 159,401 76.05
Total 219,487 249,532
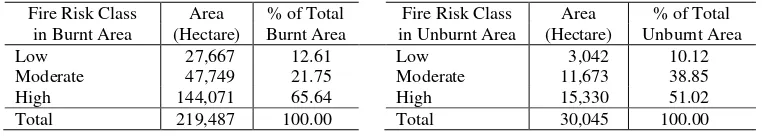
Another technique was performed by calculating a simple relationship between the actual burned area and the wildfire risk model. This technique expresses the accuracy of the model describing the percentage of each class in wildfire risk zone that was a member of the burned area. Compared with the other wildfire risk classes, the area of high wildfire risk had the highest percentage of total burnt area (65.64 %) as shown in Table 8.
Table 8. The percentage of wildfire risk class in burnt and unburnt areas
Fire Risk Class Area % of Total Fire Risk Class Area % of Total in Burnt Area (Hectare) Burnt Area in Unburnt Area (Hectare) Unburnt Area
Low 27,667 12.61 Low 3,042 10.12
Moderate 47,749 21.75 Moderate 11,673 38.85 High 144,071 65.64 High 15,330 51.02 Total 219,487 100.00 Total 30,045 100.00
CONCLUSION AND RECOMMENDATIONS
Conclusion
Among all physical-environmental factors the relative humidity was found to be the most important of of wildfire ignition in this area; while the location of the village center was the most important fire ignition factor of all the human activities factors. It was clearly displayed that the human activities factor gives higher influence for causing a wildfire than the physical-environmental factor.
having only 22.12 % and 34.24 %. It was found that the high wildfire risk class had the highest percentage of the burnt area at 65.64 %, followed by moderate and low wildfire risk class having 21.75 % and 12.61 %, respectively.
Recommendations
This study modeled the wildfire risk zone based on the unusually long drought associated with the El-Niño phenomenon of 1997/98. For future studies and to be prepared to prevent future fire disasters the following recommendations are given:
1. The location of the Hot Spots was used to replace the burnt area information in order to assign a wildfire vulnerability score. A statistical test of the vulnerability score and weighting should be implemented for proving this method. Otherwise, different methods of accuracy assessment of the model should also be tested.
2. This study only used weather data collected during the El-Niño phenomenon of 1997/98. Therefore, collecting the completed weather data, especially for every El-Niño phenomenon, should be performed in a collaborative effort between agencies to develop a more effective model.
3. The wildfire vulnerability score and weight of each factor depend on the classification of sub-factor or category. This work also requires some modeling or programming language, such as ArcView Avenue script, to develop and iterate the scoring values. 4. This study did not include socioeconomic or demographic factors, which are
important in identifying the causes of wildfire ignitions. These factors should be considered when developing the model in the future. These information is necessary to provide the perspective and basic requirement of the local people associated with burning activities in order to contribute to fire prevention activities in the study area.
LITERATURES CITED
Boonyanuphap J., 1998. Application of GIS for Assessing Risk Area for the Forest Encroachment in Huai Kha Kheng Wildlife Sanctuary, Thailand. Master Thesis, Faculty of Forestry, Kasetsart University, Thailand. Unpublished.
Dennis, R. 1999. A Review of Fire Projects in Indonesia (1982-1998). Center for International Forestry Research (CIFOR). SMT Grafika Desa Putera, Jakarta.
Heikkilä, V.T., R. Grönqvist, and M. Jurvélius. 1993. Handbook on Forest Fire Control. Forestry Training Programme Publication 21. National Board of Education of the Government of Finland. Painotalo Miktor, Helsinki.
Plangrisi, C., 2000. Assessment of Forest Fire Risk in Nahaeo National Park, Loei
Province. Master Thesis, King Mongkut’s University of Technology Thonburi,
Thailand. Unpublished
Trop. For. Manage. J. VII (2) : 33-45 (2001)
GIS-BASED METHOD IN DEVELOPING WILDFIRE
RISK MODEL
(
Case Study in Sasamba, East Kalimantan, Indonesia
)
JARUNTON BOONYANUPHAP1), F. GUNARWAN SURATMO2),I NENGAH SURATI JAYA3) and FAHMI AMHAR4)
ABSTRAK
Analisis pemetaan lengkap (Cemplete Mapping Analysis) yang berbasis sistem informasi geografis (SIG) digunakan untuk melakukan pembobotan terhadap nilai “vulnerability” dari faktor -faktor resiko dalam rangka membangun suatu model dan memetakan kelas-kelas resiko kebakaran liar. Ada dua faktor utama, yaitu faktor lingkungan fisik dan aktifitas manusia yang sangat mempengaruhi terjadinya kebakaran hutan. Model yang ditemukan pada saat ini memperlihatkan bahwa kelembaban relatif adalah faktor terpenting diantara faktor lingkungan fisik, sementara jarak terhadap pusat-pusat pemukiman merupakan faktor terpenting diantara faktor aktifitas manusia. Diketahui juga bahwa, terjadinya kebakaran liar lebih banyak dipengaruhi oleh faktor aktifitas manusia daripada faktor lingkungan fisik. Pada studi ini, wilayah resiko kebakaran liar dibagi atas 3 kelas, dimana ditemukan bahwa kelas resiko kebakaran tertinggi mendominasi lokasi penelitian, selanjutnya diikuti dengan kelas resiko sedang dan rendah. Berdasarkan hasil verifikasi, model hanya berhasil menduga kelas resiko tinggi yaitu sebesar 76,05%, sementara gagal dalam menduga resiko kebakaran sedang dan rendah (lebih rendah dari 40%).
INTRODUCTION
Reports within the past two decades have evidently showed that forest and land fire had increased severely and for longer periods. Normally, fires occur every year but a prolonged and extremely severe fire season occurred in years of unusually long drought associated with the El-Niño-Southern Oscillation (ENSO). Wildfires in Indonesia are almost always human caused; Dennis (1999) noted that smallholders clearing land for cultivation were primarily blamed for starting fires that rapidly spread out of control.
Fire losses often make it impossible to reach sustainable forest management; therefore in order to have an effective and efficient sustainable forest management, the fire prevention should be considered as high priority because it is the key to solving the fire
1) Scientist at the Department of Natural Resources and Environmental, Faculty of Agriculture and Natural
Resources and Environmental Science, Naresuan University, Tumbon Thapho, Ampho Muang, Phisanulok, 65000, Thailand E-mail: [email protected]
2) Professor at the Laboratory of Forest Pest, Faculty of Forestry, Bogor, Agricultural University, Indonesia 3) Lecturer and scientist at the Laboratory of Forest Inventory, Faculty of Forestry, Bogor Agricultural
University Kampus IPB Darmaga, Bogor. Email: [email protected]
problem. Furthermore, the focus on this principal problem should not be on fire fighting, but in identifying major factors and interactions among them that contribute to wildfires.
A wildfire risk model can serve as an early warning system to predict the severity level of future fire risks which significant for wildfire prevention and fighting strategies. In addition, a GIS method is able to use information from many different sources, in many different forms, as well as be able to analyze such information in a quick and more efficient manner. The map of wildfire risk zone provides information for identifying the critical areas, and supports the control of large fire risk areas. Information for fire risk areas is essential to define corrective measure, which act on the existing environment and to implement defensive infrastructures that will prevent high incidence of fire ignition.
The main goal of this study is to use a GIS application to develop a wildfire risk model through the study of the spatial dimensions of interacting factors associated with the likelihood of wildfires. The specific objectives are:
1. To assign and analyze the physical-environmental and human activity factors those are associated with the location of fire starting in the study area.
2. To map the severity class of wildfire risk.
MATERIALS AND METHODS
Site Description
The study was conducted within the Integrated Economic Development Zone (KAPET) of Sasamba, East Kalimantan, Indonesia, during the period of January to July 2001. The study area is approximately 249,516 hectares or 79 % of the total area of Sasamba. It is situated in equatorial area between 116º43´30´´ and 117º18´30´´ East Longitude and –0º33´30´´ and –1º13´30´´ South Latitude. This area is dominated with forest-protected area. It was chosen because of the availability of data as well as this zone is being developed to enhance the development in hinterland's prime sectors for supporting the growth of East Kalimantan. Approximately 219,487 hectares or 87.96 % of the study area was fire affected during the great fires in 1997/98.
Materials and Tools
Maps and supporting data were collected from several agencies in Indonesia such as BAKOSURTANAL (National Coordinating Agency for Surveys and Mapping of Indonesia), GTZ Samarinda Office (Integrated Forest Fire Management Project: IFFM), and BPPT (Agency for the Assessment and Application of Technology). The collected data included topographic maps, weather data, and thematic maps in both digital and hard copy format. The PC ARC/INFO 3.5.1 software was used for inputting data, while data manipulation and analysis was implemented the using the ArcView GIS Version 3.1.
Research Method
A GIS-based method of CMA was used to determine the severity level of a wildfire risk zone in terms of wildfire vulnerability mapping by assessing the relative importance between wildfire factors and the location of fire ignition. The general flow of the research activities is shown in Figure 2.
Data Manipulation
The wildfire risk factors were grouped into two major groups, i.e. physical-environmental and human activity factors (Table 1). A DEM dataset was interpolated in order to derive slope and aspect dataset. All of the weather data that was associated with the El-Niño-Southern Oscillation (ENSO) were collected for the May 1997 to May 1998 period. Afterwards, the data was transferred to an ArcView GRID dataset using the Kriging interpolation method. The buffer function was used to generate buffer zones ranging from 1 km up to 2 km from the human activity features. The vegetation and land cover type factor was placed under the human activity factor because it was not directly related to the fire starting, but was strongly associated with the use of land by humans in the study area.
All of the dataset were converted into 1-hectare gird cell size in ArcView Grid format. A grid cell size of 1 hectare was assigned because the Hot Spots was recorded as a point feature, thus the number of Hot Spots in the grid format must be considered. The result showed that the comparison of the number of Hot Spot between original data and grid dataset is exactly the same.
Defining the Wildfire Risk Factors
Table 1. Classification of sub-factor for wildfire risk factors
Wildfire Risk Factor Sub-factor
Average daily maximum temperatures < 30, 30-31, 31-32, > 32 Degree Celsius Total daily rainfall < 800, 800-900, > 900 millimeters Average daily 1300 relative humidity < 60, 60-70, > 70 %
Average daily maximum wind speed < 10, 10-12, > 12 knots
Agro-climatic zone D1: wet month 3-4, dry month < 2 E1: wet month < 3, dry month < 2 E2: wet month < 3, dry month 2-3 Slope steepness 0-8 %, 3-8 %, 8-15 %, 15-30 %, > 30 % Aspect Flat, North, Northeast, East, Southeast,
South, Southwest, West, Northwest Distance to village center 0-1 km., 1-2 km., > 2 km
Distance to road network 0-1 km., 1-2 km., > 2 km Distance to river network 0-1 km., 1-2 km., > 2 km
Vegetation and land cover type Open land, Alang- alang, Brush land Lowland Dipterocarp forest Mangrove Forest
Nipa Forest Swamp forest
Degraded secondary and plantation forest Settlement area
Analysis for the wildfire vulnerability value
In this study, the actual burnt area was not chosen for analyzing wildfire vulnerability value because the study area was mostly (87.96 %) affected by the 1997/98 fires. The composite vulnerability value of wildfire starting was calculated using the following equation:
wi = weight of each physical-environmental factor related between them
yi = weight of each human activity factor related between them
xi = vulnerability score of physical-environmental sub-factors
zi = vulnerability score of human activities sub-factors
100
Where: xi = vulnerability score of the physical-environmental sub-factors
zi = vulnerability score of the human activity sub-factors
oi = number of observed Hot Spots in each sub-factor
ei = number of expected Hot Spots in each sub-factor
T = total number of observed Hot Spots
F = the percentage of area in each sub-factor
The weighing score of both physical-environmental and human activity factors were calculated using the following two equations:
N
Mi = average of the percentage of Hot Spots for each physical-environmental
factor.
M = total average percentage of Hot Spots from all physical-environmental
factors.
Ni = the percentage of Hot Spots within buffer zone 1 km for each human
activity factor.
N = total percentage of Hot Spots within buffer 1 km from all human activity
factors.
E = ; H =
Mapping the wildfire risk model
The map of wildfire risk zone was created from the dataset of composite vulnerability value. The zone was grouped into 3 severity classes of wildfire risks i.e., low, moderate, and high, using the equal interval range as class breaks (that means, the 33.33% of the lowest values were put in the first class, the next 33.33 % in the second class and so on), using the following equation.
Level of wildfire risk = Maximum – Minimum value of the composite vulnerability 3
Accuracy Assessment of the Model
The burnt scar map was used as the reference dataset to evaluate the accuracy of wildfire risk model. This model assessment used the relationship between the burnt scar map and each wildfire risk class. Overlaying the burnt scar map onto map of wildfire risk
did a basic verification of the wildfire risk model. To check the coincided value (CV), the
following equation (Boonyanuphap, 1998) was used:
F
CV = the Coincided Value of each fire risk class as compared with the burnt area
(0-100 %)
R = the area of burnt scar in 1997/98
F = the area of each class of fire risk
S = the coincided area of burnt scar and each class of fire risk
Figure 2. General flow of research activities
Human Activities Factors Physical-Environmental
- Distance to road - Distance to river - Distance to village center - Vegetation and Land cover - Rainfall
- Temperature - Relative Humidity - Wind Speed - Agro-Climate Zone - Slope
- Aspect
Location of Hot Spot
- During May 1997 to May 1998
GIS-Based Data Manipulation
Analysis of Hot Spot Pattern
Vulnerability score for sub-factor
Assign and ignore
Relative weighting score of each
Wildfire Risk Model & Wildfire composite vulnerability
Fire Damage Class in 1997/98
Map of Wildfire Risk Zone
Burnt area in
Data Extraction
Model Assessment
Coincided Value
Model Development with reclassification of sub-factor
GIS-Based Modeling of CMA
RESULTS AND DISCUSSIONS
Hot Spot pattern and Relative vulnerability scores of each sub-factor
The Hot Spot pattern simply depicted the relationship between the sub-factors of each wildfire factor and the percentage of Hot Spots occurrences. The high percentage of Hot Spot occurrences expressed a higher probability of fire ignition. In addition, the vulnerability score of the sub-factors strongly relate to the percentage of Hot Spot occurrences in each factor (Table 2).
It was found that the average daily maximum wind speed, aspect and river network factors had an illogical relationship between percentage of Hot Spot and each sub-factor. These factors conflict with former research study literatures (Heikkilä et al., 1993). Normally, the probability of wildfire occurrence increases when the wind speed increases to produce a successful ignition. This study shows that it decreases with the increasing of wind speed. For the aspect, the areas generally get heat and drying from the sun and wind in the afternoon were easier to start a fire than areas that get heat only in the morning. In this study area, the southern aspect has the highest percentage of Hot Spot occurrences; followed by area on east and northeast aspects. Moreover, the Hot Spot pattern of river network had no relationship between the percentage of Hot Spot occurrences and the distance from rivers. It seems to be different from the other human activity features (village center and road), the area with more than 2 kilometers away from river network has the lowest percentage of Hot Spots occurrence.
Table 2. The percentage of number of hot spots and vulnerability scores of all factors
a) Temperature
e) Distance to Village
i) Aspect
Hot Spot pattern of physical-environmental and human activity factors
The relative effects of the distance from human activity factors and the physical-environmental factors suggested that the human activity factors had a higher percentage of Hot Spots occurrences than the physical-environmental factors (Table 3).
Table 3. The number of hot spots inside 1 km and outside 2 km buffer zones
Buffer Interval (km) Total Cell Number of Hot Spot % of Hot Spots
0-1 188,717 1126 0.597
1-2 35,690 208 0.583
Outside 2 25,125 76 0.302
Relative weight of the physical-environmental and human activity factors
From Table 4, the average daily 1300 relative humidity gave the highest weight, while the slope factor gave the lowest influence of all physical-environmental to start a fire. The percentage of Hot Spots within the 0-1 km buffer zone from village and road network factors was used for calculating the weighting score of each human factor. The result showed the location of village center was the most important factor to probability of starting fire.
Table 4. Weighting score of each physical-environmental and human activity factor
Physical-environmental Factor Weight (wi)
Human Activity Factor Weight (yi)
Daily 1300 Relative Humidity 0.23 Village center 0.34 Daily Maximum Temperature 0.21 Road network 0.33 Agro-Climatic Zone 0.21 Vegetation and Land Cover Type 0.33 Total Daily Rainfall 0.19
Relative weight between the physical-environmental and human activity factors
The relative weighting score of physical-environmental and human activity factors as shown in Table 5, evidently showed that the human activity factor had greater influence than physical-environmental factor in causing wildfire.
Table 5. Weighting score of environmental physical and human activity factors
Factor Weight
Physical environmental (E)
Human activity (H)
0.34 0.66
Analysis of the wildfire vulnerability values
The final vulnerability and weighting scores for each sub-factor and factor were then entered in the equation of the wildfire vulnerability model as follows:
V = {[0.34 (0.21 x1 + 0.19 x2 + 0.23 x3 + 0.21 x4 +0.16 x5)] + [0.66 (0.34 z1 + 0.33 z2 + 0.33 z3)]}
Where:
V = the composite wildfire vulnerability value
x1 = vulnerability score of sub-factors in average daily maximum temperature
x2 = vulnerability score of sub-factors in total daily rainfall
x3 = vulnerability score of sub-factors in average daily 1300 relative humidity
x4 = vulnerability score of sub-factors in agro-climatic zone x5 = vulnerability score of sub-factors in slope
z1 = vulnerability score of sub-factors in location of village center z2 = vulnerability score of sub-factors in road network
z3 = vulnerability score of sub-factors in vegetation and land cover type
The composite wildfire vulnerability values had a range from 21.40 to 33.76, in which the higher values of wildfire vulnerability expressed the higher probability of the fire starting. This vulnerability value also forecasts the wildfire risk level and assesses the susceptibility in wildfire.
Mapping the wildfire risk model