ICACSIS
2014
2014 International Conference on
Advanced Computer Science and
Information Systems
October 18th and 19th 2014
Ambhara Hotel, Blok M
Jakarta, Indonesia
+IEEE
ICACSIS
INDONESIA SECTION
2014 International Conference on
Advanced Computer Science and Information Systems
(Proceedings)
ISBN: 978-979-1421-225
ICACSIS 201-l
plenary and invited speakers.
Welcome Message from
General Chairs
On behalf of the Organizing Comminee of this
International Conference on Advanced Computer
Science and Information Systems 2014 (ICACSIS
2014), we would like to extend our warm welcome to
all of the presenter and participants, and in particular,
we would like to express our sincere gratitude to our
This international conference is organized by the Faculty of Computer Science, Universitas
Indonesia, and is intended to be the first step towards a top class conference on Computer
Science and Information Systems. We believe that this international conference will give
opportunities for sharing and exchanging original research ideas and opinions, gaining
inspiration for future research, and broadening knowledge about various fields in advanced
computer science and information systems, amongst members of Indonesian research
communities, together with researchers from Germany, Singapore, Thailand, France, Algeria,
Japan, Malaysia, Philippines, United Kingdom, Sweden, United States and other countries.
This conference focuses on the development of computer science and information systems.
Along with 4 plenary and 2 invited speeches, the proceedings of this conference contains 71
papers which have been selected from a total of 132 papers from twelve different countries.
These selected papers will be presented during the conference.
We also want to express our sincere appreciation to the members of the Program Committee for
their critical review of the submitted papers, as well as the Organizing Committee for the time
and energy they have devoted to editing the proceedings and arranging the logistics of holding
this conference. We would also like to give appreciation to the authors who have submitted their
excellent works to this conference. Last but not least, we would like to extend our gratitude to
the Ministry of Education of the Republic of Indonesia, the Rector of Universitas Indonesia,
Universitas Tarumanagara, Bogor Agricultural Institute, and the Dean of the Faculty of
Computer Science for their continued support towards the ICACSIS
2014conference.
Sincerely yours,
General Chairs
ICACSIS
201-lWelcome Message from
The Dean of Faculty of Computer Science, Universitas
Indonesia
On behalf of all the academic staff and students of the Faculty of Computer
Science, Universitas Indonesia, I would like to extend our warmest welcome to
all the participants to the Ambhara Hotel , Jakarta on the occasion of the 2014
International Conference on Advanced Computer Science and Information
Systems (ICACSIS).
Just like the previous five events in this series (ICACSIS 2009, 2010, 2011 , 2012, and 2013), I
am confident that !CASIS 2014 will play an important role in encouraging activ ities in research
and development of computer science and information technology in Indonesia, and give an
excellent opportunity to forge collaborations between research institutions both within the
country and with international partners. The broad scope of th is event, which includes both
theoretical aspects of computer science and practical, applied experience of developing
information systems, provides a unique meeting ground for researchers spanning the whole
spectrum of our discipline. I hope that.over the next two days, some fruitful collaborations can be
established.
I also hope that the special attention devoted this year to the field of pervasive computing,
including the very exc;iting area of wireless sensor networks, will ignite the development of
applications in this area to address the various needs of Indonesia ' s development.
I
would like to express my sincere gratitude to the distinguished invited speakers for their
presence and contributions to the conference. I also thank all the program committee members
for their efforts in ensuring a rigorous review process to select high quality papers.
Finally, I sincerely hope that all the participants will benefit from the technical contents of this
conference. and wish you a very successful conference and an enjoyable stay in Jakarta.
Sincerely,
Mirna Adriani, Ora, Ph.D.
Dean of the Faculty of Computer Science
Universitas Indonesia
ICACSIS 201-1
ICACSIS 2014
COMMITTEES
Honorary Chairs:
• A. Jain, IEEE Fellow, Michigan State University, US • T. Fukuda, IEEE Fellow, Nagoya University, JP • M. Adriani, Universitas Indonesia, ID
General Chairs:
• E. K. Budiarjo, Universitas Indonesia, ID • D. I. Sensuse, Universitas Indonesia, ID • Z. A. Hasibuan, Universitas Indonesia, ID
Program Chairs:
• H. B. Santoso, Universitas Indonesia, ID • W. Jatmiko, Universitas Indonesia, ID • A. Buono, lnstitut Pertanian Bogor, ID
• D. E. Herwindiati, Universitas Tarumanegara, ID
Section Chairs:
• K. Wastuwibowo, IEEE Indonesia Section, ID
Publication Chairs:
• A. Wibisono, Universitas Indonesia, ID
Program Committees :
• A. Azurat, Universitas Indonesia, ID
• A. Fanar, Lembaga llmu Pengetahuan Indonesia, ID • A. Kistijantoro, lnstitut Teknologi Bandung, ID • A. Purwarianti, Institut Teknologi Bandung, ID • A. Nugroho, PTIK BPPT, ID
• A. Srivihok, Kasetsart University, TH
• A. Arifin lnstitut Teknologi Sepuluh Nopember, ID • A. M. Arymurthy, Universitas Indonesia, ID • A. N. Hidayanto, Universitas Indonesia, ID • B. Wijaya, Universitas Indonesia, ID • B. Yuwono, Universitas Indonesia, ID • B. Hardian, Universitas Indonesia, ID • B. Purwandari, Universitas Indonesia, ID • B. A. Nazief, Universitas Indonesia, ID • B. H. Widjaja, Universitas Indonesia, ID • Denny, Universitas Indonesia, ID • D. Jana, Computer Society of India, IN • E. Gaura, Coventry University, UK • E. Seo, $ungkyunkwan University, KR • F. Gaol, IEEE Indonesia Section, ID
ICACSIS 2014
ICACSIS 2014
• H. Manurung, Universitas Indonesia, ID • H. Suhartanto, Universitas Indonesia, ID • H. Sukoco, Institut Pertanian Bogor, ID • H. Tolle, Universitas Brawijaya, ID
• I. Budi, Universitas Indonesia, ID
• I. Sitanggang, Institut Pertanian Bogor, ID
• I. Wasito, Universitas Indonesia, ID • K. Sekiyama, Nagoya University, JP • L. Stefanus, Universitas Indonesia, ID • Marimin, Institut Pertanian Bogor, ID • M. T. Suarez, De La Salle University, PH • M. Fanany, Universitas Indonesia, ID • M. Kyas, Freie Universitat Berlin, DE • M. Nakajima, Nagoya University, JP • M. Widyanto, Universitas Indonesia, ID • M. Widjaja, PTIK BPPT, ID
• N. Maulidevi, Institut Teknologi Bandung , ID • 0. Sidek, Universiti Sains Malaysia, MY • 0 . Lawanto, Utah State University, US • P. Hitzler, Wright State University, US • P. Mursanto, Universitas Indonesia, ID
• S. Bressan, National University of Singapore, SG • S. Kuswadi, Institut Teknologi Sepuluh Nopember, ID • S. Nomura, Nagaoka University of Technology, JP • S. Yazid, Universitas Indonesia, ID
• T. Basaruddin, Universitas Indonesia, ID
• T. Hardjono, Massachusetts Institute of Technology, US • T. Gunawan, International Islamic University Malaysia, MY • T. A. Masoem , Universitas Indonesia, ID
• V: Allan, Utah State University, US
• W. Chutimaskul, King Mokut's University of Technology, TH • W. Molnar, Public Research Center Henri Tudor, LU
• W. Nugroho, Universitas Indonesia, ID • W. Prasetya, Universiteit Utrecht, NL
• W. Sediono, International Islamic University Malaysia, MY • W. Susilo, University of Wollongong, AU
• W. Wibowo, Universitas Indonesia, ID • X. Li, The University of Queensland, AU • Y. Isal, Universitas Indonesia, ID • Y. Sucahyo, Universitas Indonesia, ID
Local Organizing Committee:
• A. Y. Utomo, Universitas Indonesia, ID • Aprinald i, Universitas Indonesia, ID • D. Eka, Universitas Indonesia, ID • E. S. Utama, Universitas Indonesia, ID • E. Cahyaningsih, Universitas Indonesia , ID • H. A. Wisesa, Universitas Indonesia, ID • H. R. Sanabila, Universitas Indonesia, ID • K. M. Kurniawan, Universitas Indonesia, ID • M. Mega, Universitas Indonesia, ID
• M. Ni'ma, Universitas Indonesia, ID
ICACSIS 201-1
ICACSIS 2014
• M. I. Suryani, Universitas Indonesia, ID
• M. Soleh, Universitas Indonesia, ID
• M. Pravitasari, Universitas Indonesia, ID • N. Rahmah, Universitas Indonesia, ID • Putut, Universitas Indonesia, ID • R. Musfikar, Universitas Indonesia, ID • R. Latifah, Universitas Indonesia, ID • R. P. Rangkuti, Universitas Indonesia, ID • V. Ayumi, Universitas Indonesia, ID
ICACSIS 201-1
ICACSIS 2014
CONFERENCE INFORMATION
Dates
Organizer
Venue
Official Language
Secretariat
October l81
h (Saturday) - October 19th (Sunday) 2014
Faculty of Computer Science, Universitas Indonesia
Department of Computer Science, lnstitut Pertanian Bogor
Faculty of Information Technology, Universitas Tarumanegara
Ambhara Hotel
Jalan lskandarsyah Raya No. 1, Jakarta Selatan, OKI Jakarta, 12160, Indonesia
Phone : +62-21-2700 888
Fax : +62-21-2700 215
Website : http://www.ambharahotel.com/
English
Faculty of Computer Science, Universitas Indonesia
Kampus UI Depok
Depok, 16424
Indonesia
T: +62 21786 3419 ext. 3225 F: +62 21 786 3415
W: http://www.cs.ui.ac.id
Conference Website http://icacsis.cs.ui.ac.id
ICACSIS 2014
ICACS/S 2014
PROGRAM SCHEDULE
Saturday, October 18tti, 2014-CONFERENCE
Time Event
I
Event Details Rooms08.00-09.00 Registration
Opening from the Dean of Faculty of
09.00-09.30 Opening Computer Science Universitas Indonesia/General Chair of ICACSIS
2014
Dr. Ir. Basuki Yusuf lskandar, MA Dirgantara
09.30-10.15 Plenary Speech I from Ministry of Communication and
Room, 2nd Floor
Information
10.15-10.30 Coffee Break
Prof. Dame Wendy Hall
10.30-11.15 Plenary Speech II from Southampton University, UK
11.15.12.30 Lunch
12.30-14.00 Parallel Session I : See Technical (Parallel Session I
Elang, Kasuari,
Four Parallel Sessions Schedule) Merak, Cendrawasih
Room, Lobby Level
14.00-15.30 Parallel Session II: See Technical (Parallel Session II
Elang, Kasuari,
Four Parallel Sessions Schedule) Merak, Cendrawasih
Room, Lobby Level
15.30-16.00 Coffee Break
16.00-17.30 Parallel Session Ill : See Technical (Parallel Session Ill
Elang, Kasuari,
Four Parallel Sessions Schedule) Merak, Cendrawasih
Room, Lobby Level
17.30-19.00 Break
19.00-22.00 Gala Dinner Dinner, accompanied by music Dirgantara Room,
performance and traditional dances 2nd Floor
ICACSIS 201-!
/CACSIS 2014
Sunday, October 19th, 2014-CONFERENCE
Time Event Event Details Rooms
08.00-09.00 Registration
Ors. Harry Waluyo, M .Hum
from Directorate General of Media,
09.00-10.00 Plenary Speech Ill Design, Science & Technology Based
Creative Economy Dirgantara Room,
2nd Floor
10.00-10.15 Coffee Break
Prof. Masatoshi Ishikawa
10.15-11.30 Plenary Speech IV from University of Tokyo, JP
11.30-12.30 Lunch
Parallel Session IV : See Technical (Parallel Session IV Elang, Kasuari,
12.30-14.00
Four Parallel Sessions Schedule) Merak, Cendrawasih
Room, Lobby Level
Parallel Session V : See Technical (Parallel Session V Elang, Kasuari,
14.00-15.30
Four Parallel Sessions Schedule) Merak, Cendrawasih
Room, Lobby Level
15.30-16.00 Coffee Break
16.00-16.30 Closing Ceremony Awards Announcement and Photo Dirgantara Room,
Session 2nd Floor
ICACSIS 201-t
Table of Contents
Welcome Message from General Chairs
Welcome Message from Dean of Faculty of Computer Science University of Indonesia
111
Committees
v
Conference Information
1x
Program Schedule
x
Table of Contents
x111
Computer Networks, Architecture
&
High Performance Computing
Multicore Computation of Tactical Integration System in the Maritime Patrol Aircraft
using Intel Threading Building Block
Muhammad Faris Fathoni. Bambang Sridadi
lmmersive Virtual 3D Environment based on
499
fps Hand Gesture Interface
Muhammad Sakti Alvissalim
Improve fault tolerance in cell-based evolve hardware architecture
Chanin Wongyai
A New Patients' Rights Oriented Model of EMR Access Security
YB Dwi Setianto. Yustina Reino W. Utami
Element Extraction and Evaluation of Packaging Design using Computational Kansei
7
13
19
Engineering Approach
25
t。Qセヲゥォ@
Djatna. Fajar Munichputranto. Nina Hairiyah. Eljira Febriani
Integrated Information System Specification to Support SSTC
Ahmad Tamimi Fadhilah. Yudho Giri Sucahyo. Denny
A Real Time Simulation Model Of Production System Of Glycerol Ester With Self
Optimization
bran Aang Soenandi.
tュセヲゥォ@Djatna
33
39
ICACSIS 2014
Development of University of Indonesia Next Generation Firewall Prototype and
Access Control With Deep Packet Inspection
Harish Muhammad Nazief. Tonny Adhi Sabastian. A/fan Presekal. G/adhi Guarddin
Reliable Data Delivery Mechanism on Irrigation Monitoring System
Junaidy Budi Sanger, Heru Sukoco. Satyanto Saptomo
E-Government
Evaluation on People Aspect in Knowledge Management System Implementation : A
Case Study of Bank Indonesia
Handre Duriana, Ida Ayu Trisnanty. and Putu Wuri Handayani
Government Knowledge Management System Analysis: Case Study Badan
Kepegawaian Negara
Elin Cahyaningsih, Sofiyanti lndriasari. Pinkie Anggia, Dana Indra Sensuse.
Wahyu Catur Wibowo
Shared Service in E-Government Sector: Case Study of Implementation in Developed
Countries
Ravi/ca Hafizi, Suraya Miskon, Azizah Abdul Rahman
GIS-based DSS in e-Livestock Indonesia
Arie/ Ramadhan, Dana Indra Sensuse, Muhammad Octaviano Pratama. Vina
Ayumi. Aniati Murni Arymurthy
Influence Of Presidential Candidates E-Campaign Towards Voters In
2014
Presidential
45
51
55
65
73
81
J
Election In Republic Of Indonesia
87
Yani Nurhadryani, Anang Kurnia, lrsyad Satria
lnfonnation Security Risk Management Planning: A Case Study at Application Module
of State Asset Directorate General of State Asset Ministry of Finance
93
Sigit Prasetyo. Yudho Giri Sucahyo
Campaign
2.0:
Analysis of Social Media Utilization in
2014
Jakarta Legislative Election
99
v
Dean Apriana Ramadhan
ICACSIS 201-1
Towards Maturity Model for E-Govemment Implementation Based on Success Factors
I
05
Darmawan Baginda Napitupulu
The Critical Success Factors to Develop an Integrated
Application of Tuna Fishing Data Management in
Indonesia
Devi Fitrianah. Nursidik Heru Praptono. Achmad Nizar Hidayanto. Aniati Murni
Arymurthy
A Conceptual Paper on ICT as National Strategic Resources toward National
Competitiveness}{Basuki Yusuf lskandar and Fadhilah Mathar
Basuki Yusuf Jskandar and Fadhilah Mathar
Enterprise Computing
Quality Evaluation of Airline's E-Commerce Website, A Case Study of AirAsia and
Lion Air Websites
Farah Shafira Effendi, lka Aljina
Hotspot Clustering Using DBSCAN Algorithm and Shiny Web Framework
Karlina Khiyarin Nisa
Analysis of Trust Presence Within Commerce Websites: A Study of Indonesian
E-111
117
123
127
Commerce Websites
131
Muhammad Rifki Shihab. Sri Wahyuni. Ahmad Ni=ar Hidayanto
The Impact of Customer Knowledge Acquisition to Knowledge Management Benefits:
A Case Study in Indonesian Banking and Insurance Industries
137
Muhammad Rifki Shihab. Ajeng Anugrah Lestari
A System Analysis and Design for Sorghum Based Nano-Composite Film Production
143
Belladini LO\·e(l'.
t。コセヲゥォ@Djatna
Moving Towards PCI DSS 3.0 Compliance: A Case Study of Credit Card Data Security
Audit in an Online Payment Company
149
Muhammad Rifki Shihab. Febriana Misdianti
ICACSIS 2014
An Analysis and Design of Traceability In FrozenVanname Shrimp Product based on
Digital Business Ecosystem
155
Taufik Djatna and Aditia Ginantaka
Bayesian Rough Set Model in Hybrid Kansei Engineering for Beverage Packaging
Design
Azrifin•
1an and Taufik Djatna
Predicting Smart Home Lighting Behaviour from Sensors and User Input using Very
163
Fast Decision Tree with Kernel Density Estimation and Improved Laplace Correction
169
Ida Bagus Putu Peradnya Dina/a, and Bob Hardian
Visual Usability Design for Mobile Application Based On User Personality
175
J
Riva Aktivia, Taufik Djatna, and Yani Nurhadryani
Formal Method Software Engineering
Interaction between users and buildings: results of a multicreteria analysis
181
Audrey Bona and Jean-Marc Salo/Ii
Digital watermarking in audio for copyright protection
187
Hemis Mustapha and Boudraa Bachir
An Extension of Petri Network for Multi-Agent System Representation
193
Pierre Sauvage
Enhancing Reliability of Feature Modeling with Transforming Representation into
Abstract Behavioral Specification (ABS)
199
Muhammad lrfan Fadhillah
Making "Energy-saving Strategies": Using a Cue Offering Interface
205
Yasutaka Kishi. Ky oko Ito. and Shogo Nishida
Extending V-model practices to support SRE to build Secure Web Application
211
Ala Ali Abdulrazeg
ICACSIS 201-1
Social Network Analysis for People with Systemic Lupus Erythematosus using R4
Framework
Arin Karlina and Firman Ardiansyah
Experiences Using Z2SAL
Maria Ulfah Siregar. John Derrick, Siobhan North. and Anthony
J.H.
Simons
Information Retrieval
Relative Density Estimation using Self-Organizing Maps
Denny
217
223
231
Creating Bahasa Indonesian - Javanese Parallel Corpora Using Wikipedia Articles
237
Bayu Distiawan Trisedya
Classification of Campus E-Complaint Documents using Directed Acyclic Graph M_
ulti-Class SVM Based on Analytic Hierarchy Process
245
Imam Cholissodin. Maya Kurniawati, lndriati. and Issa An1•ani
Framework Model of Sustainable Supply Chain Risk for Dairy Agro industry Based on
Knowledge Base
Winnie Septiani. Marimin. Yeni Herdiyeni. and Liesbetini Haditjaroko
253
Physicians· Involvement in Social Media on Dissemination of Health Information
259
Pazd
Ibrahim Nainggolan
A Spatial Decision Tree based on Topological Relationships for Classifying Hotspot
Occurences in Bengkalis Riau Indonesia
265
Yaumil Miss Khoiriyah. and /mas Sukaesih Sitanggang
Shallow Parsing Natural Language Processing Implementation for Intelligent Automatic
Customer Service System
271
Ahmad Eries Antares. Adhi Ku.modi. and A'i Made San·ika l.nrari
SMOTE-Out. SMOTE-Cosine. and Selected-SMOTE: An Enhancement Strategy to
Handle Imbalance in Data Level
277
ICACSIS 2014
Fajri Kolo
Adaptive lnfonnation Extraction of Disaster Information from T\vitter
Ralph Vincent
J.
Regalado. Jenina
L.
Chua. Justin
L.
Co. Herman
C.
Cheng Jr ..
Angelo Bruce
L.
Magpantay. and Kristine Ma. Dominique
F.
Kal(ll1•
283
Citation Sentence Identification and Classification for Related Work Summarization
287
Dwi Hendratmo Widyantoro. and lmaduddin Amin
Experiments on Keyv.:ord List Generation By Term Distribution Clustering For Social
Media Data Classification
293
Wilson Fonda and Ayu Pun1•arianti
Tourism Recommendation Based on Vector Space Model and Social Recommender
Using Composite Social Media Extraction
299
/
Husnul Khotimah. Taujik Djatna. and Yani Nurhadryani
Leaming to Rank for Determining Relevant Document in Indonesian-English Cross
Language lnfonnation Retrieval using BM25
305
Syandra Sari and Mirna Adriani
Pattern Recognition
&
Image Processing
Forecasting the Length of the Rainy Season Using Time Delay Neural Network
Agus Buono. Muhammad Asyhar Agmalaro. and Amalia Fitranty Almira
Hybrid Sampling for Multiclass Imbalanced Problem: Case Study of Students'
Performance Prediction
Wanthanee Prachuabsupakij and Nuanwan Soonthornphisaj
Multi-Grid Transfonnation for Medical Image Registration
Porawat Visutsak
Model Prediction for Accreditation of Public Junior High School in Bogor Using Spatial
Decision Tree
Endang Purnama Giri and Aniati Murni A1J"111Urthy
311
317
323
329
ICACSIS 201-1
Application of Decision Tree Classifier for Single Nucleotide Polymorphism Discovery
from Next-Generation Sequencing Data
335
Muhammad Abrar Jsriadi, Wisnu Anania Kusuma. and I Made Tasma
\IAlternative Feature Extraction from Digitized Images of Dye Solutions as a Model for
Algal Bloom Remote Sensing
341
Roger Luis Uy. Joel Jlao. Eric Punzalan. and Prane Mariel Ong
Iris Localization using Gradient Magnitude and Fourier Descriptor
Stewart Sentanoe, Anro S Nugroho, Reggio N Harlono. Mohammad Uliniansyah,
and Meidy Layooari
Multiscale Fractal Dimension Modelling on Leaf Venation Topology Panern of
Indonesian Medicinal Plants
Aziz Rahmad, Yeni Herdiyeni, Agus Buono, and Stephane Douady
347
353
Fuzzy C-Means for Deforestration Identification Based on Remote Sensing Image
359
Selia Darmawan Afandi, Yeni Herdiyeni, and Lilik B Prasetyo
Quantitative Evaluation for Simple Segmentation SVM in Landscape Image
365
Endang Purnama Giri and Aniali Murni Arymurthy
Identification of Single Nucleotide Polymorphism using Support Vector Machine on
Imbalanced Data
371
Lai/an Sahrina Hasibuan
Development of Interaction and Orientation Method in Welding Simulator for Welding
Training Using Augmeneted Reality
377
Ario Sunar Baskoro. Mohammad A=irar Amal. and Randy Pangesru Kuswana
Tracking Efficiency Measurement of Dynamic Models on Geometric Particle Filter
using KLD-Resampling
381
Alexander A S Guna11'an. Wisnu ./a/miko. Veklor Delran/a.
F.Rachmadi. and
F.Jm·an
Nonlinearly Weighted Multiple Kernel Leaming for Time Series Forecasting
Agus Widodo. Indra Budi. and Belawali Widjaja
385
ICACSIS 201-1
Distortion Analysis of Hierarchical Mixing Technique on MPEG Surround Standard
391
lkhwana E/fitri. Mumuh Muharam , and Muhammad Shobirin
A Comparison of Backpropagation and L VQ : a case study of lung sound recognition
397
Fadhilah Syafria. Agus Buono, and Bib Paruhum Silalahi
ArcPSO: Ellipse Detection Method using Particle Swarm Optimization and Arc
Combination
Aprinaldi. lkhsanul Habibie. Robeth Rahmatullah. and A. Kurniawan
3D Virtual Pet Game ·'Moar" With Augmented Reality to Simulate Pet Raising
Scenario on Mobile Device
C/iffen Allen, Jeanny Pragantha. and Darius Andana Haris
Automatic Fetal Organs Segmentation Using Multilayer Super Pixel and Image Moment
Feature
R. Rahmatullah, M Anwar Masum, Aprinaldi,P. Mursanlo, B. Wiweko, and Herry
Integration of Smoke Dispersion Modeling with Earth's Surface Images
A. Sulaiman, M Sadly
403
409
415
423
Performance of Robust Two-dimensional Principal Component for Classification
429
Diah
E.
Heni
1indiati, Soni M Isa. and Janson Hendryli
Pareto Frontier Optimization in Soccer Simulation Using Normalized Normal
Constraint
Darius Andana Haris
Fully Unsupervised Clustering in Nonlinearly Separable Data Using Intelligent Kernel
K-Means
Teny Handayani and Ito Wasito
Robust Discriminant Analysis for Classification of Remote Sensing Data
Jt'ina. Dyah
E.
Hendndiati. and Sani
Af
Isa
Automatic Fetal Organs Detection and Approximation In Ultrasound Image Using
437
445
449
Boosting Classifier and Hough Transform
455
ICACSIS 201-1
M.
Amrar Ma'sum , Wisnu Jatmiko.
M.
Iqbal Tawakal. and Faris Al Afif
Particle Swarm Optimation based 2-Dimensional Randomized Hough Transform for
Fetal Head Biometry Detection and Approximation in Ultrasound Imaging
463
P11t11 Satwika. lkhsanul Habibie.
M.
Anwar .Ma'sum. Andreas Febrian. Enrico
Budianto
Digital Library
&Distance Learning
Gamified E-Leaming Model Based on Community of Inquiry
Andika Yudha Utomo, Ajifa Amriani. A/ham Fikri Aji, Farin Rohmah Nur
Wahidah. and Kasiyah
M.
Junus
Knowledge Management System Development with Evaluation Method in Lesson Study
469
Activity
4 77
Murein Miksa Mardhia. Annein ZR. Langi, and Yoanes Bandung
Designing Minahasa Toulour 3D Animation Movie as Part of Indonesian e-Cultural
Heritage and Natural History
483
Stanley Karouw
Leaming Content Personalization Based on Triple-Factor Learning Type Approach in
E-leaming
489
Mira Suryani, Harry Budi Santoso. and Zainal A. Hasibuan
Adaptation of Composite E-Leaming Contents for Reusable in Smartphone Based
Leaming System
497
Herman Tolle. Kohei Arai. and A1yo Pinandito
The Case Study of Using GIS as Instrument for Preserving Javanese Culture in a
Traditional Coastal Batik, Indonesia
503
Tji beng lap and Sri Tiatri
..
ICACSIS 2014
Fuzzy C-means for Deforestation Identification Based on Remote
Sensing Image
Setia Darmawan Afandi
1,Yeni Herdiyeni1, Lilik B Prasetyo
21
Department of Computer Science, Fakulty of Matmematics and Natural Science, Bogar Agricultural
University, West Java, Indonesia
2
Departement of Conservation of Forest Resources and Ecotourism, Faculty of Forestry, Bogar
Agricultural University, West Java, Indonesia
Email : sastra.afandi(a)gmail.com. [email protected]
Abstract- This research report about Fuzzy C-Means for Deforestation Identification Based On Remote Sensing Image. Deforestation means that changes forest area into another functions. Clustering is a method of classify objects into related groups (clusters). While, Fuzzy C-Means clustering is a technique that each data is determined by the degree of membership. In this research, the data used are MODIS EVI 250 m in 2000 and 2012 to identify deforestation rate in Java island. MODIS EVI is one of kind MODIS image which is able to detect vegetation based on photosynthesis rate and vegetation density. The number of clusters used were 13 clusters. This research had succeeded to classify areas based on the value of EVI like areas who had a high EVI values (forests, plantations, grass land), moderate values (agricultural area), and low values (build up area, mining area, pond, and other land cover). But, EVI value is only influenced by photosynthesis rate and vegetation density. Thus, EVI value is not well to identify forest areas. this is because the value of EVI in forest areas are almost same with plantations, savanna, etc.
L INTRODUCTION
Indonesia is one of many countries that has the greatest potential forest in the world. According to Indonesian forestry ministry in 2011 , Indonesia has 98.8 million hectares forest area. But on the other hand. the facts show Indonesian forests are very alarming shrinkage. It is caused by changing forest areas into another functions , like industrials. residences, plantation, mining area etc . it is also called deforestation . Deforestation rate period 1985 - 1997 recorded 1.6 million hectares per year. Meanwhile. in 1997 - 2000 recorded 3.8 million hectares per year. The details of the rate of deforestation in Indonesia can be seen in Figure I.
Under these conditions. forest monitoring is very important in forest management and determine how severe deforestation rate in Indonesia . Forest monitoring process has many methods . Forest monitoring using field measurement system spent more time and more cost. So. other methods are needed that are faster. cheaper and more efficient.
" '
'·'
05
- \cllwW - •• - e - Oo..- l.l**t f "l tt...1:1111 _ _ O. ... ••i.anKut.11tUl. J
Fig. I . Deforestation rate in Indonesia
Development of a system which can detect deforestation rate using remote sensing is one method to monitoring forest that can provide information quickly and accurately. Moderate Resolution Imaging Spectroradiometer Enhanced Vegetation Index (MODIS EVI) is used in this research. Why MODIS data used in this research? . Because MODIS data has a good spectral resolution and consists of 36 channels, having 3 temporal resolution, that are 250 m, 500 · m and I 000 m and MODIS data is available every day, so we can develop a real time system for the future.
Some related research such as research which conducted by Setiawan. In that research , the authors performed classifying existing vegetations in the area of the Java island in 2000-2009 based on spectral differences reflected from every object in the image by using the k-means clustering with accuracy rate of 80.16% [ I ]. That research was further developed in 2013 to identify rate of change in forest cover which includes deforestation and reforestation in java island in 2000-2009 with the accuracy of 50.34% [ 2 ]. While in this research, focused to analyzes deforestation rate in the java island in 2000 and 2012 by using Fuzzy C-Means clustering method .
II. R EM OTE SENS ING AN D l\IODIS EV I
Remote sensing is a technique for obtaining information about an object. area. or phenomenon through the anal ysis of data obtained from de vices that are not directl y in contact with the object. area. or phenomenon .. being observed [ 3 ]. Moderate Imaging Spectroradiometer (MODIS) is one ty pe of data from satellite images. MODIS data ha ve real visibility for 2330 km and avail able every I or 2 days. Data MODIS has 36 spectral band s and has 3 spatial
[image:20.603.6.584.35.643.2]ICACSIS 2014
resolution, those are 250 m, 500 m, and 1000 m. With these specifications, the MODIS data are able to provide much information about the state of the earth's
surface, ocean, and atmosphere [ 4 ].
Vegetation indices is the result obtained from some combination band (wavelength) of image and has a relationship to the characteristics of pixels that contained in an image. Vegetation indices derived from wave energy emitted by vegetation in remote sensing image to show the size and amount of plant life. EVI is one of the transformations obtained from the comparison of reflectance red channel, blue channel, and near infrared sensor MODIS [ 3 ]. The formula of the EVI is
. .
EVl=G
•
ーLLセMpイ・、N@
(l+L)
P11ir+C1p,.,,d-C2Pbiue+L
(I)where, p• nir, p· red and p· blue are the remote sensing
reflectances in the near-infrared, red and blue,
respectively, L is a soil adjustment factor and Ct and
C1 describe the use of the blue band in correction of
the red band for atmospheric aerosol scattering. The
coefficients, Ct, C2 and L, are empirically determined
as 6.0, 7.5 and 1.0, respectively. G is a gain factor set
to 2.5 [ 6 ].
EVI value is strongly influenced by the rate of photosynthesis and the density of vegetation in an area. This is because, the vegetation will reflect near infrared and green waves and absorbs red and blue wave. if we see from the formula of EVI that has been described previously. If the vegetation in an area are
very high . p• nir will has high value. Meanwhile p• red
and p• blue will have low value. So, it will make EVI
value will be very high.
III. Fuzzy C-MEANS (FCM)
The Fuzzy C-Means (FCM) algorithm is a clustering algorithm developed by Dunn, and later on improved
by Bezdek. It is useful when the required number of
clusters are pre-determined. Thus, the algorithm tries to put each of the data points to one of the clusters. What makes FCM different is that it does not decide the absolute membership of a data point to a given cluster. Instead , it calculates the likelihood (the degree of membership) that a data point will belong to that cluster. The algorithm of the Fuzzy C-means clustering
IS
I. Set the partition matrix セQヲH」I@ randomly
2. Set the value ofw> I (ex: w = 2)
3. Set the value of the correction factor with a
very small value (ex: Eps = 0.0 I)
4. Set the maximum iterations (ex: 500
iterations)
5. Set the initial value of the objecti\'e
(P _t (c)) randomly
6. Add iteration: t = t - I
7. Calculate the center ofwctors:
8. Modify the membership \alue :
9 . Modify the partition matrix
I 0. Calculate the objecti\'e function :
.v c
Pt(c)
=L LC.u1:.:)""
l}k -
i'/:I:
k=t 1=1 (4)
11. Check the stop condition
IV. Ml'TllOD
Study Area
The island of Java is located on the southern rim of the Indonesian archipelago and comprises an area of
132 792 km2. Fore st a I location covers about 19°
o
ofarea. which consist of 1916964 ha of production forest
(12.74 % ). 650 619 ha of protected forest HT NSRセ ᄋ ッIN@ and
442.188 ha of conservation forest (2.94%) [ 7 ]. Regarding to the statistical data of Indonesia [ 8 ].
Java comprises only 7° o of the total land area of
Indonesia. however. Java ·s population accounts for 70% of the total population of Ind o nesia or I 026 inhabitants per km2. The distribution of these allocation s areas is shown in Figure 2
•··
セMセ MMM ]セM
セ@,
• -
.
.
...
. 'セ@
MM ᄋセ M MGMセ
N@
Mᄋ ᄋM MM セB
M セᄋMᄋセN@
Data th at used in this re search \1a s the[\'! \!ODIS
satellite data in 2000 and 2012 that had hccn in th e I(,.
day 」Pューョセゥエ」 N@ Thi s data \IJS ()h ta incd from nne nfthc
NAS ,\ \1ch \1hi ch ca n he dP\\11l0adcd for free .I CJ 1
Methods
Thi s research cPn,ist' pf SC\ era I step'> : () ;11 ;1
Acquisiti Pn. l'rep ()Ce<-.,ing Daw. Im age h ·;J111rc·
360
JS ll:\ Qjャセ M cjャAj M ャ@ Ill -:.!:.! -·..
ICACSIS 2014
Reduction. Clustering, and Evaluation. The flow of this research can be seen in Figure 3
Land Ho| ᄋ⦅ セイ@
G Z ゥウQQセi@ 、。セゥヲゥ」。エゥッョ@ Data Acquisition Clustering (Fuzzv C-mean) Evaluation
Fig. 3. Research flow
Data Acquisition
The data used is MODIS EV! (MOD13QI) [ 9 ]. File extension is HOF. MOD13QI is one of the data generated by NASA for the vegetation index. This data is provided every 16 days with a spatial resolution of 250m. In this research, the analyzed area is Java island with data period in 2000 and 2012 . To get an overall image of Java island requires 2 data HDF. So, it takes 46 data in a year.
Preprocessing data
At this step, it does not need to change the pixel values into EV! values, because MOD13QI already automatically have the value of EVI. The data have been downloaded from the NASA website with HOF extension. it will be converted into GEOTIFF using MODIS Reprojection Tools (MRT). The next step, the image is cropped in order to produce the image area of Java island only. Then, combine 23 images into one image in a year using average composite. Average composite is the process of taking the average value of each pixel from some images data. So, from 46 data used will be generated into 2 images data .
Image Feature Reduction
The next step, reducing image feature based on wavelet method .. In addition to reducing image feature . wavelet can also reduce noises in the image and reduce execution time in clustering . The type of wavelet used in this research is Haar wavelet level I and level 2.
Clustering
Clustering process in this research using Fuzzy C-Means (FCM). Clustering process will classify forest and non-forest areas based on the value of the EVI. To
361
determine forest and non-forest areas of the clustering results based on data from visual classification of Land cover. After the specified area of forest and non-forest, then the data will be compared with data in 2012 and 2000 to get the area deforested.
Evaluation
The evaluation process in this result is to compare
the results of this research with data from visual
classification of Land cover .
V . RESULT
Data acquisition
Data had been taken by downloading MODIS EV! that were obtained from NASA's official website which can be downloaded for free [ 9 ]. The code of data used in this research is MOD 13Q I H28-V29 and H29-V29 with coverage of the java island . There were 86 data had been dowloaded in this research which were consist of 40 data in 2000 and 46 data in 2012 . Total of data size were 5.56 GB with HDF extension file
Preprocessing data
At this step, data were converted from HDF into GEOTIFF using MODIS Reprojection Tools (MRT). Conversion process was used UTM projection type and scale of I pixel: 250 meters. The conversion process produced images that were 20 images in 2000 and 23 image in 2012 with the image dimensions of 9711 x450 I . This image covered an area of the Java
island and some parts of the Borneo and Sumatra island. The next process was crop-ped image in order to get the image of the Java island only. Cropping process had been done by using OpenCV in order to produce data accurately and equally in every image.
Cropping process produced an image that had 4229x 1385 dimensions . Next process, image pixel value in a year were averaged to produce I image in 2000 and I image in 2012 . This process was due to the EV! value in agricultural areas is very volatile. Thus, in the growing season, the value of EV! in agricultural areas have a very high value, almost like EV! values in the forest area. Meanwhile, when the harvest season agricultural area has a fairly low EVI values. So: average composite was done to anticipate the detection of agricultural areas as forest area .
Image Feature Reduction
Reduction process was done to reduce the computational time on the clustering process. Image
reduction process in this research using the
h。セイ@
wavelet method. Wavelet can also reduce noise in the image. Wavelet had been processed until level 2. Thus. the resulting image with dimensions 2114 x 692 at level I and 1057 x 346 at level 2.
ICACSIS 2014
Clustering
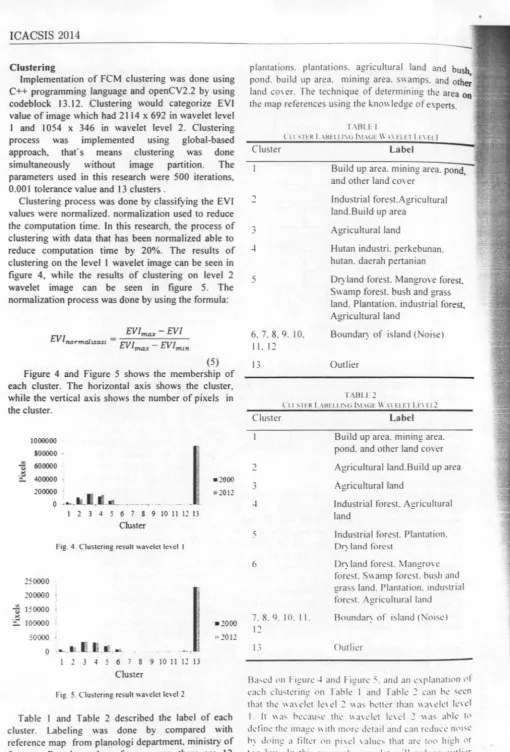
Implementation of FCM clustering was done using C++ programming language and openCV2.2 by using codeblock 13.12. Clustering would categorize EVI value of image which had 2114 x 692 in wavelet level 1 and 1054 x 346 in wavelet level 2. Clustering process was implemented using global-based approach, that's means clustering was done simultaneously without image part1t1on. The parameters used in this research were 500 iterations, 0.001 tolerance value and 13 clusters .
Clustering process was done by classifying the EVI values were normalized. normalization used to reduce the computation time. In this research, the process of clustering with data that has been normalized able to reduce computation time by 20%. The results of clustering on the level 1 wavelet image can be seen in figure 4, while the results of clustering on level 2 wavelet image can be seen in figure 5. The normalization process was done by using the formula:
EV/max- EV/ EVlnorrnalisasi =EV/ _EV/ _
m a x min
(5) Figure 4 and Figure 5 shows the membership of each cluster. The horizontal axis shows the cluster, while the vertical axis shows the number of pixels m
the cluster.
1000000
800000
-{i 600000 .
·:.: 400000
-200000 .
0 .... .... ..,.
I 2 3 4 5 6 7 8 9 10 II 12 13
Cluster
Fig . 4 . Clustering result wavelet level I
250000
200000 I
セ@ 150000
.... セ@
100000
50000 J
O , .._ _I L . . _..,. _ . . . _ . - ,
I 2 3 4 5 6 7 8 9 10 11 12 13
Cluster
Fig . 5. Clustering result wavelet level 2
•2000
• 2012
•2000
" 2012
Table I and Table 2 described the label of each cluster. Labeling was done by compared with reference map from planologi department, ministry of forestry. Based on the reference map there are 12 areas, those are dryland forest, mangrove forest , swamp forest, bush and grass land, industrial forest
3Gl
plantati ons. plantations. agricultural land and bush, pond. build up area. mining area. swamps. and other land cowr. The technique of determining the area on the map references using the knO\\·ledge of experts.
T.-\131.E I
l"i .L >;TER I. l!J HLl'u j|ャセ ge@ || M セ|eャNet@ l.1-1 FL )
Cluster Label
2 3
5
6. 7. 8. 9. 10.
I I. 12
13
Build up area. mining area. pond, and other land CO\er
Industrial forest.Agr icultural land.Build up area
Agricultural land
Hutan industri . perkebunan. hutan . daerah pertanian
Dryland forest. Mangro,·e forest. Swamp forest. bush and grass land. Plantation. industrial forest, Agricultural land
Boundary of island (Noise)
Outlier
T/\lll.I '. 2
l'l 1 ;; I ER I. ·lllll.l 1:-;t; 1\1.-l uE \\ "_.\ IEl.E I I.El U .2
Cluster
2 3
6
7. 8. 9. I 0. IL
12
13
Label
Build up area. mining area. pond . and other land cover
Agricultural land.Build up area
Agricultural land
Industrial forest. Agricultural land
Indu strial forest. Plantation. Dryland forest
Dry land forest. Mangro' e forest. Swamp forest. bu sh and grass land. Plantation. indu stri al forest. Agricultural land
Boundaf") of island (Noise l
Outlier
Ba,cd \1 11 Figure 4 and Figure :'.and an c.xplanation 11f each clustering nn Tahlc I and Table 2 can he seen that the 11a1clct lei el 2 11as better than 11 a\elc t lc1el I. It 11 as hccau"c the 11<11clct icHI 2 11as able t0
define the image 11 ith nwre detail and can reduce 1wi"e
ィセ@ dl1ing a tilter Pn pixel 1 aluc ' th at arc ton high M
lP\1 1(111 . In エィゥセ@ イャᄋセ」セイ」ィN@ 11;1\elct 11ill reduce nutlil'r
イ」ァゥQQQQセ@ and ャ キ オョ、。イセ@ rcgi\1n' nfthc ゥセャ。ョjN@
[image:23.608.67.578.8.761.2]t ..,
ICACSIS 2014
Another advantage of wavelet in this research were able to reduce the computational time with very significant in clustering process. In the original image, the computational time on clustering process more or less for 360 minutes . Meanwhile the image of the wavelet level I and level 2 were for 120 minutes and 30 minutes. It can be concluded that the wavelet level I and level 2 can reduce the computational time for 240 minutes (66%) and 330 minutes (91%)
If we look at Table 2, there were some clusters that had the same label such as the agricultural and industrial forest areas. It was because the type of agricultural area that had many variations such as dryland farming, wetlands farming , and others. Besides that, differences in period of each plant can made differences m EVI values significantly. Meanwhile, the industrial forest was heavily influenced during growth, harvest and post-harvest period. When the post-harvest period EVI value was very low. It was because there were no photosynthetic that occurs because vegetation was not there anymore . Meanwhile, when the growth period , the value of EVI was very high because the plant had a very high rate of photosynthesis.
On the other hand, there was a cluster defined in several different areas such as cluster 6 was defined as a dryland forest, mangrove forest, swamp forest, industrial forest ,plantations, agricultural land , bush and grass land . it was because the areas had same rate of photosynthesis value and density of vegetation value . So the areas were defined in the same cluster
Table 3 described range of EVI value for each cluster. It was seen that, the outliers had the highest value . It was because the representation of value in the MOD13QI was 16 bits with a value of 65 536 as outlier. While EVI values was defined from 0 to I 0 000. The boundary area(Noise) had EVI value from 120 - 253 . Noise occured because when the average composite, EVI value of the boundary island were averaged with outlier values. So, boundary area had a very high value .
While cluster 6 was a cluster that had a very high EVI values, followed by cluster 5, cluster 4, cluster 3, cluster 2, and cluster I . As described previously, the EVI value was determined by photosynthesis rate and vegetation density. It can be concluded that cluster 6 had a high photosynthesi s rate and vegetation density very much. Whereas in cluster I are defined as Build up area, mining area. pond. and other land cover that had a little vegetation.
Cluster
TAB LE 3
EV I VALL"E I:\ E\"E R y 」オ Z セit r@
Label EVI value
(degree of membership)
Build up area. mining I (I) - 34 (0.43) area. pond . and other
land cove r
363
2
3 4 5 6 7,8,9,10, 11 ,
12
13
Agricultural land,Build up area
Agricultural land
Industrial forest, Agricultural land
Industrial forest , Plantation, Dryland forest
Dryland forest, Mangrove forest , Swamp forest, bush and grass land, Plantation, industrial forest, Agricultural land
Boundary of island (Noise)
Outlier
35 (0.45) - 47 (0.6)
48 (0 .53)- 56 (0.66)
57 (0.83)- 63 (0.85)
64(0.9)-71 (0.9)
72 (0.9)- 89 (0.9)
120 (0.9)- 253 (0.9)
254(1)-255(1)
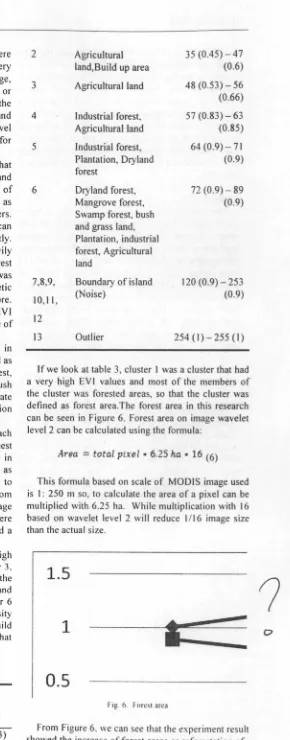
lfwe look at table 3, cluster I was a cluster that had a very high EVI values and most of the members of the cluster was forested areas, so that the cluster was defined as forest area.The forest area in this research can be seen in Figure 6. Forest area on image wavelet levei 2 can be calculated using the formula :
Area
=
total pixel • 6.25 ha • 16 (6)This formula based on scale of MODIS image used is I : 250 m so, to calculate the area of a pixel can be multiplied with 6.25 ha. While multiplication with 16 based on wavelet le vel 2 will reduce 1/ 16 image size than the actual size.
1.5
1
0.5
f'ig . 6. fo rest area
From Figure 6, we can see that the experim ent result showed the increase o f fore st areas or reforestation of 214 700 ha . Meanwhile. referen ce showed the decrease of forest area o r de forestat ion of 165 392 .60
ISB N : 07R-fl7C)-1J? 1-??:;
1
[image:24.603.286.576.23.763.2]ICACSIS 2014
ha. This d ifference was happened because the EV! value just depends on the photosynthesis rate and vegetation density. Thus, the forest area which was defined in this research covers dryland forest, mangrove forest, swamp forest, industrial forest ,plantations, agricultural land, bush and grass land that had EV! values are almost same. In the reference, swamp forest, grass land and plantations areas had expanded . On the other hand, industrial forest area had been detected as a forest in this research had been also increased.
Evaluation
This research had successed to classify areas based on the value of EV! such as the area that had high EV! values (forests, plantations, grass land), medium (agricultural land ), and low EV! value (Build up area, mining area, pond, and other land cover) . But, EV! value was only influenced by the rate of photosynthesis and vegetation density. Thus, it was difficult to detect areas in more detail. For example, forest areas were detected in cluster I with other areas such as mangrove forest, swamp forest, industrial forest, plantations, agricultural land, bush and grass land . In addition, the forest area was also detected in cluster 2 with industrial forest and plantation area
VI. CONCLUSION
This research had successed to classify areas based on the value of EV! such as the area that had high EVI values (forests, plantations, grass land), medium (agricultural land }, and low EVf value (Build up area, mining area, pond, and other land cover). But, EV! value was only influenced by the rate of photosynthesis and vegetation dens ity. Thus, it was difficult to detect areas in more detail.
VII. REFERENCES
[I] Setiawan et al , Characterizing Temporal Vegetation Dy namics of land Use in Regional Scale of Java Island, Indonesia , J.Land Use Sci.iFirst, 1-30, 2011
[2] Setiawan et al , Characterizing the Dy namics Change of Vegetation Cover on tropical Foret/ands Using 250 m multi- temporal MOD!S EV!, 2013 .
[3] Lillesand, thomas M, Ralph W.Kiefer, Remote Sensing and Image Interpretation, Canada :
John
Wiley & Sons, Inc , 1979[4] Schowengerdt, Robert A, Remote Sensing (Third Edition) :Models and Methods for Image Processing. United state of America: Elsevier Inc, 2006
[5] Duda,Richard 0 et al, Pattern Clasification Second Edition , New York: John Wiley & Son, 2001
[6] Huete, A.R., Liu, H.Q., Batchily, K., and Van Leeuwen, W, " A Comparison of Vegetation Indices over a Global Set of TM Images for EOS-MODIS," Remote Sensing of Environment,
59, 440-451,1997.
[7] Ministry ofForestry, 2008 . Recalculation of land cover in Indonesia 2008 , The Agencyof Forestry Planning, Department of Forestry, Republic of Indonesia.
{8] BPS-Statistics of Indonesia, 2003 . Statistics of Indonesia 2003. The Indonesian Cen-traf Agency on Statistics, BPS. Indonesia.
[9] National Aeronautics and Space Administration. (2013 , Feb 14). MODl3QI [online] . Available : ftp ://ladsweb .nascom .nasa .gov/allData/5 /MOD 13 QI /
36-1
ISBN : 978-979-1-1 21-22:"•