CONFERENCE COMMITTEE
Coordinator : Yandra Arkeman, Dr. M.Eng
(Departement of Agroindustrial Technology, IPB) Co-Coordinator : Nastiti Siswi Indrasti, Prof. Dr. Ir.
(Head of Departemen of Agroindustrial Technology, IPB)
International Experts:
1. Kenneth De Jong, Prof.
(George Mason University, Fairfax, Virginia, USA) 2. Kim Bryceson, Prof.
(School of Agriculture and Food Science , University of Queensland, Australia)
3. Haruhiro Fujita, Prof.
(Department of Information Systems, Niigata University for International and Information Studies Japan)
4. Gajendran Kandamsany, Dr. (United Kingdom)
5. Noel Lindsay, Prof. (University of Adelaide, Australia)
Committee Members from IPB: 1. Kudang Boro Seminar, Prof.
(Departement of Mechanical & Bio-system Engineering, IPB) 2. Marimin, Prof.
(Departement of Agroindustrial Technology, IPB) 3. Endang Gumbira Said, Prof.
(Departement of Agroindustrial Technology, IPB) 4. Suprihatin, Prof.
(Secretary of Departement of Agroindustrial Technology, IPB) 5. Ono Suparno, Prof.
(Departement of Agroindustrial Technology, IPB) 6. Agus Buono, Dr.
(Head of Department of Computer Science, IPB)
PROCEEDINGS
2
ndInternational Conference on Adaptive and Intelligent Agroindustry (ICAIA)
September 16 – 17, 2013, IPB International Convention Center
Bogor – Indonesia
Organized by :
WELCOMING ADDRESS
Prof. Dr. Ir. Nastiti Siswi Indrasti
Head of Agroindustrial Technology Department Faculty of Agricultural Engineering and Technology
Bogor Agricultural University
On
Second International Conference on Adaptive and Intelligence Agroindustry (2nd ICAIA)
Bogor, September, 16 – 17, 2013
Assalamu’alaikum Warohmatullahi Wabarokatuh In the name of Allah, the beneficent and the merciful,
Distinguish Guest, Ladies and Gentlemen
Let me first thank you all for accepting the invitation to participate in this 2nd International Conference on Adaptive and Intelligence Agroindustry (ICAIA). In particular I would like to thank Rector of IPB (Institut Pertanian Bogor/Bogor Agricultural University) Prof. Herry Suhardiyanto for supporting this event as part of the series academic event in celebrating the 50th Anniversary of Bogor Agricultural University.
In fact, the idea of organizing this conference was the continuation of the International Workshop on Computational Intelligence and Supercomputing Technology for Adaptive Agroindustry held by the Department of Agroindustrial Technology, Bogor Agricultural University last year.
Professor Kenneth A De Jong from George Mason University, US has successfully conducted joint international research with some staff from the Department of Agroindustrial Technology and Department of Computer Science, Bogor Agricultural University. The research aims to develop an integrated and intelligent system (namely SMART-TIN©) for the design of adaptive agroindustrial system in order to achieve a sustainable agroindustry that can mitigate global climate change and at the same time secure food, water, energy and natural medicine supply.
We are certainly proud to have been able to assemble this event in IPB, Bogor. The range of participants and audience at this conference is precisely something I would like to stress. The main goal of the conference is to provide an effective forum for distinguished speakers, academicians, professional and practitioners coming from universities, research institutions, government agencies and industries to share or exchange their ideas, experience and recent progress in Adaptive and Intelligent Agroindustry.
Distinguish Guest, Ladies and Gentlement,
Global climate change is the most challenging problems for us today and in the near future. This global change in our climate can lead to the shortage of the food, water, bioenergy and natural medicine that will affect the quality of human life. Many studies indicate that the threat of food, water, bioenergy and natural medicine crisis due to global climate change still worries our society. This problem can be solved by the development of agroindustry, i.e. an interrelated value chain entities from farming, to agro-processing industry and then to the end-customers. In fact, the design of agroindustry is complex and involves many factors and large data bases and more importantly, needs a good intelligence to process data and information to good decisions. Therefore, the way to design and manage agroindustry should be improved in order to meet the design objectives.
Agroindustries consume quite significant amount of energy on one side, on the other side they generate sizable amount of industrial wastes and its utilization as a captive energy resource is a kind of potential. Based on our study, a plywood industry with the production capacity of 200.000 m3/year could generate 32 percentage of solid waste. If this amount of waste used as an energy alternative, it may result on the saving of 131.037.768.597 rupiah per month. Similar to plywood industry, sugarcane industry with the production capacity of 480 ton per hour could generate 154 ton per hour of waste (bagasse) and this amount of waste contribute to the saving of energy consuming by 19.250 Kwh. Recent study we conducted, indicated that cassava starch industry may contribute to a significant amount of waste. It has also potential usage as an energy resource. Based on our study the conversion of its waste into energy will contribute to the saving of energy usage of 4100 liter biogas per ton material.
reduced. The new, incremental energy contributions that can be obtained from waste biomass will depend on future government policies, on the rates of fossils fuel depletion, and on extrinsic and intrinsic economic factors, as well as the availability of specific residues in areas where they can be collected and utilized. All of these factors should be in detail examined to evaluate the development of the industrial waste contribution. Hope this conference will also discuss this issue in more detail as it is an important matter for all of us. We should no more think just how to produce high value product but it is also necessarily important how to keep our live in good quality by understanding following old saying…” only when the last tree has been cut, only when the last fish has been angled, and only when the last river has been polluted, then we realized that we could not eat money”.
I do not to take up any more of your time with these opening remarks. Let me simply thank you once again for sharing your thoughts with us. Here’s wishing every success for the conference. May Allah bless all of us.
Thank you for your kind attention,
AGENDA of
2
ndInternational Conference on Adaptive and Intelligent Agroindustry
(ICAIA)
Time Activities Room
Day 1 (16 September 2013)
08.00 – 09.00
Welcoming Address: Prof. NastitiSiswiIndrasti (Head of Dept TIN, Fateta, IPB)
Conference Opening: Prof. HerrySuhardiyanto(Rector of IPB)
o ABET Certification announcement and short ceremony o Launching International Double Degree Master Program in
Innovation and Technopreneurship in Cooperation with University of Adelaide, Australia
o Soft-launching Master in Logistik Agroindustri (Agroindustrial
Logistics)
Ballroom
10.00 – 10.45 (45’)
Opening Speeches:
Prof. IrawadiJamaran (Agroindustry Guru, IPB: 25’) Prof. Eriyatno (Industrial and System Engineering, IPB: 20’)
Ballroom
Session 1 10.45 – 11.15
(30’)
Keynote Speech Dr. YandraArkeman (IPB) Ballroom
11.15 – 12.00 (45’)
Keynote Speech Prof. Kenneth De Jong (George Mason University, USA) Ballroom
12.00 – 13.30
Moderator: Prof. EndangGumbiraSa’id (IPB) Invited Speakers (1-4) (4 x 20 minutes) Discussion (25 minutes)
Tentative Schedule: Prof. Kim Bryceson (Australia), Prof. SyamsulMa’arif (IPB), Prof. KudangBoro Seminar (IPB), Prof. HaruhiroFujita (Japan)
Ballroom
Moderator: Prof. Marimin (IPB) Invited Speakers (5-8) (4 x 20 minutes) Discussion (25 minutes)
Tentative Schedule: Dr. Gajendran (UK), Prof. Noel Lindsay (University of Adelaide), Dr. KuncoroHartoWidodo (UGM), Prof. UtomoSarjonoPutro (ITB)
Ballroom
Day 2 (17 September 2013) 08.00 – 08.30
(30’)
Registration
08.30 – 10.15 (105’)
Moderator: Prof. KudangBoro Seminar (IPB) Invited Speakers (9-12) (4 x 20 minutes) Discussion (25 minutes)
Prof. Egum (IPB), Prof. Marimin (IPB), Dr. AgusBuono (IPB), Dr. HeruSukoco (IPB) 10.15 – 10.30
12.30 – 13.30 (60’)
Lunch Break
13.30 – 15.00 (90’)
Open Discussion (Open Forum) with Prof. Kenneth De Jong
Topic: Foundations and Applications of Genetic/Evolutionary Algorithms
Ballroom
15.00 – 15.30 (30’)
Conference Closing Ballroom
15.30 – 17.00 (90’)
Indonesian Agroindustry Association (AGRIN) National Congress (PIC: Prof. Suprihatin)
Ballroom
17.00 – 17.45 (45’)
CONTENT LIST
Conference Committee
Welcoming Address ….……….………... i
Agenda of 2nd ICAIA 2013... iii
Content List …………..………...………... v
A. SMART-TIN© : An Integrated And Intelligent System For The Design Of
Adaptive Agroindustry (A Conceptual Framework) (Yandra Arkeman)
1‐9.
B. GHG Emission Reduction By Waste Cooking Oil Recycling In Environmental Partnership Program Of Bogor City (Haruhiro Fujita, Atsushi Yoshimoto, Katsuyuki Nakano, Koji Okuhara, Noriaki Koide, Dadang Supriatna)
10‐16.
C. Challenge of Indonesian Logistics Infrastructure for Perishables Products (Kuncoro Hartoto Widodo, Yandra Rahardian Perdana, Joewono Soemardjito)
17‐28.
D. Design Of Grouping Traditional Market Distribution Using Fuzzy Clustering And Design of Routing of Packaging Cooking Oil From Distribution Center To Traditional Market Using Traveling Salesperson Problem– Genetic Algorithm in Indonesia (Case‐Jakarta) (Teja Primawati Utami, Syamsul Maarif, Yandra Arkeman, Liesbetini Hartoto)
29‐43.
E. Determining the degree of product rightness at the conceptual stage:A Case of the Low Cost Green Car (Ade Febransyah, Fransisca Tharia)
44‐53.
F. Co‐Composting Process Of Bagasse And Sludge From Sugarcane Industry With Influence Of Difference Initial C/N Value And Aeration (Andes Ismayana, Nastiti Siswi Indrasti, Tori Sane)
54‐62.
G. Analysis Of The Competitiveness Of The Agribusiness Sector Companies Using Porter's Five Forces (M. Hudori)
63‐72.
H. Design And Optimization Of Agro‐Scm For Food And Energy Security In Indonesia (Hoetomo Lembito, Kudang Boro Seminar, Nunung Kusnadi, Yandra Arkeman)
73‐83.
I. Construction Of Patchouli Oil’s Price In West Java : A Structural Equation Model (Isti Surjandari, Alan Dwi Wibowo, Erlinda Muslim, Nurwan Nugraha)
84‐90.
J. Optimization Vehicle Routing Problem With Cross Entropy Method And Branch & Bound Algorithm (Iwan Aang Soenardi, Budi Marpaung)
91‐99.
K. Design And Optimization Of Agro‐Scm For Food And Energy A Remote Monitoring System Of Broilers’ Behavior In A Multi‐Agent Broiler Closed House System (K.B. Seminar, R. Afnan, M. Solahudin, Supriyanto, A.K. Wijayanto, M.Z. Arifin, A. Fatikunnada)
100‐112.
L. Artificial Neural Network Model Based Capacitance Dielectric For Crackers Self‐ Life Prediction (Erna Rusliana Muhamaad Saleh, Erliza Noor, Taufik Djatna, Irzaman)
113‐121.
M. Characterizing Temporal Dynamic Of Weather Variability To Support Decision Making On Weed Control (Rizky Mulya Sampurno, Kudang B. Seminar, Yuli Suharnoto, Mohamad Solahudin)
N. Risk Management Model in Dairy Product Transportation With Fuzzy Logic Approach (Winnie Septiani, Yandra Arkeman)
131‐141.
O. Strategy to Increase Institutional Capacity of Farmer Groups to Support the Transportation System Agroindustry Products (Zulfiandri, Yandra Arkeman)
142‐156.
P. Adsorption Of Carotenoid From Palm Oil Methyl Ester By Using Attapulgite And Synthetic Silica Magnesium As Adsorbent (Sapta Raharja, Prayoga Suryadarma, Zuni Fitriyantini)
157‐163.
Q. High Accuracy Agroindustry Environment Monitoring System Based on Photonic Crystal Sensor Network (Mamat Rahmat, Muhamad Azis, Erus Rustami, Wenny Maulina, Kudang Boro Seminar, Arief Sabdo Yuwono, Husin Alatas)
164‐174.
R. Study on Effect ofTemperatureIncrease on the Productivity of Methanefrom POME Fermentation (Sarono, E. Gumbira Said, Ono Suparno, Suprihatin, Udin Hasanudin)
175‐180.
S. The Design and Implementation of Geographic Information Systems to Support Food and Energy Security (Arif Purnomo Muji Basuki, Yandra Arkeman, Musthofa)
181‐191.
T. Study Of White Crystal Sugar Distribution System In Indonesia (Suripto, Yandra Arkeman)
192‐199.
U. Corncob Biodelignification Process Using White Rot Fungi (Liesbetini Hartoto, Purwoko, Elis Nina Herliyana, Cucu Rina Purwaningrum)
200‐212.
V. Color Stability of Beet Dyes Label During Heating (Endang Warsiki, Asih Setiautami)
213‐219.
W Precipitation Classification Using LVQ on Dry Season Base on Global Climate Indices Case Study in Indramayu District (Indra Kelana Jaya, Agus Buono, Yandra Arkeman)
220‐225.
X. Wood Identification Type By Using Support Vector Mechine‐Based Image (A.A. Gede Rai Gunawan, Sri Nurdiati, Yandra Arkeman)
226‐232.
Y. Fuzzy Logic Systems and Applications in Agro‐industrial Engineering and Technology (Marimin, Mushthofa)
233‐241.
Design And Optimization Of Agro-Scm For Food And Energy Security
In Indonesia
Hoetomo Lembito
Doctor in Management and Business, Bogor Agricultural Institute (IPB)
Kudang Boro Seminar
Lecturer of Bogor Agricultural Institute (IPB)
Nunung Kusnadi
Lecturer of Bogor Agricultural Institute (IPB)
Yandra Arkeman
Lecturer of Bogor Agricultural Institute (IPB)
ABSTRACT
World palm oil consumption has significantly increased over the years. Palm oil is one of the world's most produced and consumed oils. This cheap, production-efficient and highly stable oil is used in a wide variety of food, cosmetic and hygiene products, and can be used as source for bio-fuel or biodiesel. Global palm oil production is dominated by Indonesia and Malaysia. These two countries together account for around 85 to 90 percent of total global palm oil production. Indonesia is currently the largest producer and exporter of palm oil worldwide.Indonesia has scored a significant achievement on oil palm development by becoming the biggest palm-oil-producing country in the world, both in terms of plantation area and in total national production of palm oil. Crude Palm Oil (CPO) is a commodity which has a strategic value to be developed for Indonesian economy. On the long term, global palm oil demand shows an increasing trend as an expanding global population gives rise to increased consumption of palm-oil based products.This fast-paced growth of the CPO production and the increase of world CPO demand have necessitated extensive supply chains across the country to facilitate sourcing and distribution of production. The purpose of this paper is to design, construct and simulate a model to capture the structure of CPO supply chain system in order to predict demand and supply, production, revenue and cost, with the ultimate purpose of optimizing the potential growth CPO agro-industries for food and energy security in Indonesia The system dynamic model can be deployed to simulate and optimized some pattern of selected components. Model validations were done to improve fitness of the model.
Keywords: supply chain, system dynamic, crude palm oil
1. INTRODUCTION
1.1. Global Demand Growth for Palm Oil
The oil palm, Elaeis guineensis Jacq. is indigenous to West Africa where the main palm belt
Palm oil is the most traded vegetable oil crop in the world. Palm oil used in a vast range of everyday products and traditionally used in manufactured food products, it is an increasingly important ingredient in cosmetic / health products, and is now found in >50% of packaged supermarket products. Palm oil is also the most productive vegetable oil, producing around 10 times more oil per ha than its nearest competitor soybean, and there is a growing demand for its use in bio-diesel and electricity production. (PWC, 2013). Worldwide demand for palm oil has skyrocketed over the past 25 years, and oil palm plantations now cover an area of 11 million hectares. Global demand for palm oil is therefore expected to continue to grow strongly. Indeed, the World Bank forecasts that an additional 6.3 million ha of palm oil plantations will be required to meet global demands by 2020. Much of this land is expected to be in Indonesia which, together with Malaysia, already accounts for around 90% of the world’s palm oil exports. In Indonesia, the area covered by oil palm plantations has reached almost 6 million hectares with the production is the biggest in the world. During the last decade, the palm oil industry in Indonesia has been developing rapidly, and has close to doubled in size (4.2million ha in 2000 increased to 8.0 million ha in 2010).
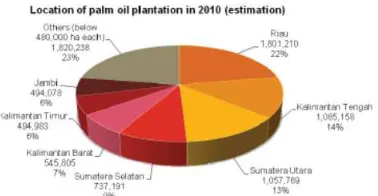
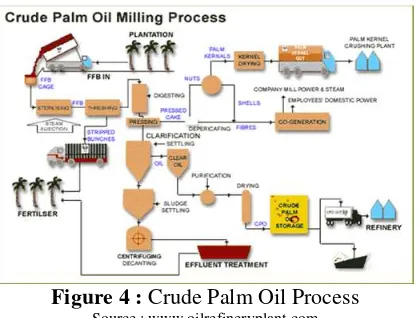
In Indonesia, oil palm plantations have been progressively developed since 1980s. The palm oil industry in Sumatra and Kalimantan islands has gown rapidly since 1980, and yet it has not transformed itself into to a strong agribusiness system (Pahan, 2012). Agribusiness system was an approach which integrated raw material purchasing (upstream agro-industry), the activity of primary production (on farm), manufacturing process (downstream agro-industry), marketing, and supporting institutions such as financing, land agency, research and development within one system. Oil palm plantation produces raw material in the form of fresh fruit bunches (FFB) that were processed in the palm oil mill to become semi-goods namely crude palm oil (CPO) and palm kernel oil (PKO). Semi-goods are further processed to become finished goods (edible and non-edible) at downstream manufacturing industry to give financial added value. Palm oil export’s contribution to Indonesia economy in the year 2010 was USD 16.4 billions.
Figure 2: Global Palm Oil Demand 1970-2010 and Avg. Increase in Production Source :USDA 2010
A significant change in the palm oil industry has taken place during the past season, as Indonesia surpassed Malaysia in the production of palm oil to become the current world leader. Indonesia is the biggest CPO producer in the world, accounting for 47 percent of world production. The countries produced 18 million tons of CPO from 7.9 million hectares of plantations in 2008, and produced 22 million tons in 2009 and produced 23.6 million tons in 2010. Malaysia, currently the second-biggest CPO producer, may see its production from 17.7 million tons in 2009 to 18.2 millions in year 2010.
Figure 3 : Indonesian and Malaysia Palm Oil Production Source: USDA, 2012
The Indonesian palm oil Industry has grown very fast and significantly recently. By 2007, planted area and production had increased to 23 and 24.5 times compared to their level in 1980 respectively, and planted area’s growth rate on average 11% from 1980 to 2007, while the production growth on average is 13% per annum. Seventy percent of palm oil production in Indonesia is exported. As a result, the export market contributes important role in the growth of the palm oil industry. By 2007, palm oil export had increased to 23.6 times compare to its level in 1980, with an average growth rate of 28% in terms of quantity and 27% in terms of value annually. (James, 2007)
1.2. Agro-SCM
There have been major changes in the agro supply chain of energy and food products over the last decades. A more liberalized international trade system, globalization and the transition towards a consumer driven market have empowered this development
involved in, and affected by, global issues such as food security (driven by increased food demand from growing and more prosperous populations) and energy security (driven by the impacts of the global financial crisis, oil price volatility, and over dependency on fossil fuel) It will require both an increase in yields and more plantations. Much of the required land should be taken from existing stocks of degraded land, but if this is poorly planned and/or ill-managed, it could have serious consequences for the environmental and social capital of the country.
Supply chain is a typical complex, adaptive, and dynamic system with nonlinearities, delays, and networked feedback loops. So it is very difficult for supply chain professionals to clearly understand supply chain operational mechanisms and thus make appropriate decisions within the limited time to adapt to the ever-changing, competitive, and turbulent business environment.
2. METHODOLOGY
which is expecting to increase performance through service effectiveness and cost efficiency can do it in two ways, namely (1) Reducing the barrier of supply chain integration, and (2) Increasing facilitation of supply chain integration (Richey et. al, 2010). The objective of supply chain integration (of key business processes among a network of interdependent suppliers, plantation, processor , and marketers in order to improve the flow of goods, services, and information from original suppliers to final customers), is reducing system-wide costs while maintaining the required service levels. The supply chain systems in this research focus on 3 sub-model. Production Sub-model (Plantation and Mill). Demand and Supply Sub-model (Domestic and Export Market) and Revenue and Cost Sub-Model (Sales Revenue, Production Cost, Logistics Cost). By understanding the supply chain system in CPO Agro-industry we can analyze the system by using Causal Loop Diagram (CLD) and Stock Flow Diagram (SFD).
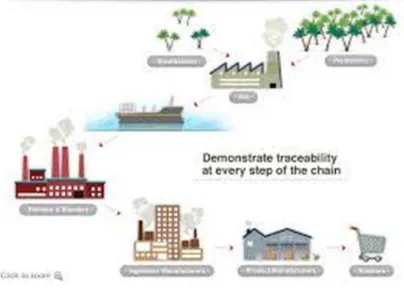
Figure 5 : Palm Oil Supply Chain Source : RSPO
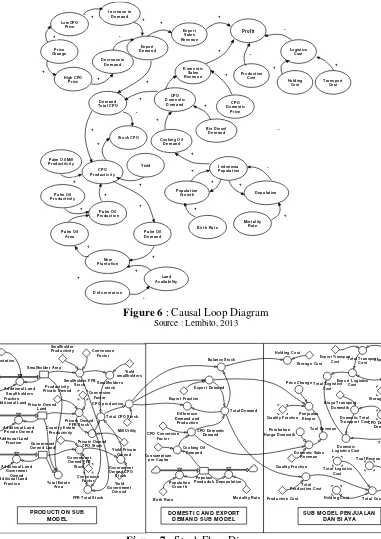
2.2. Analyzing with CLD and SFD
There are two structural ways to analyze any system dynamics: CLD and stock and flow diagram SFD. CLD diagrams can be used to show the governing inter-relations among a number of different variables using feedback loops. A positive feedback loop means the dependent variable moves in the same direction as that of the independent variable; as such, the polarities are assigned as a plus (+) sign on the arrowhead of feedback loops. In the case of negative feedback loops, if the independent variable increases, the dependent variable decreases and vice versa. Thus a minus (–) sign is assigned to the arrowhead of the feedback loop.
Figure 6 : Causal Loop Diagram Source : Lembito, 2013
Pr ofit
environment, and scientific systems. We adopted Powersim Studio 2005 because it allows us to model the major variables – stocks, rates,
auxiliaries, flows and constant of CPO business processs – in the workspace, and connected with arrows. For each variable a number or equation has to be defined. Powersim is a flow-diagram-based modeling tool, which is able to show multiple models simultaneously and connecr separate models to each other.
2.4. Validating the Model
Model validation was undertaken by using the Mean Absolute Error (MAE) technique is applied to assess the overall reliability of each model.In statistic the mean absolute error (MAE) is a quantity used to measure how close forecasts or predictions are to the eventual outcomes. MAE depends upon the units in which the variable is expressed. (Hyndman R, Koehler A. 2006). The magnitudes of the error give any indication of how large the error is, therefore, this error can be assessed only by comparing it with the average size of the variable in question. However, the main advantage of MAE is that it can be decomposed into various components, which show the deviation between the simulated and actual values.
The mean absolute error is an average of the absolute errors ei = | fi – yi |, where fi is the prediction and yi is the true value
2.5. Data Sources and Descriptions
In general, two groups of data were used in this study, namely, palm oil and macro-economic related data. The data sources for CPO included Oil world, 2010, USDA 2010, Indonesia Central Bureau of statistics (BPS) 2010 and palm oil outlook statistics 2010. Macro-economic related data were got from Ministry of Agriculture and BPS, 2010. The data covered the period from 2000 to 2010 hence the analysis was on the yearly basis interval.
3. RESULTS
3.1.CPO Production Sub-model
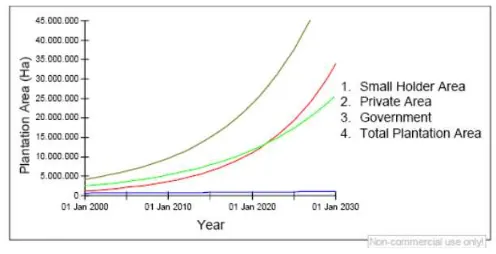
We capture the growth of plantation area from 3 plantation owner (small holder, private owned and government owned) from the year 2000 to 2010. From the data we analyze the annual growth rate of small holders, private owned and government owned to be is 12%, 8% and 2% (BPS, 2010). And from computer simulation we can predict the growth will continue for another 20 years, with the assumption there is no barrier in preparing the plantation area. In year 2030 the total area will be around 42 millions hectares around 5 times of total compare to area in year 2010. (Lembito, 2013)
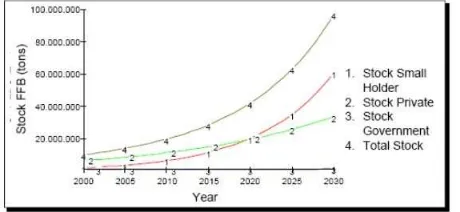
The production of Fresh Fruit Bunches (FFB) with the fraction of production around 15-17 tons per hectare will also grown significantly. The production of FFB in small holders in year 2010 was 7 millions tons, private owned was 12 millions tons and government owned was 1.5 millions tons. From computer simulation we can predict that the FFB production from small holder in year 2030 is around 61 millions tons, private owned is around 34 millions tons and government is around 1.7 tons millions. Total FFB production is around 97 millions ton. We assumed oil extraction rate of CPO is 20% and palm oil mill productivity rate is 90%. (Lembito, 2013).In the short term, it seems that land expansion will remain the main strategy increasing CPO production capacity. In the medium term, the trend of industry integration will increase, along with the growth of downstream industry for oleochemicals and biofuel. (PWC, 2013)
Figure 9 : Growth of FFB Production Source: Lembito, 2013
3.2.CPO Demand and Supply Sub-model
From the data we analyzed from year 2000-2010, we calculate the total demand domestic demand and export demand. The computation the domestic demand mainly come from the assumption of cooking oil with an average 9 kgs/capita/year cooking oil or equal to 13.5 kgs CPO capita/year. From BPS we find the Indonesan population around 237 millions in year 2010 with the birth rate is 0.011 and dead rate is 0.007 (Kuncoro, 2011). The export demand on year 2010 around 12.8 millions tons of CPO and domestic demand around 3.2 millions tons. With the computer simulation we can predict the demand in year 2030. The Export demand will be around 60 millions tons and domestic will be around 5 millions tons, and the estimated production will be around 80 millions ton . This means that Indonesia can increase the export market since there will be enough stock to sell. And Indonesia will have to handle competition from other country producers especially that of Malaysia.
Figure 10 : Growth of CPO Production and Demand (Domestic + Export) Source : Lembito, 2013
3.3.CPO Revenue and Cost Sub-model
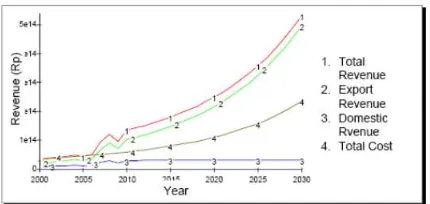
From the yearly price both in Domestic Market price and export market (CIF Rotterdam), the CPO price per ton in year 2000 was Rp. 2 millions domestically, while the CIF Rotterdam price was USD 311. In year 2010 the export price was around US$ 900, slightly going down compared to the price in year 2008 which was US$ 948. (USDA, 2010). The price drop is due to world economic crisis in year 2008. The production cost was estimated USD 400 per ton and we assumed the logistics cost of USD 60- USD 80 per ton. From the computer simulation we can predict the total revenue for Indonesia Palm Oil Industry is around in year 2030 to be around USD 53 billions or more than 3 times larger than that of the year 2010. And the gross profit excluding export tax seems promising still. (Lembito, 2013)
Figure 11 : Total Revenue and Total Cost Source : Lembito, 2013
3.4.Model Validation
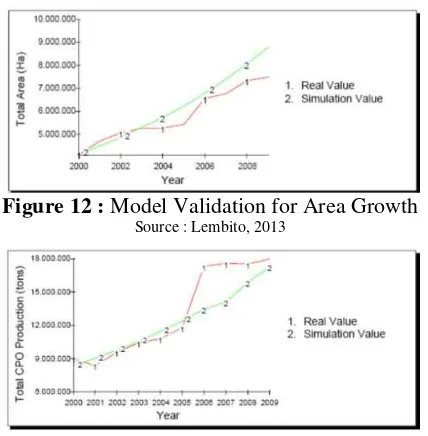
Figure 12 : Model Validation for Area Growth Source : Lembito, 2013
Figure 13 : Model Validation for Production Growth Source : Lembito, 2013
4. CONCLUSION
A supply chain is the connected series of value activities concerned with the planning and controlling of raw materials, components and finished products from suppliers to the final customers. Supply chain management provides an opportunity to the firms to look beyond their own organization and collaborate with the value chain partners for the mutual benefits. System dynamics considers the causal relationships among variables and through simulation permits the evaluation of such impact on the operating performance of whole supply chain.
In the practical application this research developing of the System Dynamic model for analyzing the Supply Chain Model would be important especially for production and export of Indonesian CPO Agro-industries. CPO which increases progressively since year 2000 to 2010 is one of the main export commodity for Indonesia. The existing CPO production growth and high growth of domestic consumption and export market since year 2000 to year 2010, based on simulation model the growth will continue to 2030.
to predict some aspects of its behavior, such as plantations area growth, CPO production growth, demand and price fluctuations, with the purpose of optimizing the potential growth of CPO and challenges faced by of CPO agro-industries in Indonesia. For food and energy security.
REFERENCES
[1] Agarwal A, Shankar R. .2005. Modeling supply chain performance variables, Asian Academy of
Management Journal 10(2): 47-68.
[2] Statistik Indonesia. 2010. Badan Pusat Statistik.
[3] Campuzano F, Mula J. 2011. Supply chain simulation: A system dynamics approach for improving
performance, Springer.
[4] Christopher M. 2005. Logistics and Supply Chain Management: Strategies for Reducing Cost and
Improving Service, Prentice-Hall, London.
[5] Colin B, Zachary Z, RIA G. 2003. The Indonesian Oil Palm Industry
[6] Forrester JW. 1961. Industrial Dynamics. Portland (OR): Productivity Press.
[7] Hyndman R, Koehler A. 2006. Another look at measures of forecast accuracy. Journal of
Forecast-ing 22(4), 679–688
[8] James C. 2007 Indonesia Palm Oil Productions Prospect Continue to grow, Commodity Inteligence
Report, USDA Foreign Agricultural Service
[9] Kuncoro HW, Kharies P, Aang A. 2011. Supply Chain Management Agro Industri yang Berkelanjutan.
Lubuk Agung. Bandung
[10] Kotzab, H. 1999, Improving supply chain performance by Efficient Consumer Response .A critical comparison of existing ECR-approaches, Journal of Business and Industrial Marketing, Vol. 14, No. 5/6, pp. 364-377.
[11] Lembito. H. 2010. Extended Enterprise Resources Planning (ERP) for Palm Oil Industry, in proceeding of AFITA World Conference , The Quality Information for Competitive the Agricultural Based Production System and Commerce, Bogor, 2010
[12] Lembito. H. 2012. Achieving Competitive Advantage for Agribusiness through Supply Chain Management: A System Dynamics Simulation and SCOR model Approach, in proceedings of AFITA World Conference on Computers in Agriculture. Taipei. Taiwan. September 3-6, 2012
[13] Lembito. H. 2013 Designing A Supply Chain System Dynamic Model for Palm Oil Agro Industries, International Journal of Information Technology and Business Management, Vol. 12. No. 1
[14] Outlook Komoditas Pertanian. 2010. Pusat Data dan Informasi Pertanian. Kementerian Pertanian [15] Pahan I. 2005. Panduan Lengkap Kelapa Sawit, Manajemen Agribisnis dari Hulu hingga Hilir, Jakarta,
Penebar Swadaya
[16] Pahan I. 2012. Development of Palm Oil Industrial Cluster in Indonesia, an Analytical Network Process Study, Saarbrucken. Deutschland. Lambert Academic Publishing
[17] PWC.2012.Palm Oil Plantation Industry landscape, regulatory and financial overview, 2012 update [18] Pandey V.C, Garg S. 2009. Analysis of interaction among the anablers of agility in supply chain.
Journal of advances in management research, 16:1, pp.99-114.
[19] Rahmadi.A, Lu Ye. 2003. Biodiesel from Palm Oil as an Alternative fuel for Indonesia: Opportunities and Challenges, International Tecnology Center, Melboune University
[21] Richey Jr. RG, Roath AS. Whipple JN, Fawcett SE. 2010. Exploring a governance theory of supply chain management: Barriers and facilitators to integration. J Bus Log.31 (1): 237-256.
[21] USDA Foreign Agricultural Service. 2010. Commodity Intelligence Report