DOI: 10.12928/TELKOMNIKA.v11i4.1390 749
Palmprint Verification Using Time Series Method
Agus Anwar*, Darma Putra, Agung Cahyawan Department of Information Technology, Udayana University Bukit Jimbaran, Badung, Bali, Indonesia, Telp. 0361-7853533
*Corresponding author, e-mail: [email protected], [email protected],
Abstrak
Penggunaan biometrik sebagai sistem pengenalan otomatis berkembang pesat dalam penyelesaian masalah keamanan. Salah satu yang sering digunakan adalah data telapak tangan. Penelitian ini menggunakan metode titik momen dua tahap untuk segmentasi region of interest (ROI) dan menerapkan metode runtun waktu yang dikombinasikan dengan metode block window sebagai representasi fitur. Normalized euclidean distance digunakan untuk mengukur kesamaan dua vektor fitur telapak tangan. Pengujian sistem verifikasi pada penelitian ini menggunakan 500 sampel citra telapak tangan, dengan 6 sampel sebagai citra uji dan 4 sampel sebagai citra acuan. Hasil pengujian menunjukan bahwa sistem menghasilkan unjuk kerja tinggi dengan tingkat keberhasilan mencapai 97,33% (FNMR=1,67 %, FMR=1,00 %, T=0,036).
Kata kunci: biometrik, verifikasi sistem, runtun waktu, metode block window, telapak tangan
Abstract
The use of biometrics as an automatic recognition system is growing rapidly in solving security problems; palmprint is one of biometric system which often used. This paper used two steps in center of mass moment method for region of interest (ROI) segmentation and apply the time series method combined with block window method as feature representation.Normalized Euclidean Distance is used to measure the similarity degrees of two feature vectors of palm print. System testing is done using 500 samples palms, with 4 samples as the reference image and the 6 samples as test images. Experiment results show this system can achieve a high performance with success rate about 97.33% (FNMR=1.67%, FMR=1.00 %, T=0.036).
Keywords: biometric, verification system, time series, block window method, palmprint
1. Introduction
The need for personal recognition system is automatically a reliable and trustworthy increasing mainly for security systems. Recognition system aims to solve a person’s identity. There are two types of recognition systems, the verification and identification systems. Verification system aims to accept or reject the claimed identity of a person, while the identification system aims to solve the identity.
Palmprint has several advantages compared to other available features: low-resolution images can be used, low cost capture devices can be used, it is very difficult or impossible to Cheat with palmprint because their characteristics are stable and unique [1]. Many approaches have been proposed for extract the palmprint features [1-11]. There are many unique features in a palmprint image that can be used for personal recognition, such us: geometry, principal lines, wrinkles, delta points and minutiae points [2].
2. Research Method
The verification process has four main stages there are image acquisition, preprocessing, feature extraction and matching. Overview of the verification process in this study can be seen in Figure 1. In general, a palmprint verification system consists of 4 modules is as follows:
1. Stages of image acquisition, a step to take biometric data such as the image of the palmprint from the hand.
2. Preprocessing is the stages to transform the original image into greyscale image, binary and ROI segmentation (region of interest) that use for feature extraction process.
3. Stages features extraction is the stages to determine the characteristic features of the segmentation that come from the value of tested ROI palmprints.
Matching stages, namely stages to determine the degree of similarity between tested biometric traits with biometric features that reference to the database, to decide whether the user is accepted or rejected based on matching of test score results.
2.1 Hand Image Acquisition
Palmprint images are captured using digital camera on smart phone Samsung Galaxy GT-S5830 with resolution of 640x480 pixels. Each person was requested to put his/her left hand palm down on with a black background (ten sample for each person). There are some pegs on the board to control the hand oriented, translation, and stretching as shown in Figure 2.
Grayscaling
2.2 Segmentation of Palmprint ROI
This paper used new technique to extract the ROI is called two steps in moment central method. The main principle of this method is to fix the location of the moment center which improves the palm center point location [1]. The first step is to determine the center point moments ( , ) in the binary image by using equation (1). Otsu method has been used to binary image [12]. Where ( , ) represents center of area is defined as Equation 1.
1
Where N represent number of pixels object. The centroid of the segmented binary image is computed and based on this centroid the ROI of grayscale palmprint image can be cropped with size 128x128 and 64x64 pixels.
2.3 Palmprint Normalization
The normalization process is needed to reduce the possible imperfections in the palmprint image due to non-uniform illumination [14]. The normalization method employed in this research using equation (2). Where I and I’ represent original grayscale palmprint image and the normalized image respectively, ϕ and ρ represents mean and variance of the original image repectively, while ϕd and ρd are the desired values for mean and variance respectively.
This research use ϕd = 175 and ρd = 175 for all experiments, and the results are shown in
Figure (3).
′ , , (2)
, (3)
a b c
Figure 3. (a, b, c) Normalization results with ϕd
= 175 and ρd = 175 Figure 4. Use Spiral as the Feature Sequence
Extraction Track
2.4 Palmprint Feature Extraction
For time series representation purpose, ROI squares is decomposed into sequential data. In this research we adopt a spiral as the track for decomposition. The polar equation of a spiral equation 4 [12].
(4)
Where a is set to 0.7. Features are extracted along the spiral (Figure 4). Many kinds of local textural features can be used here, such as intensity, variance, and cross correlation. In this paper, we use gray level intensity.
′ (5)
(a)
(b)
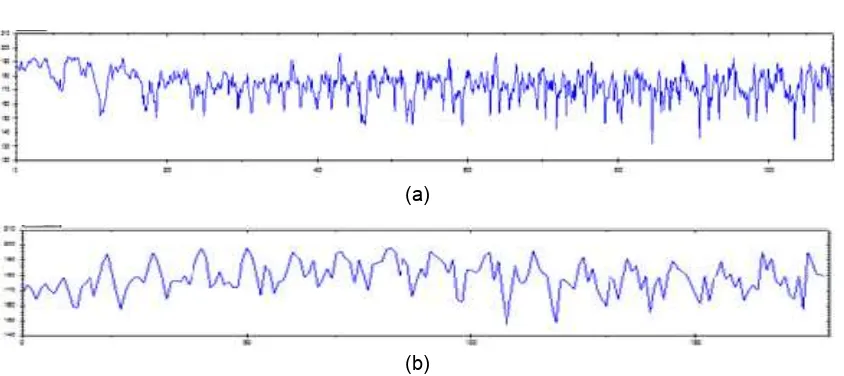
Figure 5. (a) Data Sequence of Feature Extraction, (b) Data Sequence of Feature Normlization with Block Window Method
2.5 Matching
Matching between the test image with the reference image using Normalized Euclidean Distance [14]:
̅ ,
̅
(6)‖ ‖
‖ ‖
(7)with u and v is a vector of traits characteristic of test images and the reference image. The smaller ̅ , score, the more similar two feature vectors are matched, otherwise the higher the score, the more different the two characteristic vectors. To determine whether the test is a valid image (genuine) or invalid (Imposter) used a threshold value. When the distance (score) is smaller than the threshold value then the user is said to be authorized, if larger then said unauthorized users.
3. Results and Analysis
Verification system which made about 500 images were tested using the palm of the hand belongs to 50 people, each person represented 10 sample images palms. Six of the 10 samples were used as test images, while 4 image used for the reference image. Testing the success rate of system verification is done by hand for value FMR (False Match Rate), FNMR (False Non Match Rate), and EER (Equal Error Rate). FMR is the matching error when the system is considered a different image with the reference image is a sample image of the participants belong to the same hand. FNMR is the matching error when the system assumes the same reference image with the sample image is the image of the hand belongs to a different participant. EER is the error rate when FNMR = FMR.
3.1 Number of Reference Test
This test is used to analyze accuracy of the system against the number of references that use in this system. Database size that used in this test is 50 participants with ROI 64x64 pixels and 128x128 pixels. Table 1 and 2 shows the result of this test.
Table 1. Number of reference test with ROI 64x64 pixels
Number of
Table 2. Number of reference test with ROI 128x128 pixels
Number of
Figure 6. System accuracy against number of reference
Table 1 and 2 can be presented with a chart as shown in Figur 6. Line with dot mark in Figure 6 shows system accuracy with ROI 64x64 pixels and line with triangle system accuracy with ROI 128x128 pixels. Figure 6 shows that the system accuracy increases along with the number of references in database.
3.2 Database Size Testing
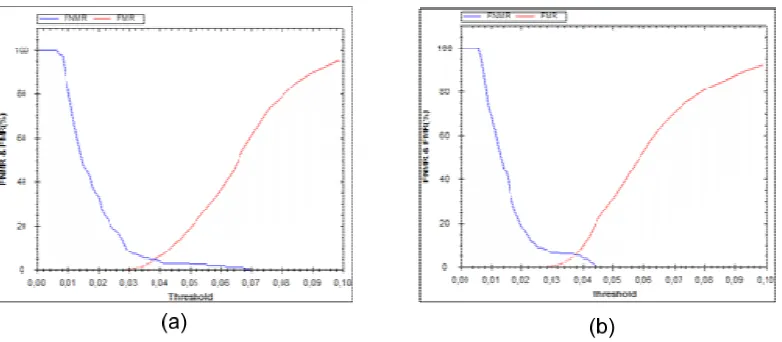
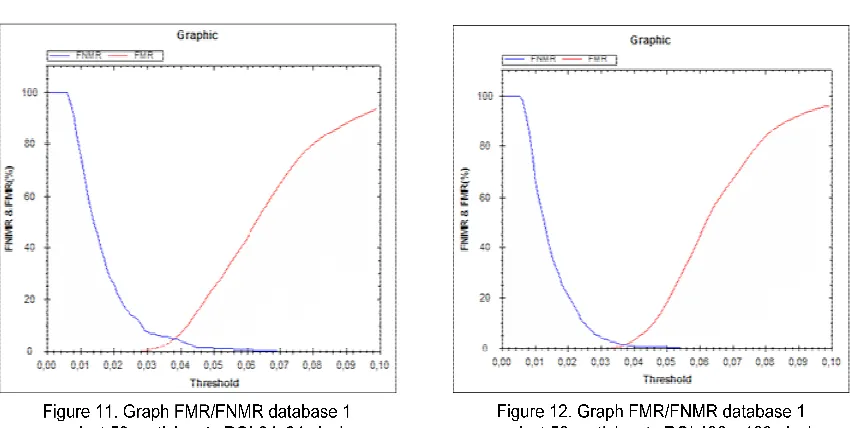
This test is using various database size, they are 15, 25 and 50 participants. The system was tested with 4 references. Result of this test is shown in figure 7 - 12 with the following note: FNMR is shown by a blue line and FMR is shown by a red line.
3.2.1 System accuracy against 15 participants
Figure 7. Graph FNMR/FMR against 15 participants ROI 64 x 64 (a) database 1, (b) database 2, (c) database 3
Figure 8. Graph FNMR/FMR against 15 participants ROI 128 x 128 (a) database 1, (b) database 2, (c) database 3
1. Testing the system on database 1. This test obtained that system accuracy with ROI 64x64 pixels is 96.51% at threshold value 0.035 with FNMR is 1.11% and FMR is 1.59% (Figure 7(a)). while the current test is using ROI 128x128 pixels, the system accuracy is 100% at treshold value 0.003 with FNMR 0% and FMR 0% (Figure 8(a)).
2. Testing the system on database 2. This test obtained that system accuracy with ROI 64x64 pixels is 91.82% at threshold value 0.031 with FNMR is 7.78% and FMR is 0.32% (Figure 7(b)). while the current test is using ROI 128x128 pixels, the system accuracy is 95.56% at treshold value 0.036 with FNMR 4.44% and FMR 0% (Figure 8(b)).
3. Testing the system on database 3. This test obtained that system accuracy with ROI 64x64 pixels is 91.26% at threshold value 0.033 with FNMR is 7.78% and FMR is 0.87% (Figure 7(c)). while the current test is using ROI 128x128 pixels, the system accuracy is 99.21% at treshold value 0.038 with FNMR 0% and FMR 0.79% (Figure 8(c)).
3.2.2 System accuracy against 25 participants
There are 2 database with 15 participants. Figure 9 and Figure 10 shows simulation system with 25 participants.
1. Testing the system on database 1. This test obtained that system accuracy with ROI 64x64 pixels is 82.58% at threshold value 0.035 with FNMR is 5.33 % and FMR is 2.08 % (Figure 9(a)). while the current test is using ROI 128x128 pixels, the system accuracy is 97.17% at treshold value 0.033 with FNMR 2.67% and FMR 0.17% (Figure 10(a)).
9(b)). while the current test is using ROI 128x128 pixels, the system accuracy is 98.17% at
treshold value 0.036with FNMR 0.67% and FMR 1.17% (Figure 10(b)).
Figure 9. Graph FNMR/FMR with 25 participants ROI 64 x 64 (a) database 1, (b) database 2
Figure 10. Graph FNMR/FMR against 25 participants ROI 128 x 128 (a) database 1, (b) database 2
3.2.3 System accuracy against 50 participants
There is 1 database with 50 participants. Figure 11 and Figure 12 shows simulation system with 50 participants.
Testing the system on database with 50 participants. This test obtained that system accuracy with ROI 64x64 pixels is 92.07% at threshold value 0.033 with FNMR is 6.33 % and FMR is 1.59 % (Figure 11). while the current test is using ROI 128x128 pixels, the system accuracy is 97.33%at treshold value 0.036 with FNMR 1.67 % and FMR 1.00 % (Figure 12).
3.2.4 Comparison of the accuracy system
Table 3. System performance with ROI 64x64 pixels on various database zise
Database size (in user)
DB Treshold FNMR FMR Accuracy Time
(second)
15 1 0.035 1.11 2.3 96.59 6.36
15 2 0.031 7.87 0.32 91.82 6.40
15 3 0.033 7.87 0.87 91.26 6.45
25 1 0.035 5.33 2.08 92.58 16.66
25 2 0.029 6.71 0.36 92.93 17.41
50 1 0.033 6.33 1.59 92.07 61.51
Table 3 shows the result an average accuracy of 92.87% with a maximum matching time on testing 50 participants is 61.51 seconds. Verification system can be said to be very fast matching of time less than 1 second on each participant.
Table 4. System performance with ROI 128x128 pixels on vaious database zise
Database size (in user)
DB Treshold FNMR FMR Accuracy Time
(second)
15 1 0.03 0 0 100 6.38
15 2 0.036 4.44 0 95.56 6.40
15 3 0.038 0 0.79 99.21 6.45
25 1 0.033 2.67 0.17 97.17 17.11
25 2 0.036 0.67 1.17 98.17 16.82
50 1 0.036 1.67 1 97.33 65.40
Table 4 shows the result an average accuracy of 97.90% with a maximum matching time on testing 50 participants is 65.40 seconds. Verification system can be said to be very fast matching of time less than 1 second on each participant.
Figure 13. Comparison of system accuracy
4. Conclusion
Based on the experimental results, the palmprints biometrics verification system has the best performance on the ROI of 128x128 pixels, proved value FNMR/FMR system is small or has a high degree of accuracy, with an accuracy of rate approximately 97.33% or FNMR=1.67% and FMR=1%. High performance obtained in this study is also due to the preparation process of the separation of the processing of palmprint with two steps in moment central method and image intensity normalization palms. The verification system is highly feasible to develop in the direction of an online system and applied to specific application fields, such as attendance systems applications, medical records application, security system applications, forensic applications, and other applications.
References
[1] I Ketut Gede Darma Putra, Erdiawan. High Performance Palmprint Identification System Based On
Two Dimensional Gabor. TELKOMNIKA Journal of Electrical Engineering. 2010; 8(3): 309-318.
[2] Shu W, Zhang D. Automated Personal Identification by Palmprint. Optical Engineering. 1998; 37(8):
2359 -2363.
[3] Wu X Q, Zhang D, Wang K Q. Fisherpalms Based Palmprint Recognition. Pattern Recognition Letters.
2003; 24: 2829-2838
[4] Kong W K, Zhang D, Li W. Palmprint Feature Extraction using 2-D Gabor Filters. Pattern Recognition.
2003; 36: 2339-2347.
[5] Wu X Q, Wang K Q, Zhang D. Wavelet Based Palmprint Recognition. Proceedings of the First
International Conference on Machine Learning and Cybernetics. 2002; 3: 1253- 1257.
[6] Li W, Zhang D, Xu Z. Palmprint Identification by Fourier Transform. International Journal of Pattern
Recognition Artificial Intelligence. 2002; 16 (4): 417-432.
[7] Zhang D, Shu W. Two Novel Characteritics in Palmprint Verification: Datum Point Invariance and Line
Feature Matching. Pattern Recognition. 1998; 32: 691-702.
[8] Liu G M, Zhang D, Wang K Q. Palmprint Recognition Using Eigenpalms Features. Pattern
Recognition Letters. 200. 24: 1463 – 1467.
[9] Duta N, Jain A K, Mardia K.V. Matching of Palmprint. Pattern Recognation Letters. 2002; 23: 477-485. [10] Wu X, Wand K, Zhang D. Fuzzy Directional Element Energy Feature (FDEEF) Based Palmprint
Identification. proceedings 16th International Conferences on pattern recognition,Quebec. 2002; 1: 95-98.
[11] I Ketut Darma Putra, Wira Bhuana, Erdiawan. Pembentukan Kode Telapak Tangan (Palm Code)
Berbasis Metode Gabor 2D. MAKARA Journal of Technology Serie. 2011; 15(2): 161-167.
[12] Jian Sheng Chen, Yiu Shang Moon, Hoi Wo Yeung. Palmprint Authentication Using Time Series.
Departement of Science and Engineering The Chinese University of Hongkong. 2005: 376-385. [13] Darma Putra. Binerisasi Citra Tangan dengan Metode Otsu. Teknologi Elektro. 2004; 3(2).
[14] Darma Putra. Sistem Verifikasi Menggunakan Garis-garis Telapak Tangan. Teknologi elektro. 2007;
80
[15] Dongging Z, Yubing H, Veuyu T. Nonlinear/Non-Gaussian Time Series Prediction Based on
RBF-HMM-GMM Model. TELKOMNIKA Indonesian Journal of Electrical Engineering. 2012;10(6):
1214-1226.