Dietary plant food and socioeconomic determinants of vitamin A status :
study in rural lactating woman during crisis in Central Java
Mohammad Sulchan, Satoto
Abstrak
Program jangka panjang, dengan “pendekatan berbasis pangan” untuk penanggulangan kekurangan vitamin A (KVA) semakin penting peranannya. Telah dilakukan penelitian dalam rangka Sistim Pemantauan Vitamin A di Jawa Tengah yang menghubungkan asupan vitamin A dengan kadar serum retinol pada ibu-ibu laktasi dengan Batita (anak bawah tiga tahun) selama krisis. Median asupan vitamin A 319 RE/d buta senja : 0,34%. Kadar serum retinol (rerata 1,23 mol/L) berhubungan dengan asupan vitamin A. model multiple logistic regresi untuk memprediksikan peluang terjadinya pengaruh berbagai faktor determinant menunjukkan : Asupan vitamin A dari pangan nabati (OR95% CI per quartile, 1st : 1.00, 2nd: 1,63 0,99-2,80, 3rd: 1,99 1,58-2,99, dan 4th: 2,62
1,68-4,04, dari pangan hewani (1st dan 2nd: 1,00. 3rd: 1,37 0,89-2,09 dan 4th: 2,86 1,59-3,98 ). Kebun gizi (tidak 1,00, ya 1,88
1,08-2,68 ) dan pendidikan ibu ( SD, sekolah lanjutan: 1,46 1,00-2,16 ). Kontribusi asupan vitamin A sumber nabati 16 kali lebih besar dibanding sumber hewani, sama pentingnya dalam mempengaruhi status vitamin A. Kebun gizi dan tingkat pendidikan ibu merefleksikan konsumsi pangan sumber nabati dan hewani dalam jangka panjang. (Med J Indones 2006; 15:259-66)
Abstract
For the Longer term food-based approaches for controlling vitamin A deficiency and its consequences, become increasingly important. A nutrition survailance system in Central-Java, Indonesia assessed vitamin A intake and serum retinol concentration of lactating women with a child 36 mo old during crisis. Median vitamin A intake was 319 RE/d and night blindness 0,34%. Serum retinol concentration (mean : 1,23 mol/L) was related to vitamin A intake in a dose-concentration manner. The multiple logistic regression model for predicting the chance for a serum retinol concentration > observed median of the population (1,27 mol/L) included determinant factors, vitamin A intake from plant foods (OR95% CI per quartile, 1st : 1.00, 2nd: 1,63 0,99-2,80, 3rd: 1,99 1,58-2,99, and 4th: 2,62
1,68-4,04, from, animal foods (1st and 2nd: 1,00. 3rd: 1,37 0,89-2,09 and 4th: 2,86 1,59-3,98 ). Homegardening (no 1,00, yes 1,88
1,08-2,68) and woman’s education level ( primary school : 1,00 secondary school : 1,46 1,00-2,16 ). Thus, although contributing 16 times more to total vitamin A intake plant foods were as important for vitamin A status as animal foods. Homegardening and woman’s education level seem to reflect longer-term consumption of plant and animal foods respectively. (Med J Indones 2006; 15:259-66) Keywords: Vitamin A intake, plant foods, animal foods, vitamin A status, homegardening, socio-economic status, crisis, Indonesia
The economic crisis which has gripped Indonesia since mid-1997 is fast turning into a crisis of health and nutrition. The ravaged economy now bares the sinister and potentially tragic – consequences of a sharply devaluated currency, high inflation, massive unemployment and the resulting decrease in consumer spending power. One particular micronutrient deficiency vitamin A deficiency (VAD) – is beginning to re-emerge as a threat to public health in Indonesia. VAD
can cause blindness and damage the immune system, resulting in increased risk of illness and death.1, 2
Indonesia before the crisis was one of the first developing countries to identify that its high levels of severe vitamin A deficiency (VAD) constituted a serious public health problem, and to begin implementing programs to eliminate this problem. The success of the government program lay in its implementation of both short-term and long-term strategies to reduce VAD. As a long-term measure against VAD, the government has focused on food-based strategies aimed at improving vitamin A status by increasing the consumption of vitamin A rich foods. Recent studies Department of Nutrition, Faculty of Medicine, Diponegoro
in Indonesia have shown that plant sources of vitamin A are less effective than animal sources in improving vitamin A status.
Many studies reported by vitamin A, child health and nutrition experts have proven the correlation between vitamin A status and child survival, child development and safe motherhood. Thus, to further improve the women health-nutritional status as well as the child health, development and nutritional status, the government of Indonesia intends to eliminate vitamin A deficiency by the end of REPELITA VI (6 th five-years development plan). In order to achieve the above commitment, 3 strategies are taken, i.e.: (1) improving mother and child services; (2) social marketing vitamin A rich foods; (3) monitoring and evaluation of the 2nd strategy followed by the 3rd strategy.
The effectiveness of food based programes should be evaluated by periodic of vitamin A intake, vitamin A status, and determinant factors morbidity and mortality and the relationship between these indicators. However, such an evaluation is limited by the fact that it has until now been very difficult to collect data on dietary vitamin A intake that are related to vitamin A status. One reason for that could be that the bioavailability of carotenoids from fruits and vegetables appears to be much lower than assumed. The consequence of this lower bioavailability would be that, until now, vitamin A intake from fruits and vegetables, but not of animal foods, has been overestimated. In that case, it would be important to distinguish between plant and animal food when collecting data on dietary vitamin A intake. Yet, the situation appears to be deteriorating as the economic crisis bites deeper into the pockets of the large majority of the population, as high inflation sends food prices skyrocket and mass lay-offs numbers of the economic below the poverty line.1, 2, 3
This study was conducted to investigate the vitamin A status, in rural lactating women, during economic crisis in Central Java. It was examine whether distinguishing between plant and animal sources of vitamin A improves the relationship between cross-sectional data on vitamin A intake and vitamin A
status from women with a child ≤36 mo old. Data -analysis is controlled for confounding factors socio-economic status and ownership of a homegarden.
METHODS
Subjects and Research Design
The study was carried out as a part of 2nd and 3th data collection of the central-Java nutrition surveillance system collected cross-sectional data on vitamin A status, socio-economic status, home gardening, food consumption vitamin A intake, anthropometry, breast-feeding, vitamin A capsule distribution and morbidity from a total of 7088 houseschoolds with a child ≤36 mo old. Using a multi-stage cluster design sampling of households was done Central Java consists of 6 ecological zones. Name if : Karesidenan Pati, Semarang, Surakarta, Kedu, Banyumas and Pekalongan. Probability proportional to size sampling from each zone, 30 villages were selected. Totally 180 villages from each
village a list of households with a child ≤36 mo old
was obtained. From this list by interval sampling, using a random start, 40 households were selected (n = 1838). Using random sampling from each zone, a subsample was selected for blood collection from the women and their for the measurement of serum retinol concentration. Written informed consent was obtained before blood collection.
Instrument
The general questionnaire information on demographic, socio-economic (educational background of the parent, occupation of main earner). home gardening livestock owned, household consumption of oil and coconut, and source, preparation and consumption of vegetables.
Antropometry
Weight was measured to the nearest 0,1 kg with a UNICEF mother and child weighing scale. Height was measured to the nearest 0,1 cm using microtoise. Mid-upper-arm circumference was measured to the nearest 1 mm with a measuring tape.
Vitamin A Intake
low-vitamin A plant foods (50 RE/100g). The low-vitamin A content was taken from Indonesian food composition tables. In addition to categorizing foods consumed based on their vitamin A content, information was also collected on the portion size: small (<25 g), medium (25-27 g) or large (>75 g). For calculating vitamin A intake, vitamin A content of the categories (RE/100 g) were set at 600 for high-and 150 for low-vitamin A animal foods, and at 600. 150 and 25 for high-, medium- and low-vitamin A plant foods, respectively. The size of the three portions, e.g, small, medium and large, were set at 20, 50 and 100 g, respectively.
Biochemical Parameters
Blood samples (±3 ml), were drawn from an antecubital vein between 8 – 12 am. Serum was stored at -20o C in the laboratory of Diponegoro University in Semarang until analysis of retinol at the Nutrition Research and Development Centre in Bogor. Analysis was done within 3 mo of blood collection, by HPLC (column. Bondapak C 18, Waters, Milford, MA, USA, detector, Shimadzu SPD-6AV, Tokyo, Japan, standards, Sigma, Solvent, Merch) with methanol/water (90/10 v/v) as mobile phase.14
Statistics
Parameters differences between groups were examined by analysis of variance, for normally distributed. For non-normally distributed parameters differences between groups were examined by the Kruskal-Wallis test for more than 2 groups and by the Mann-Whitney test for 2 groups. Spearman-rank-correlation coefficient were calculated to assess the association between nonnormally distributed parameters. Multiple logistic regression analysis was used determine which factors were most important for predicting whether a women had a serum retinol concentration above the observed median value of the population for those factor, odds ratios are reported with 95% CI. A p-value <0,05 was considered significant. All analysis were conducted using SPSS for windows version 10.0 (SPSS Inc, Chicago, Illinois)
RESULTS
From the 1838 women selected for blood collection, 720 provided a blood sample. Data are reported for the 720 women for whom complete data available.
Table 1. Characteristics of lactating women with a child
36 months old (n 720)
Age (y)1 287±67
Age of child (mo)1 19.1± 8.9
Education primary school 69.5
> primary school 30.3
Height (m)1
1.47±0.05
Weight (kg)1 47.9±7.8
Body mass index (kg/m2)2 198 (18.8 - 25.7)
Mid-upper-arm circumference (cm)2 228±26
Exclusive Breast Feeding (%) 14.3
Serum retinol (mol/L)1 1.21±037
Night blindness (%) 0.34
Vitamin A From plant foods (RE/d)2 340 (28 - 778)
Vitamin A From animal foods (RE/d)2 22 (0 - 130)
Total dietary vitamin A intake (RE/d)2 319 (60 - 844) Proportion of vitamin A from plant foods (%)2 939 (37 - 100)
Proportion of vitamin A from animal foods (%)2 61 (0 - 63)
1 mean ± SD
2 median (10 - 90 percentiles)
Table 1 shows the basic characteristics of women M.U.A. circumference (cm) was 22,8. body mass index (kg/m2) was < 18.5 for 15% and >27 for 5% of the women. Mean serum retinol concentration was
1.21 μmol/L, while median dietary vitamin A intake was 319 RE/d. vegetables and fruits provided 93,9 and animal foods 6,1% of dietary vitamin A intake.
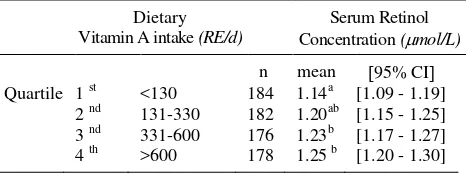
Table 2. Serum retinol concentration for quartile of dietary vitamin A intake
Dietary Vitamin A intake (RE/d)
Serum Retinol Concentration (mol/L)
n mean 95% CI
Quartile 1 st <130 184 1.14a [1.09 - 1.19]
2 nd 131-330 182 1.20ab [1.15 - 1.25]
3 nd 331-600 176 1.23b [1.17 - 1.27]
4 th >600 178 1.25 b [1.20 - 1.30]
Table 2 shows that there was a dose-responsive relationship between dietary vitamin A intake and serum retinol concentration. The Spearman-rank-correlation between vitamin A intake and serum retinol concentration was 0,16 (p> 0,001)
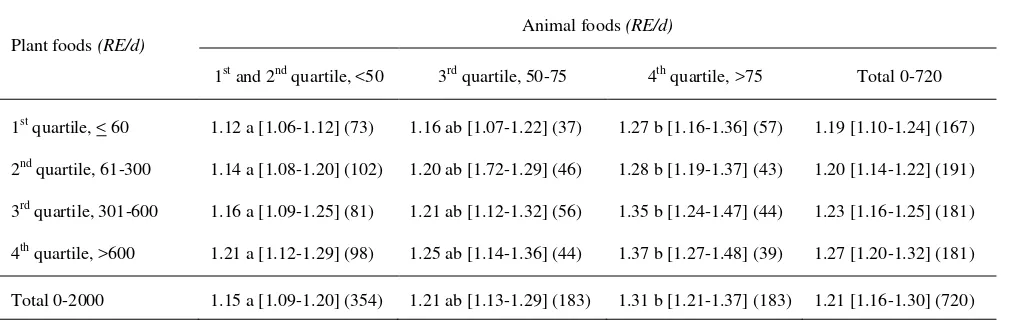
Table 3 shows that serum retinol concentration of women by quartiles of vitamin A intake from plant and animal foods respectively. The first two quartiles of vitamin A intake from animal foods were combined because 44% of the women did not consume animal foods containing vitamin A. There was a dose-responsive relationship between vitamin A intake from animal foods and serum retinol concentration. Vitamin A intake from plant foods also showed a dose-responsive relationship with serum retinol concentration. But it was rather weaker than animal foods. The Spearman-rank-correlation between vitamin A intake from plant foods and serum retinol concentration was significant, r=0,12 (p<0,05) and between vitamin A intake from animal foods and serum retinol concentration was significant r: 0,14 (p<0,05). Vitamin A intake from plant and animal foods were negatively correlated (Spearman-rank-correlation): -0,10, p<0,01).
Several indication of physiological condition, food production and socioeconomic status were also evaluated
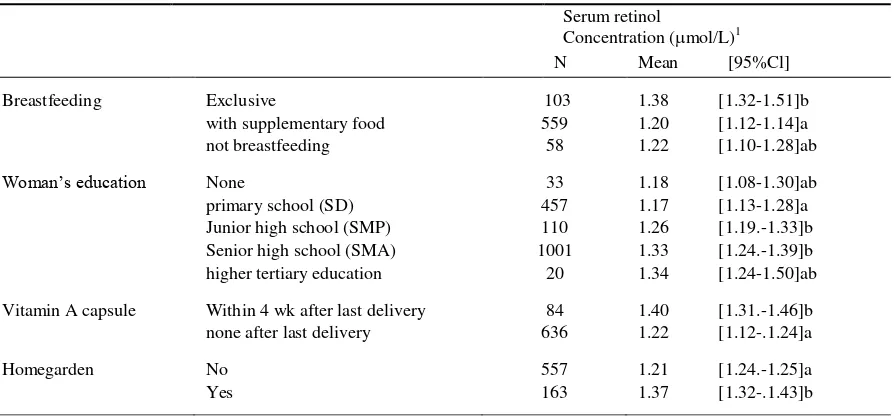
for their relationship with serum retinol concentration. Tables 4 show the bivariate analysis for the indication that were significantly related to serum retinol concentration. Examination of the relationship between breastfeeding status and age of the youngest child showed significant age differences (mean): 3,8 11,4 and 16,7 mo for exclusive breastfeeding, supplemented breastfeeding and not breastfeeding respectively. Addition to vitamin A intake from plant and animal foods, women's serum retinol concentrations were also related to physiological factors, such as duration of breastfeeding, age of the youngest child, MUAC receipt of a vitamin A capsule after delivery of the youngest child, fruit and vegetable production, expressed in ownership of a home garden and socio-economic factors, such as house size and education level at the woman.
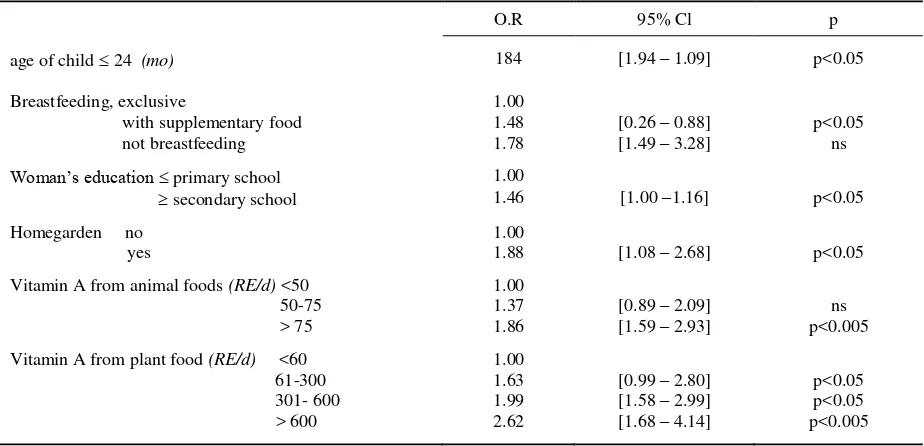
Vitamin A intake from plant and animal foods and the determinant factors shown in Tables 4 and 5 were available for stepwise entrance into a logistic regression model for predicting the chance that a woman had a serum retinol concentration above the observed median of the population ≥1,37 μmol/L). Education level of woman was devided into two categories to increase distinguishing power.
Table 3. Serum retinol concentration (mmol/L) by quartiles of vitamin A intake from plant and animal food*
Plant foods (RE/d)
Animal foods (RE/d)
1st and 2nd quartile, <50 3rd quartile, 50-75 4th quartile, >75 Total 0-720
1st quartile, < 60 1.12 a [1.06-1.12] (73) 1.16 ab [1.07-1.22] (37) 1.27 b [1.16-1.36] (57) 1.19 [1.10-1.24] (167)
2nd quartile, 61-300 1.14 a [1.08-1.20] (102) 1.20 ab [1.72-1.29] (46) 1.28 b [1.19-1.37] (43) 1.20 [1.14-1.22] (191)
3rd quartile, 301-600 1.16 a [1.09-1.25] (81) 1.21 ab [1.12-1.32] (56) 1.35 b [1.24-1.47] (44) 1.23 [1.16-1.25] (181)
4th quartile, >600 1.21 a [1.12-1.29] (98) 1.25 ab [1.14-1.36] (44) 1.37 b [1.27-1.48] (39) 1.27 [1.20-1.32] (181)
Total 0-2000 1.15 a [1.09-1.20] (354) 1.21 ab [1.13-1.29] (183) 1.31 b [1.21-1.37] (183) 1.21 [1.16-1.30] (720)
* mean [95%CI] (n)
Table 4. Arithmetric mean value of lactating
Woman’s serum retinol concentration for different characteristics
Serum retinol
Concentration (mol/L)1
N Mean [95%Cl]
Breastfeeding Exclusive 103 1.38 [1.32-1.51]b
with supplementary food 559 1.20 [1.12-1.14]a
not breastfeeding 58 1.22 [1.10-1.28]ab
Woman’s education None 33 1.18 [1.08-1.30]ab
primary school (SD) 457 1.17 [1.13-1.28]a
Junior high school (SMP) 110 1.26 [1.19.-1.33]b
Senior high school (SMA) 1001 1.33 [1.24.-1.39]b
higher tertiary education 20 1.34 [1.24-1.50]ab
Vitamin A capsule Within 4 wk after last delivery 84 1.40 [1.31.-1.46]b
none after last delivery 636 1.22 [1.12-.1.24]a
Homegarden No 557 1.21 [1.24.-1.25]a
Yes 163 1.37 [1.32-.1.43]b
abc Values within one category with a different letter are significantly different from each other, p<0.05 (ANOVA, post-hoc multiple comparisons test of least-significant difference).
Table 5. Correlation between woman’s serum retinol concentration (mol/L)1
and other characteristics (n=720)
Spearman –rank-correlation coefficient
Age of child 36 mo old (mo) -0.11 p<0.001
Haemoglobin concentration (g/L) 0.22 p<0.001
Mid-upper-arm circumference (cm) 0.09 p<0.05
Size of house (m2) 0.11 p<0.01
Table 6 shows the factors which explained a significant proportion of that chance, white controlling for the other factors. When the p-value for entrance into the logistic regression model was extended to <0,10, women's education level (p<0,06) also entered the model. The factors included in the model (Table 6) were indicators of physiological status (breastfeeding status, age of the youngest child); vitamin A intake from plant and animal foods and factors which maybe related to vitamin A intake as well as to health and vitamin A status (owning a homegrarden and woman's education level).
Table 6. Odds ratios [95%Cl] for having a serum retinal concentration above the median (using logistic registration model).
O.R 95% Cl p
age of child 24 (mo) 184 [1.94 – 1.09] p<0.05
Breastfeeding, exclusive 1.00
with supplementary food 1.48 [0.26 – 0.88] p<0.05
not breastfeeding 1.78 [1.49 – 3.28] ns
Woman’s education primary school 1.00
secondary school 1.46 [1.00 –1.16] p<0.05
Homegarden no 1.00
yes 1.88 [1.08 – 2.68] p<0.05
Vitamin A from animal foods (RE/d) <50 1.00
50-75 1.37 [0.89 – 2.09] ns
> 75 1.86 [1.59 – 2.93] p<0.005
Vitamin A from plant food (RE/d) <60 1.00
61-300 1.63 [0.99 – 2.80] p<0.05
301- 600 1.99 [1.58 – 2.99] p<0.05
> 600 2.62 [1.68 – 4.14] p<0.005
Median value : 1.26 mol/L
N : 720
Table 7. Vitamin A intake from plant and animal foods by ownership of a homegarden and woman’s education level*
Vitamin A intake (RE/d)
n plant foods animal foods total
Homegarde no 557 246 (36-480)a 60 (0-70)b 308 (126-576)a
yes 163 388 (49-828)b 19 (0-48)a 398 (198-838)
Woman’s education none 33 316 (56-610)ab 0 (0-45)a 300 (120-526)a
primary school (SD) 457 353 (66-608)b 16 (0-55)b 302 (136-589)a
junior high school (SMP) 110 320 (68-688)a 25 (0-78)c 308 (110-602)b
senior high school (SMA) 1001 315 (66-586)a 45 (26-110)d 316 (121-580)a
higher tertiary education 20 340 (68-380)ab 106 (70-146)e 340 (189-601)ab
* median (25-75 percen)
abcd Categories in one colum, for one indicator, with a different letter are significantly different from each other (Kruskal-Wallis test p<0.05 followed by Mann-Whitney test for comparison two categories, p < 0.05)
DISCUSSION
Dietary vitamin A intake showed a dose-responsive relationship whit serum retinol concentration. Despite the fact that plant foods contributed 16 times more to total vitamin A intake than animal foods, serum retinol concentrations in their respective quartiles were almost the same. Owning a homegarden and
woman's education level were positively correlated with serum retinol concentration and with vitamin A intake, from plant and animal foods respectively.11
vegetables into categories of low, medium or high vitamin A content, was based on values reported in Indonesian food composition. Table also, within one species of vegetables, carotene content can vary widely, depending on factors such as maturity, handling after harvest and preparation practices. Because this variation reduces the precision of the intake estimate, it can increase the misclassification of subjects into quartiles of intake and hence, reduce the differences in serum retinol concentration between these quartiles. Thus, it can assumed that the vitamin A intake from vegetables was approximately 70% of what it was estimated to be and that the differences in serum retinol concentration between the quartiles of vitamin A intake from plant foods were underestimated.11, 12, 13, 1
However, supposing these assumptions are correct, vitamin A intake from plant foods was still much higher than from animal foods, while serum retinol concentrations in their respective quartiles were almost the same. This resembles finding of a recent intervention trial with school children in West-Java, that the effectiveness of dark-green leafy vegetables and carrots in improving vitamin A status was only 23% and of fruit only 55 % of what has been assumed until now. Based on recent research the estimate of vitamin A intake from plant foods can thus be adjusted by multiplying it by 16%. That is, 70% (for lower vitamin A content) x 23% (for lower effectiveness of vegetables in improving vitamin A status). The finding of a greater effectiveness of fruits than of vegetables (15) does not need to be accounted for because fruit consumption is very low.18
This adjustment of vitamin A intake from plant foods resulted in values for its quartiles that are very similar to those for vitamin A intake from animal foods (Tables 3 and 6) e,g, <10, 10-47, 47-89 and ≥90 RE/d. this is in line with the similarity of serum retinol concentrations within their respective quartiles. When total vitamin A intake was recalculated, based on the adjustment of vitamin A intake from plant foods, its relationship with serum retinol concentration improved. Spearman-rank-correlation was 0,24 (p<0,001) and serum retinol concentrations for quartiles of total vitamin A intake (RE/d, <53; 53-<100; 100- 158;
≥158) were more different than those shown in Table
2 (mean [95% CI] (n): 1,25a [1,20-1,30] (185); 1,27a [1,22-1.33] (176). 1,37b [1,31-1,42] (181); 143b [1,38-1,48] (178) (quartiles with different letters are significantly different, ANOVA with post-hoc multiple comparison test for least significant difference).17
Thus vitamin A intake for quartiles of vitamin A intake from plant foods adjusted for lower vitamin A activity and for quartiles of vitamin A intake from animal foods were approximately the same, as were the serum retinol concentrations within their corresponding quartiles. And the relationship between total dietary vitamin A intake and serum retinol concentration improved when vitamin A intake was recalculated based on the adjustment of vitamin A intake from plant foods. This suggests that the adjustment, taking 16% of vitamin A intake from plant foods was necessary and it confirms the findings of the intervention trial with school children in West-java.19
The multiple logistic regression model for population (>1,26 µmol/L) included not only vitamin A intake from plant and animal foods, but also age of the child, breastfeeding status, hemoglobin concentration, ownership of a homegarden and woman's education level. The simultaneous entrance of age of the child and breast-feeding status seems to indicate that it improves again after she stops breastfeeding. Ownership of a
home-garden and woman’s education level were related to
serum retinol concentration, as well as to vitamin A intake. Homegardening in Central-Java can be described as growing vegetables and/or fruits in plots near as well as away from house. In general, it does not include keeping poultry, fish and/or small animals. In
this population, woman’s education levels seems to be
good indicator of socio-economic status.6, 7, 22
Woman with the homegarden had a higher vitamin A intake I the past 24 h from plant food, than woman without a homegarden. On the other hand, woman with the higher education level had a higher vitamin A intake in the past 24 h from animal foods as compared to woman with a lower education level, while their vitamin A from plant foods was not different. The fact that homegardening and education level entered the logistic regression model which already included vitamin A intake from plant and animal foods during the past 24 h, seems to indicate that these two factors reflect longer term consumption patterns of plant and animal foods, respectively.7
It’s explained that the relationship between
in South East Asia, such as should be included in food-based program for improving vitamin A status. However, where it is difficult to increase the consumption of animal and/or fortified foods, such as many areas of South Asia, the consumption of fruits and vegetables should be increased, while preparation methods need to be found which can increase the bioavailability of provitamin A carotenoids.3, 22
CONCLUSION
During crisis plants foods are an important source of vitamin A, but they are less important for vitamin A status than previously thought. Therefore, it is important to distinguish between plant an animal foods when assessing vitamin A intake and, where possible, to include animal and/or fortified foods in food-based programs for improving vitamin A status. Homegardening and socio-economic status, indicated
by woman’s education level, are positively related to
serum retinol concentration, which seems to indicate that they reflect longer-term vitamin A intake from plant and animal foods, relatively.
Acknowledgements
We thank the Head of the HKI office At the Diponegoro University in Semarang for recommendation, using data to re analyze and the field supervisors an enumerator for the data collection, the local government and respondents for their collaboration and the Nutrition Research and Development Center in Bogor.
REFFERENCES
1. Hellen Keller Worldwide. Monitoring the Economic Crisis Impact and transition 1998-2000. Nutrition & Health Survaillance System (NSS). In Indonesia. 2000 2. Hellen Keller International, 1996 Annual report
3. De Pee S, Bloem MW, Gorstien J, et al. Reappreciation of the Importance of Vegetables For Vitamin A. Status of Mothers in Indonesia: Nutrition Survaillance in Central-Java. HKI. Jakarta. 2000.
4. Beaton G H, Martorell R, Arronson K J, et al. Effectiveness of Vitamin A Supplementation in the Control of Young Child Morbidity and Mortality in Developing Contries. Geneva, United Nations ACC/SCN State of the art series Nutrition Policy Discussion Paper no 13. 1993
5. Ghana VAST Study Team Vitamin A Supplementation In
Nortern Ghana Effects In Clinic Attendance, Hospital Admissions And Child Mortality. Lancet 1993; 342:7- 12
6. Bloem M W, Wedell M, van Agtmaal E J, Speek A J, Saowakontha S, Schreur WHP. Vitamin A Intervention, Short Term Effects of a Single Oral Massive Dose on Iron Metabolism. Am J Clin Nutr 1990; 51:76-9
7. Suharno D, West C E, Muhilal, Karyadi D, Hautvast JGAG. Supplementation With Vitamin A and Iron for Nutritional Anemia in Pregnant Woman in West Java, Indonesia. Lancet 1993; 342: 1325-8
8. IVACG. Two Decades of Progress Linking Knowledge to
Action. Report of the NVI International Vitamin A Consultative Group. Washington DC. IVACG 1994:32-3 9. Micozzi MS, Brown E D, edward B K, et al. Plasma
Carotenoid Response to Chronic Intake of Sellected Foods and ß-Carotene Supplement in Men. Am J Clin Nutr 1992;55:1120-5
10. De Pee S, West C E, Muhilal, Karyadi D, Hautvast JGAG. Lack of Improvement in Vitamin A Status with Increased Consumption of Dark Green Leafy Vegetables. Lancet 1995; 346:75-81
11. Departemen Kesehatan RI. Daftar Komposisi Zat Gizi Pangan Indonesia. Jakarta, 1995
12. Hardinsyah, Briawan D. Penilaian dan Perencanaan Konsumsi Pangan. Jurusan GMSK, IPB, Bogor, 1994 13. Nio O K. Daftar Analisis Bahan Makanan. Fakultas
Kedokteran Universitas Indonesia. Jakarta,1992.
14. Arroyave G, Mejia L A, Chichester C O, et al. Biochemical Methodology for the Assesment of Vitamin A Status. Washington DC. The Nutritional Foundation, 1982 (International Vitamin A Consultative Group Report) 15. West, CE, Portvliet EJ. The Caroteniod Content of Food
with Reference to Developing Countries. Washington DC. USAID-VITAL, 1993
16. Hulshof PJM, Xu C, van de Bouvenkamp P, Muhilal, West CE. Application of a Validated Method for the Determination of Vitamin A Carotenoid in Indonesian Foods of Different Maturity Origin. J Agrie Food Chem, in press
17. De Pee S, West C E, van Staveren W A, Muhilal. Vitamin A Intake of Breastfeeding Woman in Indonesia: Critical Evaluation of a Semi Quantitative Food Frequency Questionaire. Submitted for publication
18. De Pee S, West C E, Permaesih D, Martuti S, Muhilal, Hautvast JGAG. Orange Fruit are More Effective in Icreasing Serum Concentration of Retinol and ß- Carotene than Dark Grey Leafy Vegetables: a Study in Schoolchildren in Indonesia. Submitted for publication. 19. Bloem MW, Huq N, Gorstein J, et al. Production of Fruit Consultative Group Meeting, p 78. Washington DC: IVACG, 1994
21. Bloem MW, Gorstein J, Viet Nam. Xeropthalmia free. 1994. National Vitamin A Deficiency and Protein Energy Malnutrition Prevalence Survey. Consultancy Report Hanoi. National Institute of Nutrition, 1995.