OPTIMIZATION OF ELECTROCHEMICAL
MACHINING PROCESS ON MAKING
MULTILAYERED MICROFILTER
Dawi Karomati Baroroh
#, Andi Sudiarso
* #Currently a student at the Department of Mechanical and Industrial Engineering Universitas Gadjah Mada, Jl. Grafika 2 Yogyakarta, INDONESIA
email: [email protected]
*
Department of Mechanical and Industrial Engineering Universitas Gadjah Mada, Jl. Grafika 2 Yogyakarta, INDONESIA
e-mail: [email protected]
Abstract—Optimization value of material removal rate (MRR) and overcut (OC) are important things in electrochemical machining (ECM), especially in production of multilayered Microfilter. Because ECM process can be influenced by voltage and feed rate, to detect the effect of both factors on MRR and OC, then conducted research with 3 levels of voltage (13, 15 and 17 volts), 3 levels of feed rate (5,5, 6,5 and 7,5 mm/min) and 3 times the replication of full factorial design approach (FF). Machining was done dynamically with a diameter of 4 mm copper electrode and workpiece material such as stainless steel 204. The results obtained from this research that voltage, feed rate and interaction of two factors have a significant influence on the value of MRR and overcut, where its influence are encapsulated in form of linear regression models. Besides that, the highest MRR obtained at voltage of 17
volts and feed rate 7,5 mm/min with value 6,37 × 10⁻⁴ g/s, while for
the lowest overcut obtained at voltage of 13 volts and feed rate of 6,5 mm/min at 0,208 mm. Based on the analysis for both response generated optimum conditions at voltage 17 volts and feed rate of 6,5
mm/min with value of MRR 5,533 x 10-4 g/s and value of overcut
0,351 mm.
Keywords - Material removal rate, overcut, electrochemical, full factorial design, linear regression.
I. INTRODUCTION
Machining technology began to be applied in the field of biomaterials, one of them in the manufacture of multilayered microfilters for dialysis process [1]. The need for multilayered microfilters increased with increasing number of patients with kidney failure in the world. The multilayered microfilters serve to separate the impurities such as urea, uric acid, and creatine from the blood content [1]. The multilayered microfilters was originally created by wet etching method, which is producing toxic vapors [2] and it also involves hazardous chemicals, such as hydrogen fluoride and sulfuric acid [3]. The material is classified as a strong acid, it is harmful both to human health and the environment. If the concentration of the material is more than 10% then if inhaled by humans, it will cause poisoning and even the death. In addition, if the human skin contacted with it can cause
burn, meanwhile if it is on a metal surface would cause corrosion because it has a high degree of oxidation. Because the dangerous of these materials, so it used an alternative method of electrochemical machining (ECM) is safe and friendly for the environment, because it does not use toxic chemical solution as previous etching process [1].
ECM is a machining process that relies on the removal of atoms from the surface of the workpiece [4], it also was defined as the process of electrolysis where metal discharge occurs because the chemical process of dissolving the workpiece [5]. Electrolysis is a chemical process occurs when an electric current passed through two electrodes disappeared in an electrolyte solution.
The ECM process is very complex, because it can be affected by many parameters. Therefore, we need an optimization to find the right combination of these parameters. Optimization in a process that is very important to do, this way is to ensure the process avoid wasting such as wasting time, money, and effort, so it can improve the quality of product. Optimal process will certainly support optimal production.
II. RESEARCHMETHOD
A. Electrode and workpiece
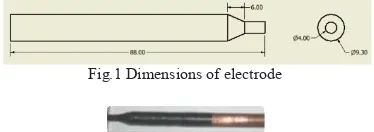
Electrode material is copper with dimensions shown in Fig.1, which are isolated to limit the burial area as shown in Fig.2. Moreover, workpiece material is stainless steel type 204 with dimensions shown in Fig.3, which also given appropriate isolation microfilter flow (shown in Fig.4).
Fig.1 Dimensions of electrode
Fig.3 Dimensions of workpiece
Fig.4 Dimensions of isolator
B. Operating conditions
A setting of parameters used in the experiment is shown in Table I below:
TABLE I
OPERATING CONDITIONS IN THE EXPERIMENT
Current (A) 0-20
Distance (mm) 1
Flow velocity (m/s) 3,32 Concentration of NaCl (g) 150 Volume of distilled water (l) 1
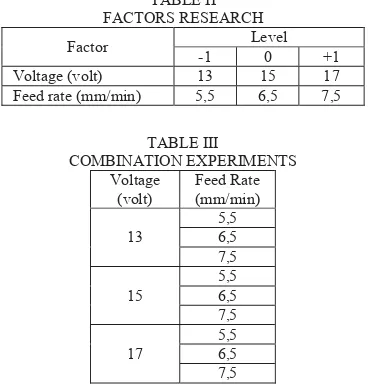
This study will examine 2 factors with each consisting of 3 levels (shown in Table II), where these conditions will result in 9 combination experiments shown in Tabel III.
TABLE II FACTORS RESEARCH
Factor Level
-1 0 +1
Voltage (volt) 13 15 17
Feed rate (mm/min) 5,5 6,5 7,5
TABLE III
COMBINATION EXPERIMENTS Voltage
(volt)
Feed Rate (mm/min)
13
5,5 6,5 7,5
15
5,5 6,5 7,5
17
5,5 6,5 7,5
C. Experimental procedures
Prepare and attach all the tools and ingredients, turn on the computer and use the software MACH 3 and setting the position of electrode with gap of 1 mm. Turn on the pump adjust flow velocity of 3,32 m/s and spray water over the workpiece, turn on the power supply voltage and feed rate set in accordance combination of factors, and then select the code of movement machining. Later prepared stopwatch and let the power supply is lit up to 2 seconds so stable and then click button of cycle start to run the movement machining (shown in Fig.5). During the process make sure the actual voltage and
current during machining, if the current is too small then it is possible the installation of the tandem is not appropriate. Once coding is complete machining and processing stops, then turn off the power supply and then release the clamp, turn off the water pump, release and then clean the workpiece results. Perform these stages to 27 times experiment (9 combination with 3 times replication).
Fig. 5 Direction of movement electrode
D. ECM machine
A custom built ECM machine is used during the experiment as shown in Fig.6, which has 3 axis in which can be controlled by a computer using MACH 3 software.
Fig.6 Schematic of ECM machine
E. Measurement of responses
Material removal rate (MRR) is the mass number of workpiece material eroded per unit time. Theoretically MRR can be calculated based on the Faraday principle of electrolysis using (1) below [6]:
ൌ ɄǤǤ (1)
where;
MRR : material removal rate(g/s), η : current efficiency (%), I : electric current (A),
Ea : electrochemical equivalent(g), and
However, this study using (2) in calculating value of MRR. Because of equation (2) is simpler but still valid, the following equation:
ൌͳെʹൌ ο (2) where;
m1 : mass of the workpiece before machining (g),
m2 : mass of the workpiece after machining (g),
t : machining time (s).
while overcut is feeding that over from desired limit, which is measured by comparing the size of the hole to be made to the size of the hole in the workpiece from machining result (using (3)).
ൌ ݅ݏ݈ܽݐ݁݀ െݓݎ݇݅݁ܿ݁ (3)
where;
disolated : size of isolated (mm), and
dworkpiece : size of workpiece (mm).
After each response is known, then the next is mathematical modeling. In describing the effect of the two factors used mathematical models that follow the equation of linear regression models using (4) as below [7]:
Y = B0 + B1X1 + B2X2 + B12X1X2 (4)
where;
Y : output/results,
B0 : average results of the experiment,
B1 : coefficient of factor-1,
B2 : coefficient of factor-2,
B12 : coefficient of interaction factor,
X1 : optimum level of factor-1,
X2 : optimum level of factor-2, and
X1X2 : optimum level of interaction factors.
III.RESULTSANDANALYSIS
A. Analysis of results
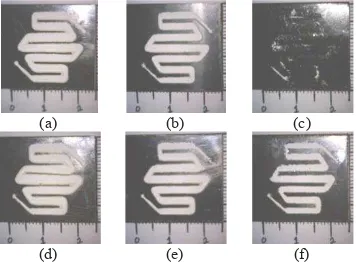
The results of quality testing of ECM machining reviewed in two responses, are named MRR and overcut, Fig.7 shows the machining results from ECM:
(a) (b) (c)
(d) (e) (f)
(g) (h) (i)
Fig.7 Machining result of (a) 13 volt & 5,5 mm/min (b) 13 volt & 6,5 mm/min (c) 13 volt & 5,5 mm/min (d) 15 volt & 5,5 mm/min (e) 15 volt & 6,5 mm/min (f) 15 volt & 7,5 mm/min (g) 17 volt & 5,5 mm/min (h) 17 volt & 6,5 mm/min (i) 17 volt & 7,5 mm/min
TABLE IV
SUMMARY OF RESPONSES MRR
Voltage
Fig.8 Comparison chart of MRR
From Table IV and Fig.8 it can be seen the average of the highest MRR obtained at voltage of 17 volts and feed rate of 7,5 mm/min with value of 6,37 x 10⁻⁴ g/s, is followed by experiments with a voltage 17 volts and feed rate in below of it meanwhile the lowest MRR obtained at the lowest level voltage at 13 volts. In addition, at voltage level 15 and 17 volt increasing feed rate can be resulted the increasing value of MRR. But for the voltage 13 volts, it is not applicable due to the feed rate of 7,5 mm / min (level +1), workpiece has no holes or undercuts, so its value tends to be low MRR.
TABLE V
Fig.9 Comparison chart of overcut
From Table V and Fig.9 show that the lowest average overcut was obtained at voltage of 13 volts and feed rate of 6,5 mm/min of 0,208 mm, meanwhile the highest overcut was obtained at voltage of 17 volts and feed rate of 5,5 mm/min. But in addition to overcut, undercut was also indicated by the value of minus (-). Undercut condition obtained when a voltage of 13 and 15 volts on the feed rate of 7,5 mm/min. Moreover, for all voltages on level -1 feed rate (5,5 mm/min) were resulted in a high overcut value, where is the value of overcut decreased progressivelywith the increased levels of feed rate. Low overcut condition occurs at voltage of 13 volts and feed rate of 6,5 mm/min in the amount of 0,208 mm. Because the voltage positions at 15 and 13 volts with a feed rate of 7,5 mm/min were resulted in a low position of the plot, but tend to be negative (-), which indicates the position of the undercut.
B. Analysis of statistics
In the statistical analysis, this study used a significance
value (α=5%). Results of statistical analysis for each response
are described below:
1. MRR
The distributed response normal data was obtained, because the value of P-value was obtained kolgomorov smirnov test (P-value=0,843) > (α = 5%). From the results of variance analysis test showed that the voltage of each variable, feed rate and the interaction have a significant effect on MRR response shows the value of the P-value < (α = 5%) can be
seen in Table VI.
TABLE VI
ANALYSIS OF VARIANCE FOR RESPONSE MRR Source of
means that the used regression model has a significant influence in describing the response of model or the model of MRR can be used. Furthermore, from the T test is known that
P-value < (α = 5%). It means that the variable voltage and
feed rate as well as the interaction, as a whole has a significant influence on the response of MRR (Table VII).
TABLE VII
T-TEST FOR RESPONSE MRR Predictor Coefficient P-value Intercept 1,69 x 10⁻³ 0,0014 Voltage -8,59 x 10⁻⁵ 0,0103
Feed rate -2,38 x 10⁻⁴ 0,0027 Interaction 1,72 x 10⁻⁵ 0,0013
Results from T test can be used to represent the linear regression model:
the regression model has R2 value of 73,85%, means the independent variables used have a strong influence/high to describe the research model with R value of 85,94% means that the relationship between the dependent and independent variables in the study can be said to have a relationship strong as close to 100%.
2. Overcut
The distributed response normal data was obtained because the value of P-value was obtained kolgomorov smirnov test (P-value=0,421) > (α = 5%). The results of variance analysis test showed that each variable either voltage, feed rate and the interaction have a significant effect on the response overcut showed the value of P-value < (α = 5%) can
be seen in Table VIII.
TABLE VIII
ANALYSIS OF VARIANCE FOR RESPONSE OVERCUT Source of
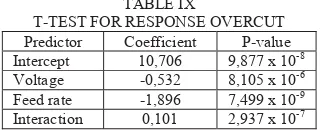
it means that the used regression model has a significant influence in describing the response of the model or overcut, then the model can be used. Furthermore, from the T test can be resulted P-value < (α = 5%). It means the variable voltage
and feed rate as well as the interaction, as a whole has a significant influence on the response overcut (Table IX).
TABLE IX
T-TEST FOR RESPONSE OVERCUT Predictor Coefficient P-value Intercept 10,706 9,877 x 10-8
Voltage -0,532 8,105 x 10-6
Feed rate -1,896 7,499 x 10-9
Interaction 0,101 2,937 x 10-7
Results from T test can be used to represent the linear regression model:
the regression model R2 has value of 94,93%, means that the used independent variables has a strong influence/high to describe the research model with R value of 97,43% means that the relationship between the dependent and independent variables in the study can be said to have a relationship strong as close to 100%.
The results of both the classical assumption for the response MRR and overcut obtained: residual normality test of data that fulfilled because the P-value > (α = 5%), no autocorrelation time series data for durbin Watson value is between 2 means random, there is no heteroscedasticity in regression models made linear P-value for each independent variable value of 1 or above 5%, but there was a variable multicollinearity VIF > 10 this is due to the influence of the interaction of the variables that significantly affect the response.
C. Analysis of mixtures
In addition, the combination for each conducted the search of optimum combination for both was using graphical method by using the intersection graphs plot between MRR and overcut of predictive regression equation for each response to each factor.
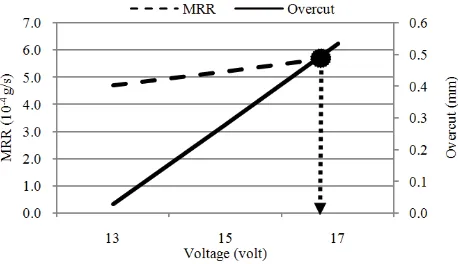
Fig.10 Analysis of mixtures based on voltage
The intersection of MRR and overcut value occur at a voltage of 17 volts with MRR value of approximately (5,0 to 6,0) x 10-4 g/s, and overcut value approaching 0,5 mm (from Fig.10).
Fig.11 Analysis of mixtures based feed rate
The intersection of MRR and overcut value occurs at feed rate of 6,5 mm / min with MRR about (5,2 to 5,3) x 10-4 g/s and overcut value approaching 0,3 mm (from Fig.11). Therefore, it can be the result that the optimum combination of considering both response (mixture) are for maximize MRR and minimize overcut occur at voltage 17 volts and feed rate of 6,5 mm/min with an MRR of 5,533 x 10-4 g/s and overcut value of 0,351 mm.
IV.CONCLUSION
The results obtained from this research that voltage, feed rate and interaction of two factors have a significant influence on the value of MRR and overcut. The influence of each factor on the value of MRR and overcut formulated in the form of linear regression model, the following equation is formed MRRprediction = 1,69 x 10⁻³ + (-8,59 x 10⁻⁵)*X1 + (-2,38
x 10-4)* X2 + (1,72 x 10⁻⁵)* X1X2, and OCprediction = 10,706 -
0,532* X1 – 1,896* X2 + 0,101* X1X2.. In addition, for the
highest MRR response obtained at a voltage of 17 volts and a feed rate of 7,5 mm/min with a value of 6,37 x 10⁻⁴ g/s, while for the lowest overcut response obtained at a voltage of 13 volts and feed rate 6,5 mm/min of 0,208 mm. Results of analysis for both the response generated optimum at 17 volts and feed rate of 6,5 mm/min with an MRR of 5,533 x 10-4 g/s and overcut value of 0,351 mm.
REFERENCES
[1] Y. Gu and N. Miki, “Multilayered Microfilter Using A Nanoporous PES Membrane and Applicable As The Dialyzer of A Wearable Artificial Kidney”, Journal of Micromechanics and Microengineering, vol. 19, no. 6, pp. 1-8, May 2009.
[2] H.Y. Kang, An Introduction of Etch Process, Hynix, Gumi Process Team, 2008.
[3] I.K. Abdul, “Using Wet & Dry Etching Technologies to Etch Si-Wafers”, Journal of College of Education, no. 5, 2010.
[4] J.A. McGeough, Advanced Methods of Machining, Chapman and Hall Ltd, London, 1988.
[5] A. Sudiarso, Advanced Methods of Machining Series: Electro-Chemical Machining (ECM), Department of Mechanical and Industrial Engineering Universitas Gadjah Mada, Yogyakarta, 2009.
[6] A. Sudiarso, N.L.F. Ramdhani, and M. Mahardika, “Material Removal Rate on Electrochemical Machining of Brass, Stainless Steel, and Aluminium using Brass Electrodes”, International Journal of Mining, Metallurgy & Mechanical Engineering (IJMMME), vol. 1, no. 1, pp. 14-17, 2013.