Advanced Application of ICT to the Sustainable Production
of Excellent Japanese Mandarin
Ryoei Ito1, Atsushi Hashimoto2, Hitoshi Okuda3, Takashi Togami4, Takaharu Kameoka5, Noritaka Suzaki6, Hiromithi Ithinokiyama7, Oono Hidekazu8, Masakazu Nishijima9, Motokazu Nakamura10, Ayaka Fujita11, Nagisa
Numano12, Hiroyuki Yagyu13, Toshiyuki Kamiya14, Hideo Shimazu15
1, 2, 3, 4, 5
Graduate School of Bioresources, Mie University, Tsu, Mie, JAPAN, E-mail: kameo [email protected]
6, 7, 8Kinan Fruit Tree Science Branch, Mie Prefecture Agricultural Research Institute, Mihama, Mie Japan, E-mail:
9, 10, 11Kisyuu Regional Agriculture Extension Center, Mie Prefectural Government, Kumano, Mie, JAPAN, E-mail:
12,13,14,15
System Technology Laboratory, NEC System Technologies, LTD, Ikoma, Nara, JAPAN, E-mail: [email protected]
ABSTRACT
Satsuma Mandarin cultivated in Nanki, Mie, Japan is one of the most excellent rareripes. However, lack of agricultural continuators makes the translation of special agricultural skills much harder. Under these circumstances, advanced application of ICT to Mandarin production using the scientific evidences based on the sensing data is eagerly desired. In this sense, collaboration between ICT system developers and Mandarin growers should be necessary with sharing common understanding for the sustainable production of excellent Japanese Mandarin based on the index for optimal irrigation control with sensing data. In this paper, therefore, we tried to apply cutting-edge ICT to sustainable production of excellent Satsuma Mandarin: namely, the establishment of cultivation diagnosis for the Mandarin production by the hardness of fruit, water stress measured by Time Domain Reflectometry method, evapotranspiration, and soil moisture stress (PF value); and the development of the cultivation aid software, which is Guideware, with simple and easy human interfaces using a database linking between remotely sensed data and expertise. We also conducted to extract cheap, easy, rapid, nondestructive and nonchemical method for sensing tree vigor, fruit conditions, and meteorological conditions in Mandarin production.
Keyword: component; ICT, Satsuma Mandarin, TDR, Guidware, cultivation diagnosis
Introduction
Citrus industry in Japan has been declined for the last three decade. Production decreased one third (about 1 million a year) to the golden age and successor is not enough. For the purpose of new domestic demand, some studies have been made to produce high quality fruit. In particular, a lot of knowledge and experience about water stress and fruit quality are so far accumulated [1]-[5]. However, these results such as relationships between field and tree information such as fruit growth and softness, leaf roll and soil or tree water content and fruit quality are not returned and extended into citrus growers so much.
Agriculture is extremely vulnerable to climate change. Higher temperatures eventually reduce yields of desirable crops while encouraging weed and pest proliferation. Changes in precipitation patterns increase the likelihood of short-run crop failures and long-run production declines [6]. As the strategic device that enables long-term environmental
monitoring in the field, Field Server [7]-[9] was developed and used for the cultivation of various agricultural products in various places [10].
In this paper, therefore, we tried to apply cutting-edge ICT to sustainable production of excellent Satsuma Mandarin: namely, the establishment of cultivation diagnosis for the Mandarin production by the hardness of fruit, water stress measured by Time Domain Reflectometry (TDR) method, evapotranspiration, and soil moisture stress (PF value); and the development of the cultivation aid software, which is Guideware, with simple and easy human interface using a database linking between remotely sensed data and expertise. We also conducted to extract cheap, easy, rapid, nondestructive and nonchemical method for sensing tree vigor, fruit conditions, and meteorological conditions in Mandarin production.
Experimental Setup and Methods
A. Field Monitoring
In order to find the relationships between field and tree information, following field monitoring on water stress and fruit quality was carried out.
1) Fruit growth: Water stress reduces fruit growth. In this project, a measurement of fruit diameter was done for thirty fruits (3 fruits/tree ×10 trees) for each orchard from early July at intervals of ten days and irrigation started after the daily growth being under 0.2mm-change.
2) Volume water content in soil and tree:
Volumetric water contents in soil and tree were measured by TDR method [1] shown in Figure 1.
3) Small rubber ball method: Waters stress makes
a fruit softening in the rapid growth period from the completion time of physiological fruit drop to end August or early September after fruit juice volume increased. The degree of water stress could be supposed with this method. The degree of water stress was evaluated about 19:30 after sunset with the rubber ball with different softness by three stages. Developed amall rubber ball was shown in Figure 2.
4) Leaf roll: Waters stress also induces leaf roll symptoms. The degree of leaf roll is severe in daytime and less in nighttime. The degree of water stress could be supposed with the observation of this symptom. In this experiment, water stress was also evaluated by three stgaes with this method in ealy morning (5:00-6:00) before dawn.
5) Fruit quality: Waters stress condenses fruit juice and acid concentration increases as well as sugar one. Higher acid concentration is a contributing factor for lower quality fruit. Acid concentration is a good indicator for irrigation.
Figure 1. Volume water content measurement in soil and tree by Time Domain Reflectometry
method
Figure 2. Small rubber ball method
B. Construction of Data Acquisiton System
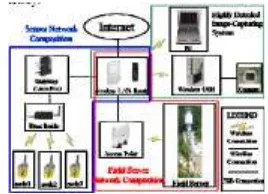
As for the data acquisition for cultivation, it is important to acquire data from farmer’s perspective. Therefore, wireless data acquisition system that consists of three components was constructed shown in Figure 3. One is Field Server that is automatic monitoring system and acquires data representing the fields such as amount of insolation. Second one is the sensor network that enables to take accurate grasp of the plant growth situation and the plant condition change in time, and to provide more flexible monitoring. The last one is the highly detailed image-capturing system for both the entire target site and the target plant.
In relation to the sensor network, the recent advancement in sensor network technology that includes waterproof property of nodes, solar batteries, size, and so on enables to acquire data near the actual plant at outdoor site. The sensor network eKo of Crossbow Technology is a set of plug-andplay devices and consists of sensor nodes, the base radio and the gateway.
Figure 3. Construction of data acquisition system
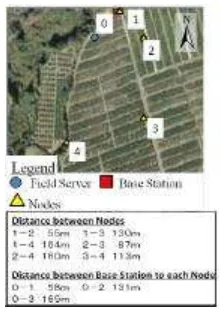
Figure 4. The location of sensor network
Figure 4 shows the installation of eKo nodes at mandarin orange farm at Kanayama Pilot in Kumano city, Mie-pref., Japan (N: 33°51’ 47.97’’, E: 136°03’ 23.29’’). Our previous communication experiment of eKo at an open space showed the sufficient capability of communication range and it suggested that the base radio and nodes should be placed higher than mandarin orange trees, which is about 3 m above ground. Therefore, the base radio and all nodes were placed higher than mandarin orange trees. Then, communication experiment using four nodes was implemented. After the experiment, nodes were attached to the pole with about 3 m long and nodes were replaced to acquire data focusing on plant growth situation.
C. Numerical Data Acquisition
With regard to the data acquisition in an agricultural site, two types of acquisitions were carried out. One is the stationary measurement for acquiring data, which represents the environment of entire target field and the locality by Field Server. The other is to obtain information that a plant senses on the spot by the sensor network. In relation to the data acquired by the network, data can be collected by sensors attached to the nodes and it is transmitted by the base radio to the gateway, which is the main system and plays a roll of the data storage.
Both data from Field Server and eKo should be stored and accumulated in Database Server. Data from Field Server is transferred and stored in the database server at Mie University via internet. On the other hand, in the case of eKo, we changed the gateway to Linux Box, and developed data acquisition & transferring program. And then, we verified if the data was transferred to the server at Mie University. Data flow reaching to User was shown in Figure 5.
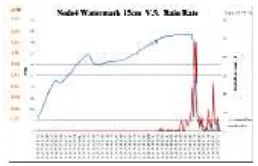
Weather station was applied to eKo to acquire the rainfall, wind speed and direction, barometric
pressure, solar radiation, and temperature and humidity while Field Server acquires temperature and humidity, soil moisture and solar radiation. Water mark was used for soil water potential measurement. In Accordance with Eijkelkamp Agrisearch Equipment [14], watermark sensors were buried at the depth of about 30 and 60 cm and attached to node2. Two soil water content sensors were buried at two different sites (node2 and node4) and tested. Temperature and humidity sensors was placed right next to the tree at the location site of node3 and examined what a mandarin orange tree actually feels.
Figure 5. Data flow reaching to user
D. Highly Detailed Image-Capturing System
A high resolution image enables us to take an accurate grasp of the plant growth condition change in time and to make a suitable cultivation management for the change. The recent advancement in camera includes high resolution, low cost and waterproof property has made it possible to place the devices in suitable location. Therefore, as the highly detailed image acquisition system, the combination of BirdCam (Wingscapes), a digital still camera with 8 mega pixels and Eye-Fi (Eye-Fi Japan), which is a SD memory card with wireless LAN was examined.
E. Thermal Image Utilization on the Vigor comparison between visible and thermal images.
Furthermore, the thermal image away from direct sunlight was obtained by reflecting the direct sunlight by using the white umbrella.
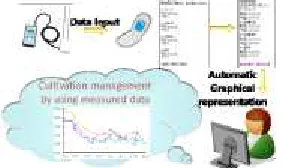
F. Field log by mobile phone
We developed a field log system by mobile phone for a part of field monitoring activity which is shown in Figure 6. Although field data such as temperature or humidity can be measured and collected automatically, some data such as TDR value, sugar degree, acidity or fruit growth measurement require some human work, and fruit hardness or curly leaf are difficult to be measured in numeric terms. Field workers note such data at the field and then transcribe them to spreadsheet in their office or home.
We develop a field log system as an application on mobile phone to reduce their burden. And we also implemented a Web-based UI for viewing or comparing their data with other data such as temperature or humidity.
Figure 6. Field log system by mobile phone
G. Visual Guideware
The development of software is very important for supporting farmers in cultivation management. However, there are critical issues in the software such as the limitation of function for data analysis, less utility, installation in each computer and installation time.
The primary data such as meteorological information and imageries acquired by a field monitoring are significant as such micrometeorological data and landscape information. However, secondary information such as effective accumulative temperature and amount of solar radiation becomes more important in regard to cultivation. Therefore, both primary and secondary information were focused and the web application with some functions for user’s needs was developed as a prototype of Visual Guideware [16].
Results and Discussion
A. Field Monitoring
The state of water stress was comprehended by measuring the volumetric water content in soil and tree by TDR method as is shown in Figures 7 and 8, respectively.
Figure 9 shows the time course of orange quality change. Sugar content of the fruits was ensured in the orchard where soil moisture management was made based on its measurement by TDR method. As a result, it was shown that the index of water stress by TDR method was effective.
In order to determine the measuring points by TDR method, the soil moisture distribution map was drawn in Figure 10. It took around one hour to complete the 10 a map of the orchard.
Figure 7. Time course of TDR value of the soil
Figure 8. Time course of TDR value of tree
Figure 9. Time course of orange quality change
Figure 10. Soil moisture distribution in the farm
B. Construction of Data Acquisiton System
In the experiment, it was verified that all nodes and base radio were able to communicate stably if
each node is placed about 3 m above ground, which is higher than a mandarin orange tree. The experimental result also showed that 4 nodes were able to cover the area of about 1 ha with stable communications.
C. Numerical Data Acquisition
There could not be seen any significant differences between the temperature and the relative humidity obtained from the sensor placed next to a mandarin orange tree and the data from the weather station. It has become apparent from the data acquired from the water potential sensors that the current usage of that type of sensors should be reconsidered. Since data precision and implications of data become more important, it is absolutely imperative to establish the sensor usage in a Japanese agricultural field.
We have verified that it will be possible to take more distributing data of the field. However, when acquisition of more local data becomes possible, the data should be acquired and stored with the consideration and relation between geolocation and data. Figure 11 shows the data acquired at Kanayama pilot. We have also verified that data from eKo was transferred and stored in Database server at Mie University and data handling becomes easier.
Figure 11. Management of acquired data
D. Highly Detailed Image-Capturing System
The images captured by BirdCam were transported by Eye-Fi via wireless LAN to the computer configured as a receiver. However, the communication distance problem has become clear. Therefore, countermeasures such as setting up the BirdCam with Eye-Fi near receiver and storing images in Eye-Fi SD memory card for several days should be taken. In addition, there has been a difficulty in capturing the same view on images that an experienced farmer focuses on for the diagnosis of plant vigor.
E. Thermal Image Utilization on the Vigor Diagnosis
Figure 12 shows temperature change of dotted line region on the thermal image. The data in the
bottom part indicates the surrounding conditions measured by Field Server installed in this farm.
It is found that leaf temperature is quite higher than ambient temperature. The temperature of leaf center is corresponding to the center area of the graph and peripherals corresponding to the side area.
According to the thermal images of two leaves taken by Thermoshot, of which the vigor is different from one another, temperature distribution is quite different as is shown in Figure 13. In the case of leaf of which tree vigor is weak, it was shown that the temperature was high at the central part and low in the peripheral part. On the other hand, in the case of leaf of which tree vigor is strong, the tendency was quite opposite, that is, the temperature was low at the central part and high in the peripheral part. It is thought that the difference of temperature profile might be caused by the difference of stomatal activity
Figure 12. Temperature distribution of leaf
Figure 13. Comparison of temperature profile between weak and strong trees
F. Field log by mobile phone
Figures 14 and 15 show UI for field logging and Web UI respectively. Field log system is built as a Java application (i-appli) for NTT docomo’s mobile phone and has intuitive and easy-to-use UIs for field worker. It also cares actual mandarin field radio condition. If it cannot upload data in the field because of weak signal, it can temporally store data in local storage.
Figure 14. Feld logging system
Figure 15. Web-UI
G. Visual Guideware
We developed the parts that become integral components of Visual Guideware by modifying Field Server Software. As for the field monitoring, real time data is important. Therefore, we have developed the webpage displaying the latest numerical data and images.
Figure 16 shows the webpage browsing past data. We put images on calendar in chromatic order with corresponding temperature and humidity. In addition, in this graph, user can switch the period of displaying data.
Moreover, we have prepared event calendar to keep a working record for cultivation. Hence, it was designed that users can post an image and text on the timeline.
Finally, it is the data download. It allows users to download their selecting data with CSV format. Additionally, downloading images is also possible.
Figure 16. Modification of Field Server Software
Conclusion and tree information, field monitoring on water stress and fruit quality such as fruit growth measurement,
volume water content measurement in soil and tree, small rubber ball method, leaf roll observation and fruit quality evaluation was carried out. Especially, volumetric water content measurement in soil and tree based on TDR method was applied and various possibility to take more accurate data that represents plant condition in the large covered area since 4 nodes covered the area of about 1 ha.
In relation to the numerical data acquisition, a lot of action assignments have been become apparent in order to acquire data with higher precision and use them as the backbone of Visual Guideware.
The emissivity of the mandarin orange leaf was determined to be 0.95 in the laboratory experiment. In the case of leaf of which tree vigor is weak, it was shown that the temperature was high at the central part and low in the peripheral part while the tendency was quite opposite in the case of leaf of which tree vigor is strong.
We developed a field log system for a part of field monitoring activity as an application on mobile phone. Field log system is build as a Java application (i-appli) for NTT docomo’s mobile phone and has intuitive and easy-to-use UIs for field worker. It also cares actual mandarin field radio condition. If it cannot upload data in the field because of weak signal, it can temporally store data in local storage.
Web UI is build as Flash application and provides visual comparison of data. It also has an advice function for underwater from data such as fruit hardness or TDR values.
We developed the parts that become integral components of Visual Guideware by modifying Field Server Software. As the next step, it is necessary to design database that can handle spatial information and interface with a map. Expressing tools that express information as Visual Guideware is also necessary.
Acknowledgment
We acknowledge the financial support from Ministry of Agriculture, Forestry and Fisheries, Japan for the execution of these studies.
References
[1] H. Okuda, H.,M.,Iwasaki and K. Sato, “Volumetric water content inbra nches and trunks of satsuma mandarin measured by time
domain reflectometry,” Hort.Res(Japan), 6(4) pp. 529-533, 2007.
[2] K. Tokumitsu, Y. Sato and R. Kodama, “Effcet of long term film mulching on cultivation of very early Satsuma mandarin,” Nichinan No.1, Kyusyu Nogyo Kenkyu, 59, p.197, 1997. [3] Y. Ushiroda, et al., “Effect on plustic film mulch
for fruit quality in satsuma mandarin. 1.Effect of covering time with mulch on fruit quality,” Kyusyu Nogyo Kenkyu, 53, p.210, 1991. [4] H. Yakushiji, “Sugar accumulation enhanced by
osmoregulation in satsuma mandarin,”. J.Amer.Hort.Sci., 121, pp. 466-472, 1996.
[5] D. Yahata, K.Ushijima and K.Matsumoto, “Characteristics of sugar accumulation in juice during fruit development and ripening of satsuma mandarin tree grafted on 'Hiryu'rootstock,” Hort.Res. (Japan), 2(1), pp. 39-44, 2003.
[6] C. Gerald, et al., “Climate change: Impact on agriculture and costs of adaptation” IFPRI , Food Policy Report, November 6, 2009
[7] T. Fukatsu, M. Hirafuji, “Field Monitoring Using Sensor-Nodes with a Web Server.” Journal of Robotics and Mechatronics. vol.17, pp.164-172, 2005
[8] T. Fukatsu, M. Hirafuji, T. Kiura, T “An Agent System for Operating Web-based Sensor Nodes via the Internet.” Journal of Robotics and Mechatronics. vol.18, pp.186-194, 2006
[9] M. Hirafuji, et al., “Deployment and
Improvement of Field Servers in India,” SICE Annual Conference 2010, pp.2925-2927, 2010 [10] Y. Motonaga, et al., “Monitoring the olive
culivation in Shodoshima using Field Server Systems.” World Conference on Agricultural Information and IT, 2008.
[11] Ministry of Agriculture, Forestry and Fisheries, The statistics of farm labor force (in Japanese),” http://www.maff.go.jp/j/tokei/sihyo/
data/08/html (internet reference, accsessed February 3, 2010).
[12] J. A. Lopez, F. Soto, P. Sanchez, A. Iborra, J. Suardiaz, and J. A. Vera, “Development of a Sensor Node for Precision Horticulture”, Journal of Sensors, vol.9, pp. 3240-3255, 2009 [13] E. S. Biagioni, and K. W. Bridges, “The
application of remote sensor technology to assist the recovery of rare and endangered
species”, International Journal of High
Performance Computing Applications. vol.16(3), pp.315-324, 2002
[14] Eijkelkamp Agrisearch Equipment, “14.27.01
Soil Moisture Meter
Watermark”,http://www.eijkelkamp.com/Portals /2/Eijkelkamp/Files/
Manuals/M11427e%20Soil%20moisture%20me ter%20watermark.pdf (internet reference, accessed May 14, 2010)
[15] Y. Otani et al, "Thermal Image Utilization on the Vigor Diagnosis of Mandarin Orange Tree" SICE Annual Conference 2010, pp.2915- 2918, 2010