ANALYTICAL SCIENCES JUNE 2011, VOL. 27 649
Introduction
Chromium can be present in various oxidation states, but only the two most common oxidation states, namely Cr(III) and Cr(VI), are predominant in the environment and typically found in drinking water. Cr(III) and Cr(VI) are drastically different in physicochemical properties as well as chemical and biochemical reactivities. Cr(III) is well-known as an essential trace element for humans, required for the maintenance of normal glucose, cholesterol and fatty acid metabolism. On the other hand, water-soluble Cr(VI) is highly toxic to both humans and animals,1 and other studies have indicated that it is an extremely
toxic carcinogen.2 In principle, because the health effects are
largely determined by the oxidation states, different guideline values for Cr(III) and Cr(VI) should be derived. However, current analytical methods and the variable speciation of chromium in water favor a guideline value for a total chromium of 50 µg dm–3.3,4
Oxidants are often added at drinking-water plants as disinfectants in order that their residual remains in the water distribution system. Sodium hypochlorite solutions are generally used for the source of free available chlorine as hypochlorous acid or hypochlorite ion, which equilibrate with chlorine.5,6
If treated drinking water containing Cr(III) is exposed to a disinfectant residual in the distribution system, Cr(III) may be oxidized to toxic Cr(VI), potentially increasing the health risk to consumers.7,8
Some studies related to the characterization of Cr(III)
oxidation by sodium hypochlorite have been reported. Kinetic experiments conducted at high NaOH concentrations showed that Cr(III) oxidation by hypochlorite has a pseudo-first-order pathway with respect to Cr(III), independent of the hydroxide concentration.9 The oxidation of Cr(III) in deionized, synthetic
and natural water has also been investigated.7,10 However, their
oxidation studies of Cr(III) were done at concentrations of mg dm–3 or sub-mg dm–3 levels, which is outside of the
naturally-occurring conditions, and is supersaturated with respect to Cr(OH)3.11 In addition, there were few quantitative
considerations.
The oxidation of Cr(III) to Cr(VI) in chlorinated water is thermodynamically feasible, and has been generally considered that the Cr species dissolved in tap water is Cr(VI). In this investigation, a kinetic study involving the oxidation of Cr(III) in tap-water samples using NaClO was done by monitoring the concentration of the oxidation product, Cr(VI), at sub-µg dm–3
levels to obtain quantitative information about the dissolved Cr species in chlorinated water. For this purpose, solid-phase spectrophotometry (SPS) with diphenylcarbazide as the coloring agent, based on direct spectrophotometric measurements of a solid phase that has adsorbed a target species, was used.12
Experimental
Reagents and chemicals
All reagents used were of analytical grade. Highly purified water, prepared by a Milli-Q SP system (Millipore, Milford, MA) was used throughout the study. A standard Cr(VI) solution (1000 mg dm–3) for atomic absorption spectrometry (Kishida,
Osaka, Japan) was used for preparing Cr(VI) samples. 2011 © The Japan Society for Analytical Chemistry
† To whom correspondence should be addressed. E-mail: [email protected]
Oxidation of Chromium(III) by Free Chlorine in Tap Water during the
Chlorination Process Studied by an Improved Solid-Phase Spectrometry
Sulistyo S
APUTRO,*
1†Kazuhisa Y
OSHIMURA,*
2Kô T
AKEHARA,*
2Shiro M
ATSUOKA,*
3and N
ARSITO*
4*1
Department of Mathematics and Natural Science Education, Faculty of Teacher Training and
Education Science, Sebelas Maret University, Surakarta-57126, Indonesia
*2
Department of Chemistry, Faculty of Sciences, Kyushu University, Hakozaki, Higashi, Fukuoka 812–8581,
Japan
*3
Department of Environmental Science, Faculty of Science, Niigata University, Ikarashi, Niigata 950–2181,
Japan
*4
Department of Chemistry, Faculty of Mathematics and Natural Sciences, Gadjah Mada University,
Yogyakarta-55281, Indonesia
The oxidation of Cr(III) at naturally-occurring concentration levels, i.e., µg dm–3 or lower levels, by free chlorine during the chlorination process of tap water was studied using an improved solid-phase spectrophotometric method, which can be directly applicable to the specific determination of Cr(VI) at µg dm–3 or lower levels. The effect of the pH on the oxidation kinetics was investigated under three different pH conditions. The results showed that free chlorine oxidized the Cr(III) to Cr(VI), following the pseudo-first-order kinetics with half lifetimes of 3.0, 3.3 and 14.4 h at pH 5.0, 7.0 and 8.0, respectively, if the hypochlorite concentration was maintained at 4 mg Cl dm–3.
(Received April 4, 2011; Accepted May 6, 2011; Published June 10, 2011)
650 ANALYTICAL SCIENCES JUNE 2011, VOL. 27
A standard Cr(III) solution (100 mg dm–3) was prepared by
dissolving KCr(SO4)2·12H2O in solution; the concentration was
atomic absorption spectrometrically determined. A sulfuric acid solution (about 0.5 mol dm–3) was prepared by diluting 6.8 cm3
of concentrated sulfuric acid with water up to 250 cm3. A NaClO aqueous solution (antiformine) with available chlorine of 5% (Wako, Japan). The initial concentration of the free available chlorine in the sample solution was determined by iodometric titration.13
The pH of the solution was adjusted to 5 with acetate buffer, and to 7 or 8 with a phosphate buffer solution until the final concentration was 0.01 mol dm–3.
Apparatus
Absorbance measurements for Cr(VI) by SPS were made by a double-beam UV-visible spectrophotometer (Model V-630, Jasco, Tokyo, Japan) using an improved cell holder.12
The ion exchanger was measured using an ion-exchanger aliquotting device. A PTFE tube (1.0 mm i.d. and 7 cm long) was fitted on one side with a PP resin filter tip and connected to a 10-cm3 disposable syringe.14
Electrochemical measurements for the free chlorine were carried out using a BD-101 electrochemical analyzer (Satoda Science, Japan) with a C-1B cell stand (BAS, USA). An Au disk (1.6 mm diameter), Ag/AgCl (saturated KCl), and Pt wire were used as the working, reference and counter electrodes, respectively.15
Procedure for kinetic measurements
Kinetic measurements were made by allowing the 5.0 µg dm–3
Cr(III) sample solution to contact with NaClO at a concentration of 4 mg Cl dm–3 for 0, 10, 15, 30, 45 and 60 min at pH 5.0; 0,
15, 35, 50, and 60 min at pH 7.0 and 0, 15, 30, 45, 60, 75, 90 and 105 min at pH 8.0, and subsequently by measuring the generated Cr(VI) concentration by the SPS method.12 To
maintain the ionic strength, KCl was added to each solution to a final 0.01 mol dm–3 concentration.
successively added, and then 0.06 cm3 of the ion exchanger was
added using an aliquotting device. The mixture was then stirred for 20 min at 20 C. After allowing the ion exchanger to settle, the supernatant solution was removed, and about 1 cm3 of the
resin–solution mixture was transferred to a disposable PE syringe (SS-10S2, Terumo, Tokyo) connected to a flow cell. The absorbance was directly measured at 540 nm (absorption maximum wavelength) and 700 nm (non-absorption wavelength), and the difference between the two absorbances was used for Cr(VI) analyses. After the absorbance measurement, the ion-exchanger beads were removed from the cell for the next measurements.12
In order to check the free chlorine concentration in each sample solution, a differential pulse voltammetric (DPV) measurement was performed after bubbling the reacted solution by N2 gas. To a 20-cm3 water sample, KCl was added
as the supporting electrolyte until the final concentration was 0.01 mol dm–3.15 The scan rate of the DPV was 20 mV s–1.
All measurements were carried out in a room at a thermostated temperature of about 25 C.
Results and Discussion
Interference of chlorine on the DPC determination of Cr(VI)
SPS is based on the direct spectrophotometric measurement of a solid phase that has sorbed a target species. This method made it possible to determine trace components in natural water samples without any preconcentration procedure, because the sensitivity is easily enhanced by increasing the sample volume.16,17 An SPS method selective for Cr(VI) has also been
developed using DPC as the coloring agent.12,18,19
In this Cr(VI) determination method, however, the residual free chlorine that mainly exists as HClO should be removed from the Cr(III) solution that reacts with chlorine, because the residual free chlorine interferes with the determination of Cr(VI) when using the DPC spectrophotometric method.11 The
sensitivity was reduced by a factor of 0.48 times when 4 mg Cl dm–3 HClO was present in the solution. This was
probably caused by the reaction of HClO with the DPC, which resulted in hindering the formation of the Cr-DPC complex.
Before starting kinetic experiments, we first examined the effects of the solution pH and Cl– concentration on the removal
efficiency of the residual free chlorine from the aqueous solution. The concentration of the remaining free chlorine was monitored by the DPV method.16 In this measurement, an
sensitivity in the Cr(VI) determination using the improved SPS. A 0.01 mol dm–3 KCl was added to the bubbling solution in
order to shift the following equilibrium to the right, and to effectively remove any free chlorine as Cl2 by bubbling with N2
gas.20 A good linearity (r2 = 0.999) was obtained from a
concentration decreased with decreasing solution pH, and HClO could be completely removed at a pH below 2.
In the equilibrium state, the Nernst equation of reaction (1)
experimental results shown in Fig. 1. We obtained a calibration curve with a good linearity (r2 = 0.999), and almost the same
sensitivity as that of the Cr-DPC-Muromac system without ClO–.
Oxidation of Cr(III) during chlorination process of tap water
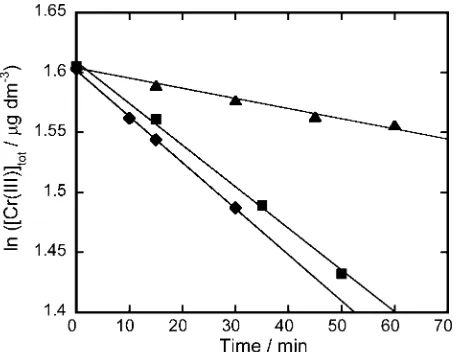
Figure 2 shows the dependence of the logarithmic concentration of Cr(III) on the reaction time for a solution containing 4 mg Cl dm–3 HClO and 0.01 mol dm–3 KCl. The
ANALYTICAL SCIENCES JUNE 2011, VOL. 27 651
determined by SPS. For all of the examined pHs, the logarithmic concentration of Cr(III) linearly decreased with the reaction time. The decrease in the Cr(III) concentration can be attributed to the oxidation reaction to Cr(VI) by the coexisting free chlorine. A similar reaction rate was observed at pH values of 5 and 7; in contrast, the reaction rate remarkably decreased at pH 8.
The acid dissociation constant, Ka, of HClO is reported to be
10–7.5, and the stepwise hydroxo complex formation constants of
Cr3+ to be 1010.0, 108.3 and 105.7.11,21 The precipitation of the
Cr(III) species can be ignored under the present experimental conditions of a very low total chromium concentration of 5 µg dm–3 (9.6 × 10⁻⁸ mol dm–3). By taking into account these
equilibrium constants and experimental conditions, the predominant species of Cr(III) are Cr(OH)2+, Cr(OH)
2+, and
Cr(OH)2+ + Cr(OH)3, and those of the chlorine species are
HClO, HClO, and ClO– at pH values of 5, 7 and 8, respectively.
The reaction rate was measured as the initial rate; thus, the effect of the backward reaction on the rate could be neglected. To explain the observed pH dependence of the reaction rate,
we made two assumptions that the reactive free chlorine species is HClO, but not ClO–, and that all of the Cr(III) species have a
similar reactivity to free chlorine. Based on these assumptions, the rate equation of the Cr(III) oxidation is written as
−d Cr(III)
d Cr(III) HClO
tot
tot
[ ]
= [ ] [ ],
t k1 (3)
where k1 is the oxidation rate constant and [Cr(III)]tot is
the total concentrations of Cr(III) (= [Cr(OH)2+] + [Cr(OH) 2+] +
[Cr(OH)3]). The HClO concentration [HClO] can be expressed
by the total concentration of free chlorine [ClO]tot (= [HClO] +
[ClO–]) with the acid dissociate constant, K
a, and hydrogen ion
concentration, [H+]; then, we obtain
−d Cr(III) ′
d Cr(III) ClO ,
tot
tot tot
[ ]
= [ ] [ ]
t k (4)
where k′ is the apparent rate constant at each pH, expressed as
′ +
+
k =k K
[ ] .
1/ 1
H
a
(5)
[ClO]tot (= 4 mg Cl dm–3) can be assumed to remain constant
during the Cr(III) oxidation reaction because of its higher concentration compared to the total chromium concentration (5 µg dm–3). Therefore, the reaction can be regarded as being pseudo-first order with respect to the Cr(III) concentration, and the integrated form of Eq. (4) is written as follows:9
ln[Cr(III)]tot = –k′t + const. (6)
By using this equation, the k′ values were obtained from the slope of the lines in Fig. 3.
At pH 5.0, the k′ value almost equals the k1 value, because
[H+] is more than one hundred times greater than K
a in Eq. (5).
By using the obtained k1 value, the k′ value at each pH was
simulated by Eq. (5); the results are shown as the solid line in Fig. 3. As shown in the figure, the observed rate constants could be well simulated by Eq. (5), indicating the validity of the assumptions made during the derivation of the equation.
The half-life times of the reaction were obtained from the k′ values to be 3.0, 3.3 and 14.4 h at pHs 5.0, 7.0 and 8.0,
Fig. 1 Effect of the solution pH on the residual concentration of HClO after bubbling the solution using N2 gas for 15 min. The initial NaClO concentration was 4 mg Cl dm–3.
Fig. 2 Time dependence of the Cr(III) oxidation at different pH values. , pH 5; , pH 7; , pH 8.
652 ANALYTICAL SCIENCES JUNE 2011, VOL. 27
respectively. The oxidation rate at pH 8 was fairly low compared to those at pHs 5.0 and 7.0. In addition, the pH of natural water is basically greater than 7, and the chlorination treatment using NaClO will make tap water become weakly alkaline.
Conclusion
Although the Cr species dissolved in tap water has been assumed to be Cr(VI), this is not exactly correct, because the kinetics are a function of the free chlorine concentration and the residence time of tap water. The conclusion was almost consistent with those already reported.8,10 They also emphasized the presence
of naturally occurring organics, which will rapidly decrease the concentration of the effective chlorine concentration. Speciation analyses of the dissolved Cr in chlorinated tap water are necessary to correctly assess the health risk to consumers. The SPS method developed in this study will be an effective tool for this purpose.
Acknowledgements
This work was partially supported by the JSPS Ronpaku Program (DGHE-10715) for S. S. (2009), and by Grant-in-Aids for Scientific Research (B), No. 19310011 (2007 – 2009) and No. 22310011 (2010 – 2012) for K. Y. from the Ministry of Education, Science, Sports and Culture, Japan, and by the Takaoka Chemical Company.
References
1. J. Kota’s and Z. Stasicka, Environ. Pollut., 2000, 107, 263. 2. A. M. Zayed and N. Terry, Plant and Soil, 2003, 249, 139.
3. World Health Organization, “Chromium in Drinking-water”, 2006, World Health Organization (WHO), Geneva.
4. Health Canada, Guidelines for Canadian Drinking Water Quality, Federal-Provincial-Territorial Committee on Health and the Environment, 2010.
5. J. C. Morris, J. Phys. Chem., 1966, 70, 3798.
6. G. C. White, “Handbook of Chlorination”, 2nd ed., 1986, Van Nostrand, Reinhold, New York.
7. H. Lai and L. S. McNeill, J. Environ. Eng., 2006, 132, 842. 8. D. Clifford and J. M. Chau, EPA Project Summary,
EPA/600/S2-87/100, Jan., 1988.
9. H. Jiang, L. Rao, Z. Zhang, and D. Rai, Inorg. Chim. Acta, 2006, 359, 3237.
10. N. S. Ulmer, EPA Project Summary, EPA/600/M-86/015, June, 1986.
11. W. Stumm and J. J. Morgan, “Aquatic Chemistry”, 3rd ed., 1996, Wiley-Interscience, New York.
12. S. Saputro, K. Yoshimura, K. Takehara, S. Matsuoka, and Narsito, Anal. Sci., 2009, 25, 1445.
13. A. Vogel, “Textbook of Quantitative Inorganic Analysis”, 1978, Longman, London.
14. U. Hase and K. Yoshimura, Anal. Sci., 1993, 9, 111. 15. S. Saputro, K. Takehara, K. Yoshimura, S. Matsuoka, and
Narsito, Electroanalysis, 2010, 22, 2768.
16. K. Yoshimura and H. Waki, Talanta, 1976, 23, 449. 17. K. Yoshimura and H. Waki, Talanta, 1985, 32, 345. 18. K. Yoshimura and S. Ohashi, Talanta, 1978, 25, 103. 19. S. Matsuoka, Y. Nakatsu, K. Takehara, S. Saputro, and K.
Yoshimura, Anal. Sci., 2006, 22, 1519.
20. A. J. Bard, R. Parsons, and J. Jordan (ed.), “Standard Potentials in Aqueous Solution”, 1985, Marcel Dekker, New York.