surrounding the Lore Lindu National Park in Central
Sulawesi, Indonesia
Maertens, Miet; Zeller, Manfred; and Birner, Regina
STORMA Discussion Paper Series
Sub-program A on
Social and Economic Dynamics in Rain Forest Margins
No. 4 (August 2002)
Research Project on Stability of Rain Forest Margins (STORMA)
Funded by the Deutsche Forschungsgemeinschaft under SFB 552
Participating institutions:
Institut Pertanian Bogor
Universitas Tadulako
University of Göttingen
Prof. Dr. Michael Fremerey
Institute of cultural and
Socio-economic Studies, University of Kassel,
Germany
Prof. Dr. Bunasor Sanim
Faculty of Economics, Bogor
Agricultural University, Indonesia
Dr. M.T. Felix Sitorus
Department of Socio-Economic Sciences,
Bogor Agricultural University, Indonesia
Prof. Dr. Manfred Zeller
Institute of Rural Development,
University of Göttingen, Germany
Managing editors
Dr. Siawuch Amini
Institute of cultural and
Socio-economic Studies, University of Kassel,
Germany
Dr. Regina Birner
Institute of Rural Development,
University of Göttingen, Germany
Dr. Günter Burkard
Institute of cultural and
Socio-economic Studies, University of Kassel,
Germany
Dr. Heiko Faust
Department of Geography, Division of
Cultural and Social Geography,
University of Göttingen, Germany
Explaining Agricultural Land Use in Villages surrounding
the Lore Lindu National Park in Central Sulawesi,
Indonesia
Maertens, Miet; Zeller, Manfred; and Birner, Regina
August 2002
Summary
This paper examines the causes of agricultural land expansion using an analytical Chayanovian model. We estimate the model empirically for the Lore Lindu area. The results show a high elasticity of cultivated area with respect to population. Improved technologies, favourable natural characteristics and lower transaction costs have a direct negative and an indirect positive effect on agricultural land expansion. The direct effect is likely to dominate in the short run when population is fixed and labour markets are imperfect while the indirect effect relates more to the long run with labour being more mobile between sectors due to migration.
Keywords: Land use change, deforestation, agricultural land expansion, land use modelling, village survey, GIS data, Indonesia.
Table of Contents
1. INTRODUCTION 2
2. THE SETTING 2
2.1. Increasing Agricultural Production and Decreasing Forest Resources 2
2.2. A Village Survey in the Lore Lindu Area 3
2.3. A Description of the Area 4
3. THEORETICAL FRAMEWORK FOR ANALYSING AGRICULTURAL
LAND USE 8
3.1. The Framework 8
3.2. The Effect of Exogenous Changes 10
3.4. The Effect of Population Growth 10
3.5. The Form of the Utility Function 11
4. EMPIRICAL MODEL 11
5. RESULTS 13
6. DISCUSSION 16
7. POLICY IMPLICATIONS 19
8. SOCIO-ECONOMIC LAND USE MODELLING 20
9. CONCLUSION 21
REFERENCE LIST 22
1. Introduction
Deforestation and forest degradation have been mentioned to take alarming proportions with severe negative global and regional consequences such as global warming, loss in biodiversity, soil erosion, desertification, etc. To act upon this and design appropriate policies it is fundamental to understand what is driving this deforestation. Explaining deforestation has been the focus of an increasing number of theoretical as well as empirical studies. Further empirical research on this topic, especially quantitative micro-level analysis, is necessary (Kaimowitz and Angelsen, 1998; Deininger and Minten, 1999). Understanding the deforestation process is imperative for the case of Indonesia since the country holds a vital share of the world’s remaining humid rainforest. Sulawesi is of particular interest because of its uniqueness in biodiversity that can only be sustained by preserving forest resources. In this paper we investigate agricultural land use in the villages surrounding the Lore Lindu National Park in Central Sulawesi, Indonesia. The aim of the paper is to understand the causes of agricultural land expansion in this area. Indirectly, we hope to contribute to the empirical evidence on the driving forces of deforestation and hence to the general understanding of this process. We develop a formal theoretical approach to guide our empirical analysis. This is essential since the lack of an explicit theoretical framework can cause misspecification of empirical models and misinterpretation of the results–as in previous socio-economic land use studies (Angelsen et al, 1999).
After this introduction we start with a brief overview of the macroeconomic environment and the description of the situation in the Lore Lindu area. The next chapter comprehends the analytical model and a theoretical discussion of the causes of agricultural land expansion. The fourth chapter deals with issues for empirical estimation of the model. The regression results are given in chapter five. In the following chapter we discuss the results and compare them with findings from the literature. We spell out the policy implication of our findings in chapter seven. In chapter 8 we give some critical remarks concerning socio-economic land use modelling. A last chapter concludes.
2. The Setting
2.1. Increasing Agricultural Production and Decreasing Forest
Resources
Pluijm, 1993). Over the past four decades paddy rice production increased from 12 to 51 thousand ton annually (Table 1). In the context of reducing the dependence on oil for export revenues after the oil shocks of the 1980’s growth in export crop production became important. Table 1 shows that the production of the main export crops increased considerably. Indonesia is now the world’s second largest producer of rubber (Information Centre for Natural Rubber, 2002); the third largest producer of cocoa (International Cocoa Organisation, 2002); and the fourth largest producer of coffee (International Coffee Organisation, 2002). Next to trade and price policies also rural policies such as the extension of the road network; the establishment of credit programs; increased investment in agricultural research combined with extension services; distribution of subsidized inputs etc. have supported this production growth. Despite increased yields per hectare stemming from technological progress, the growth in agricultural production has been associated with a vast expansion of the agricultural area (Table 1).
Table 1: Production and Area Harvested for Different Crops in Indonesia
Production (1000 ton) Area Harvested (1000 ha) 1961 1981 2001 1961 1981 2001
Paddy Rice 12.000 33.000 51.000 6.800 9.400 11.600
Coconut 5.600 9.320 17.000 1.130 1.890 2.800 Rubber 693 963 1.400 1.353 1.564 2.150 Coffee 103 315 390 182 527 981
Cocoa 1 13 340 7 23 360
Source: FAO
Indonesia has 60% of its total area under forest cover, representing 10% of all tropical forest in the world and nearly half of Asia’s remaining rainforest (FAO, 2002). However, during the last decade 1.3 million hectares of forest or 1.17% disappeared annually (FAO, 2002). This is among the highest rates of deforestation in the world.
2.2. A Village Survey in the Lore Lindu Area
geographical data combined in a geographical information system. The latter includes maps of administrative boundaries, road maps, and a digital elevation model with a resolution of 50 by 50 meters2. With this combination of socio-economic survey data and geographical data we can overcome certain data limitation problems encountered in previous studies.
Deforestation and land use change have been studied at different levels. There are various household and regional level analysis as well as cross-country studies (for an overview of these studies see Kaimowitz and Angelsen, 1998). We take the village as unit of analysis because this allows us to assess the impact of factors such as population growth, which is difficult at the household level. Also, other factors influencing land use are often fixed at the village level; e.g. agricultural prices, the available technology etc.
2.3. A Description of the Area
The Natural Environment
The Lore Lindu area is situated in the humid tropics–around 1° south of the equator– and consists of mountain ranges reaching up to 2500 meters interspersed with narrow and outstretched valleys at different elevations. There is a lot of disparity in climate in this area with rainfall varying from 500 to 2500 mm annually. The borders of the 5 districts are set along mountain ranges which makes them have quite distinct natural features.
Demographic Characteristics
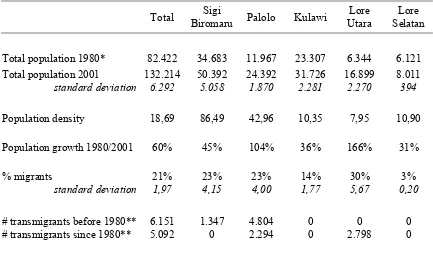
The region is demographically and culturally very diverse. Using the survey data, the actual population size was estimated at 132 thousand people and the overall population density at 18.69 per km² (Table 2). This is about 6 times lower than the Indonesian nation-wide population density of 116 per km2 (World Bank, 2001). However, there is a huge variation in demographic characteristics across the districts. The northern districts, Sigi Biromaru and Palolo are quite densely populated; 86 and 43 people per km² respectively. In the rest of the region population density is much lower, around 10 people per km². Over the past 20 years, total population grew with 60%. In the Palolo and the Lore Utara district population more than doubled in this time span while in the other districts population growth was around 30 to 40%. Migration, planned migration as well as spontaneous migration, contributes significantly to these high growth rates. Overall, migrants, defined as coming from another province, account for 21% of the total number of households (Table 2). The Lore Utara district has the largest share of migrants; 30%. More than 11 thousand people moved to this area as part of local resettlement and transmigration programs. Especially the districts Palolo and Lore Utara received a lot of transmigrates; the latter since 1980, the former mainly during the 70’s3 (Table 2).
Table 2: Demographic Characteristics per District
Total
Sigi
Biromaru Palolo Kulawi Lore Utara
Lore Selatan
Total population 1980* 82.422 34.683 11.967 23.307 6.344 6.121 Total population 2001 132.214 50.392 24.392 31.726 16.899 8.011
standard deviation 6.292 5.058 1.870 2.281 2.270 394
Population density 18,69 86,49 42,96 10,35 7,95 10,90
Population growth 1980/2001 60% 45% 104% 36% 166% 31%
% migrants 21% 23% 23% 14% 30% 3%
standard deviation 1,97 4,15 4,00 1,77 5,67 0,20
# transmigrants before 1980** 6.151 1.347 4.804 0 0 0 # transmigrants since 1980** 5.092 0 2.294 0 2.798 0
Source: STORMA A3 village survey and secondary data * Data source: Badan Pusat Statistik
** Data source: Departemen Transmigrasi, Department of social affairs, Forestry department, Badan Pembandayan Masyarakat
Land Use and Agricultural Cultivation
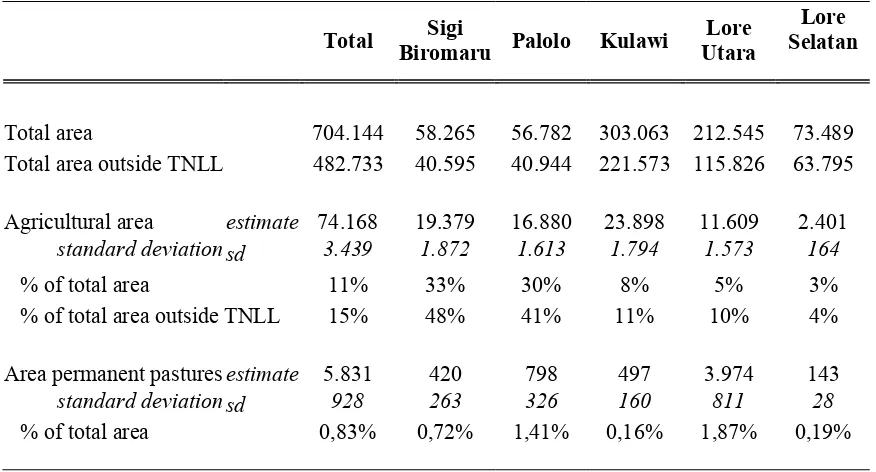
fields at all (13 villages). Overall, perennial crops take about half of the agricultural area but they are especially important in the districts Palolo and Kulawi where the area under perennials is twice as large as the area allocated to paddy rice. The remaining 20% of the agricultural area are fields with annual crops–mainly upland rice and corn–and home-gardens where different crops are mixed (figure 1). Pesticides and chemical fertilisers are used in 95% respectively 73% of the villages. Apart from a medium sized government farm meant for research and one large commercial tea plantation, there are no large scale plantations in the area. All agricultural land, including cocoa and coffee plantations, are in the hands of small-holders. Expansion of small scale farming is the most important source of deforestation in Indonesia (Sunderlin and Resosudarmo, 1996). This justifies our approach of focussing on agricultural land expansion as an indirect way of explaining deforestation. Such an indirect approach was also applied by Angelsen et al (1999) and Barbier and Burgess (1996).
Table 3: Land Use per District
Total
Sigi
Biromaru Palolo Kulawi Lore Utara
Lore Selatan
Total area 704.144 58.265 56.782 303.063 212.545 73.489 Total area outside TNLL 482.733 40.595 40.944 221.573 115.826 63.795
Agricultural area estimate 74.168 19.379 16.880 23.898 11.609 2.401
standard deviation sd 3.439 1.872 1.613 1.794 1.573 164
% of total area 11% 33% 30% 8% 5% 3% % of total area outside TNLL 15% 48% 41% 11% 10% 4%
Area permanent pastures estimate 5.831 420 798 497 3.974 143
standard deviation sd 928 263 326 160 811 28
% of total area
0,83% 0,72% 1,41% 0,16% 1,87% 0,19%
Source: STORMA A3 village survey and GIS data
Paddy rice 33%
Perennials 48% Annual crops
12%
[image:10.595.156.441.140.297.2]Garden 7%
Figure 1: Allocation of the agricultural area to different crops(Source: STORMA A3 Village Survey)
Infrastructure and Markets
Two main asphalt roads connecting the villages with the provincial capital pass through the research area. In the Sigi Biromaru district the road network is more extensive and almost all villages are connected through asphalt roads. In the other districts there are gravel roads connecting the villages with the main road. However, one fourth of the sampled villages–mainly in Kulawi and Lore Selatan–is not accessible by car. Some of these villages or up to two or three days travelling–by foot or by horse–from the nearest asphalt road. The access to roads and the distance to output markets is important with respect to land use change since they determine transaction costs related to marketing of agricultural produce and hence local agricultural prices. Farm households are pretty well integrated in output markets; selling virtually their complete coffee and cocoa harvests. Also corn is mainly destined for the market and on average one third of the rice production is sold4.
3. Theoretical Framework for Analysing Agricultural Land Use
Most analytical studies on agricultural land use and deforestation are based on either subsistence models or open-economy models (Kaimowitz and Angelsen, 1998). These two types of models differ a lot in the underlying assumptions and result in different explanations for agricultural land expansion (Angelsen, 1995). In subsistence models households are assumed to minimize labour to reach a predetermined level of consumption. Markets are assumed to be missing. Such models result in the ‘population approach’: population growth, a poor technology, bad soil characteristics etc. are considered as the major driving forces of deforestation. In open-economy models households are assumed to maximize profits facing a set of perfect markets. According to this approach -the ‘market approach’- the relative profitability of agriculture determines the area cultivated and deforested. Hence the two approaches lead to conflicting policy implications and are therefore extremely relevant. However, the assumptions on household behaviour and the functioning of markets, especially the labour market, in these models are rather unrealistic for the case of rural areas in developing countries. Therefore we use a Chayanovian model in which a representative household maximizes utility allowing for substitution between consumption and leisure. This is the standard formulation in the agricultural household literature (Singh et al, 1986; Deaton, 1997; Udry, 1997). An analytical approach using a Chayanovian type model was also developed by Angelsen (1999). However, instead of considering the distance of the agricultural frontier from the village centre as in Angelsen (1999) we consider the total cultivated area.Our model further differs from the model in Angelsen (1999) in the specification of the production function and the assumptions about the functioning of the labour market.
3.1. The Framework
We assume a representative household in the village to maximize utility, a concave function of consumption and leisure; U(c,l) with Ucl;Ulc >0. The household is involved in agricultural production for which we assume a Cobb Douglas production function, f , with a productivity shifter. Labour, L, and land, A, are the factors of production. The marginal return to both factors is positive, fL;fA >0 and decreasing,
0 ; AA <
LL f
the total available time, T to leisure and agricultural production. This leads to the following optimisation problem:
Maximize )U(c,l
With c= pf(L,A) and f(L,A)=S1S2LαAβ with 0≤α;β ≤1 1
= +β α
Subject to a time constraint: T =L+l+xAt with t >1 The Lagrangian function of the maximization problem is
) (
) ,
(c l T L l xAt
U + − − −
= θ
ψ
leading to the following first order conditions: 0 = − = ∂ Ψ ∂ θ l U l (1) 0 = − = ∂ Ψ ∂ θ L cpf U
L (2)
0 1 = − = ∂ Ψ
∂ t−
A
cpf txA
U
A θ (3)
From these three equations it follows that: L
c
l U pf
U =
=
θ (4)
1
−
= tA L
txA pf
pf (5)
The Lagrange multiplier θ can be interpreted as the shadow wage (Mas Colell et al, 1995). Equation (4) expresses that the household will allocate its time in such a way that both marginal utility from leisure and marginal utility from labour in agriculture are equal to the shadow wage. Equation (5) expresses that land and labour will be used till the marginal return to those factors are equalized.
Considering that f(L,A)=S1S2LαAβ it follows from equation (5) that: t txA L β α = (6)
Substituting θ with Ul and L with expression (6) in equation (3) and rearranging results in: pS S Y
U U A X l c
= 1 2 with 1 (1 )( 1) 0
1 >
= t− − t−
tx Y α α α β (7)
and 0
) 1 )( 1 ( 1 ) 1 ( 1 > − − = − − = t t X α β α
Assuming that all households in the village have the same preferences we can aggregate equation (7) over all households in the village5 and obtain an expression for the total village agricultural area, A_agr:
Y S pS U U H HA agr A
X
l c
=
= 1 2
_ (8)
with H the number of households in the village; and with X and Y as defined in equation (7).
3.2. The Effect of Exogenous Changes
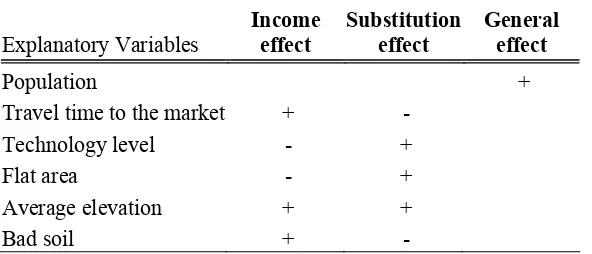
Within this framework it is now possible to explain how exogenous changes in prices p and technology S1 or differences in land suitability characteristics S2 will affect the village agricultural area. Since X >0, it follows directly from equation (8) that with an increase in agricultural prices, the cultivated area will increase. This is the so called ‘substitution effect’: when agriculture becomes more profiTable households will substitute leisure for labour and increase the amount of land cultivated (Van Rompuy et al, 1991; Kaimowith and Angelsen, 1998; Angelsen, 1999). However, there is a second effect that will dampen or even reverse this ‘substitution effect’. Due to higher agricultural prices, income and hence consumption will rise and will reduce the (absolute value of the) marginal rate of substitution between consumption and leisure, −Uc Ul . According to equations (8) and (6) this causes a decrease in the agricultural area; a decrease in the labour allocated to agriculture; and an increase in the amount of leisure. This is the ‘income effect’: with increasing agricultural prices, income increases and households can reach a higher level of utility by increasing both consumption and leisure (Van Rompuy et al, 1991; Kaimowitz and Angelsen, 1998; Angelsen, 1999). So, the ultimate effect of the price increase on agricultural area depends on the form of the utility function.
We elucidated the effect for the case of a price increase but the same reasoning can be made for changes in S1 or S2. Higher agricultural prices, a better technology and better land suitability characteristics will have a positive ‘substitution effect’ and a negative ‘income effect’ on the area cultivated.
3.4. The Effect of Population Growth
3.5. The Form of the Utility Function
The effect of exogenous changes on the area cultivated depends on the form of the utility function; or more precisely on the marginal rate of substitution between consumption an leisure, −Uc Ul . When people are poor and living close to subsistence levels of consumption, they are willing to give up a large amount of leisure in order to increase consumption. In this case, Uc Ul will drop (rise) sharply with an increase (decrease) in consumption. This will cause the ‘income effect’ to prevail above the ‘substitution effect’ and the agricultural area will decrease with increasing agricultural prices, a better technology and better land characteristics. This is the same outcome as in the population approach using subsistence models. If consumption and leisure are prefect substitutes then Uc Ul =Cte. In this extreme case, the ‘income effect’ will be zero and there is only a ‘substitution effect’ that causes the agricultural area to increase with increasing prices and productivity. This is the same result as in open-economy models. Leisure and consumption are more likely to be substitutes when labour markets are well functioning since labour can then be seen as any other consumption good. The final effect of exogenous changes depends on the marginal rate of substitution between consumption and leisure that on its turn depends on household’s preferences and the functioning of the labour market.
4. Empirical Model
The Empirical Model
The theoretical model outlined in the previous section resulted in an expression for the village agricultural area as a function of village population, agricultural prices, land suitability characteristics, agricultural technology, etc. Taking natural logarithms of equation (8) leads to the following:
=
) _
ln(A agr ln( ) ln( ) Xln(p) Xln(S1) Xln(S2) ln(Y) U
U X H
l
c + + + +
+ (9)
We assume that differences in village level agricultural prices are related to differences in transaction costs: 1
0
γ
γ Trans
p= with γ1 <0indicating that prices decrease with increasing transaction costs (von Thünen, 1966). Substituting this expression for agricultural prices in equation (9); bringing together all constant terms; and combining unobservable household and village characteristics in an error term gives the following equation that can be estimated econometrically:
u S
S Trans
H agr
A_ ) 0 1ln( ) 3ln( ) 4ln( 1) 5ln( 2) 6
ln( =α +α +α +α +α +α (10)
Variables and Expected Effects
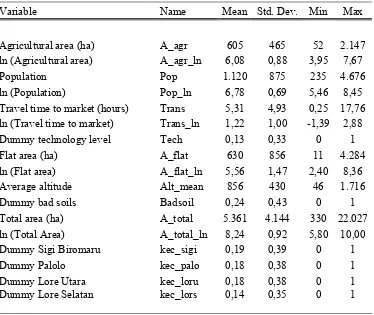
explanatory variables represents the land suitability characteristics,S2. From a digital elevation model we calculated for each village the average altitude, Alt_mean; and the natural logarithm of the area outside the National Park with a slope lower than 3 degrees, A_ flat_ln. Since villages at a higher elevation tend to be larger, we include the natural logarithm of the total village area, A_total_ln. Unfortunately we have no detailed data on climate and soil conditions. Since climate characteristics are peculiar for the different districts, we include district dummies to control for this. Soil conditions vary mainly with topographic characteristics, which we already allow for. In addition we include a dummy variable,Badsoil, that equals 1 if the village has more than 20 hectares alang-alang–a grass that grows on acid soils.
Table 4: Overview of Variables in the Model
Variable Name Mean Std. Dev. Min Max
Agricultural area (ha) A_agr 605 465 52 2.147 ln (Agricultural area) A_agr_ln 6,08 0,88 3,95 7,67 Population Pop 1.120 875 235 4.676 ln (Population) Pop_ln 6,78 0,69 5,46 8,45 Travel time to market (hours) Trans 5,31 4,93 0,25 17,76 ln (Travel time to market) Trans_ln 1,22 1,00 -1,39 2,88 Dummy technology level Tech 0,13 0,33 0 1 Flat area (ha) A_flat 630 856 11 4.284 ln (Flat area) A_flat_ln 5,56 1,47 2,40 8,36 Average altitude Alt_mean 856 430 46 1.716 Dummy bad soils Badsoil 0,24 0,43 0 1 Total area (ha) A_total 5.361 4.144 330 22.027 ln (Total Area) A_total_ln 8,24 0,92 5,80 10,00 Dummy Sigi Biromaru kec_sigi 0,19 0,39 0 1 Dummy Palolo kec_palo 0,18 0,38 0 1 Dummy Lore Utara kec_loru 0,18 0,38 0 1 Dummy Lore Selatan kec_lors 0,14 0,35 0 1
Source: STORMA A3 village survey and GIS data
Table 5: Expected Effects on Agricultural Land Use
Explanatory Variables
Income effect
Substitution effect
General effect
Population +
Travel time to the market + - Technology level - + Flat area - + Average elevation + +
Bad soil + -
Issues for Empirical Estimation
We estimate equation (10) using OLS. One of the 80 observations is dropped due to missing values. The Variance Inflation Factors indicate that there is no problem of multicollinearity. Using the Breusch-Pagan test the homoskedasticity-hypothesis could not be rejected at the 1% significance level.
Population can not be treated as endogenous in our model. Population levels are likely to be higher in areas that are more suited for agricultural cultivation or where market access is better. Population and agricultural land use are likely to be influenced by the same set of explanatory variables and would be jointly determined or be interdependent. Statistically, we deal with this problem using instrumental variable estimation. As instruments for population we use the following variables: the number of years certain facilities –pumped or piped water, electricity, a doctor, and a junior high school- are in the village and the year the village was established. These variables are highly correlated with population and have no direct impact on agricultural land use. The endogenous character of population calls for caution in the interpretation of the results.
District dummies were included in the model to control for differences in climate. However, these dummies encompass variability in other factor as well, e.g. travel time to the market. Therefore we estimate the model with and without these district dummies. We have three different regression specifications (Table 6). Specification 1 is the OLS regression with district dummies. Specification 2 is the IV regression with district dummies and specification 3 is the IV regression without district dummies.
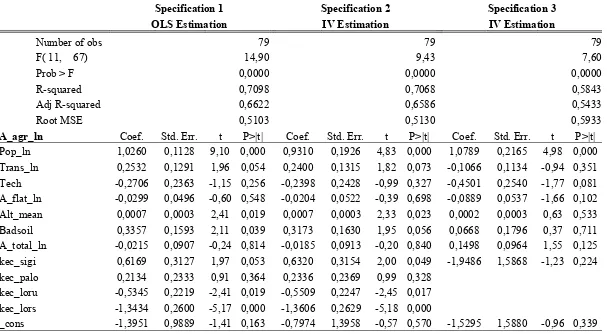
5. Results
The regression results are reported in Table 6. The overall performance of the model is quite good with an adjusted R² between 0.66 and 0.54 for the different estimations. In all three specifications, the ‘all-coefficients-zero’-hypothesis can be rejected at the 1% significance level. The estimated coefficients in specification 1 are not much different than those in specification 2, which is an indication of the robustness of the results.
Table 6: Regression Results
Specification 1 Specification 2 Specification 3
OLS Estimation IV Estimation IV Estimation
Number of obs 79 79 79
F( 11, 67) 14,90 9,43 7,60
Prob > F 0,0000 0,0000 0,0000
R-squared 0,7098 0,7068 0,5843
Adj R-squared 0,6622 0,6586 0,5433
Root MSE 0,5103 0,5130 0,5933
A_agr_ln Coef. Std. Err. t P>|t| Coef. Std. Err. t P>|t| Coef. Std. Err. t P>|t| Pop_ln 1,0260 0,1128 9,10 0,000 0,9310 0,1926 4,83 0,000 1,0789 0,2165 4,98 0,000 Trans_ln 0,2532 0,1291 1,96 0,054 0,2400 0,1315 1,82 0,073 -0,1066 0,1134 -0,94 0,351 Tech -0,2706 0,2363 -1,15 0,256 -0,2398 0,2428 -0,99 0,327 -0,4501 0,2540 -1,77 0,081 A_flat_ln -0,0299 0,0496 -0,60 0,548 -0,0204 0,0522 -0,39 0,698 -0,0889 0,0537 -1,66 0,102 Alt_mean 0,0007 0,0003 2,41 0,019 0,0007 0,0003 2,33 0,023 0,0002 0,0003 0,63 0,533 Badsoil 0,3357 0,1593 2,11 0,039 0,3173 0,1630 1,95 0,056 0,0668 0,1796 0,37 0,711 A_total_ln -0,0215 0,0907 -0,24 0,814 -0,0185 0,0913 -0,20 0,840 0,1498 0,0964 1,55 0,125 kec_sigi 0,6169 0,3127 1,97 0,053 0,6320 0,3154 2,00 0,049 -1,9486 1,5868 -1,23 0,224 kec_palo 0,2134 0,2333 0,91 0,364 0,2336 0,2369 0,99 0,328
kec_loru -0,5345 0,2219 -2,41 0,019 -0,5509 0,2247 -2,45 0,017 kec_lors -1,3434 0,2600 -5,17 0,000 -1,3606 0,2629 -5,18 0,000
_cons -1,3951 0,9889 -1,41 0,163 -0,7974 1,3958 -0,57 0,570 -1,5295 1,5880 -0,96 0,339
6. Discussion
Population
Since the regression is specified log-log for the variable population, the coefficient can be interpreted as the elasticity of the cultivated area with respect to population. This elasticity is 0.93 meaning that a 1% increase in population leads to a 0.93% increase in area cultivated (Table 6, specification 2). There is a lot of evidence of a high correlation between population and agricultural expansion or forest cover loss from studies at different levels of aggregation. Barbier and Burgess (1997) made a cross-country study including 53 tropical countries. They find that a 1% increase in population causes a 0.03% increase in forest clearing over the period 1980-85. In a regional level panel study on agricultural land expansion in Tanzania Angelsen et al. (1999) find an elasticity of agricultural area with respect to population of 0.6. Barbier and Burgess (1996) did a state level analysis in Mexico and find an elasticity of 0.23. Compared to these figures, the elasticity of agricultural area with respect to population that we find for the Lore Lindu area is quite high. This is due to the difference in aggregation level. Our study is limited to a relatively small rural area while regional or provincial level studies incorporate also urban centres where population growth is high but does not contribute to land expansion. The high positive effect of population on agricultural land use is also related to the fact that land is still fairly abundant in the Lore Lindu area.
Despite the evidence, the role of population in driving agricultural land expansion and deforestation is much debated in the literature. It is argued that high correlations between population and forest cover loss might be incidental rather than causal or might be spurious due to aggregation bias in the data and failure to account for other unobserved effects (Sunderlin and Resosudarmo, 1996; Deinginer and Minten, 1999; Angelsen et al, 1999).
Technology
Our results show that an improved agricultural technology, namely a better irrigation system, reduces the area cultivated. This is in line with results from previous empirical studies. Deininger and Minten (1999) find that irrigation and access to extension services has significantly reduced deforestation in the 1980’s for Mexican municipalities. Mertens et al (2000) show that increased use of chemical inputs has cut down deforestation in the period 1986-1996 for villages in South Cameroon. Shively and Martinez (2001) did a farm level study in 2 communities in Southern Palawan and observe that the establishment of irrigation has reduced annual forest clearing with 48%. However, there are also studies that point to an opposite result. In a study on Tanzania Angelsen et al (1999) demonstrate a positive association between per capita fertilizer use and agricultural expansion.
Distance to markets and natural land characteristics
following observation. We classified the villages in travel time terciles and calculated that chemical fertilizers are used in 100% of the villages close to the market; in 92% of the villages further from the market and in 30% of the villages far from the market. Our results demonstrate that agricultural land expansion is positively related with distance to the market and negatively related with the natural suitability of land for cultivation. These effects are opposite to what is mostly found in the literature. Physio-geographic land characteristics and plot level indicators for distances to villages and markets are among the main explanatory variables in spatial land use models. The results from such studies show that the probability of agricultural land use or deforestation is higher if land suitability characteristics are better and access to the market is better. However, in those studies population is measured at a much larger scale –district or regional level- than the other variables in the model –plot or pixel level (e.g. in Cropper et al, 2001; and Deininger and Minten, 2001) or is omitted at all (e.g. in Nelson et al, 2001; Nelsen and Hellerstein, 1997; and Chomitz and Gray, 1996). The results from these spatial models are supported by evidence from some non-spatial empirical studies. Deininger and Minten (1999) find that natural land suitability and marketing infrastructure is positively respectively negatively related with deforestation at the municipality level in Mexico. They do not take into account population in the analysis. In a farm level analysis of settler households in the Brazilian Amazon Pichon (1997) indicates that higher land fertility and better market access results in more forest clearing. Regional and village level studies that do account for demographic characteristics come to different results. Barbier and Burgess (1996) show that road density has no significant effect on expansion of the agricultural area in a state level analysis in Mexico. In a village level analysis of deforestation in South Cameroon Mertens et al (2001) demonstrate that distance to the market significantly increases deforestation. The latter is the same result as we find for the Lore Lindu area.
There is not much evidence from land use studies explicitly including natural land characteristics that supports our observed results. Along with the applied technology, natural land characteristics largely determine agricultural yields. Therefore measuring the effect of higher yields on agricultural land use can be seen as an indirect way of assessing the impact of natural land characteristics. Barbier and Burgess (1997) show a negative association between forest conversion and yields in a cross-country study. Godoy et al (1997) find the same result at the household level for Honduras. This is in line with our findings that better land characteristics and hence higher yields lead to less agricultural land expansion.
There is no consensus on how market access and natural land characteristics influence land use. The outcome of empirical land use studies seems to depend a lot on the selection of explanatory variables and the scale at which those are measured.
Short term versus long term effects
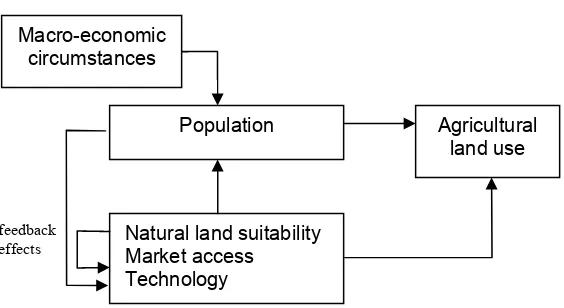
Figure 2: Conceptual Framework
First; technology, market access and land characteristics have a direct impact on agricultural land use. We estimated this impact to be negative for the case of the Lore Lindu area: improved technology, lower travel time to the market, and better land characteristics have a direct negative impact on agricultural land use. Second, market access and land characteristics–and to a lesser extent also technology–are important determinants of population levels since a high (expected) productivity and profitability of agricultural cultivation is a pull factor in the rural-to-rural migration process. In our sample, village population density is negatively correlated with travel time to the market (R=0.41); positively correlated with the percentage of flat land in the village (R=0.58); and negatively correlated with the average village elevation (R=0.75). In addition, push factors are important in the rural migration process and hence local population levels are also influenced by the rest of the economy. Third, population influences land use. Theory as well as empirical evidence–from our study as well as from many others–indicate that a higher population increases the area cultivated. Hence, market access and land characteristics have an indirect impact on land use. A better accessibility and favourable natural conditions increase population and consequently the area cultivated.
The distinction between direct effects (lower left part of figure 2) and indirect effects (upper right part of figure 2) can be related to the time horizon of analysis and to the assumptions in different theoretical models. The direct effect is likely to dominate in the short run while the indirect effect relates more to the long run. In the short term population is fixed and labour markets are imperfect due to labour being immobile between sectors. In the long term, labour markets function better because migration makes labour mobile. The difference between the subsistence and the open economy approaches is also a reflection of the time horizon: the open economy model with perfect labour markets is more relevant for the study of long term effects (Angelsen, 1995). To give appropriate policy recommendations it is imperative to understand both, short term and long term effects.
Our results deviate from other results in the literature as regards the direction of the impact of market access and land characteristics on land use. There are two explanations for this (apparent) contradiction. First, the negative impact we find is caused by a high ‘income effect’ of household behaviour, which is a result of subsistence oriented household preferences and/or missing off-farm labour markets
Population
Natural land suitability Market access Technology
Agricultural land use Macro-economic
circumstances
(see chapter 8). However, it might be that in other areas with better functioning labour markets and/or higher income levels the ‘substitution effect’ prevails above the ‘income effect’ and that consequently market access and favourable natural characteristics have a direct positive impact on agricultural land use, even in the short run. Second, by omitting population as an explanatory variable from empirical land use models, the direct short term effects and the long term indirect effects are merged. This is what is mostly done in spatial land use models. This approach is valid if the purpose is to estimate where deforestation is likely to occur (e.g. for spatial planning or selection of areas to be protected) (Kaimowitz and Angelsen, 1998; Lambin, 1994) but it contributes little to the insight why deforestation is taking place.
Finally, we explain the feedback effects in figure 2. The placement of roads and other government infrastructure projects is not random but likely to be influenced by demographic and physio-geographic characteristics (Pitt et al, 1993). From the induced innovation literature we know that technological change can be induced by changes in relative prices, population growth, etc. (Ruttan, 1986). All this causes feedback effects between population, market access and technology. We were unable to consider these effects in our cross-sectional analysis of land use. An important drawback of this is that we only included one indicator for technology–technical irrigation–in our analysis. The infrastructure for technical irrigation is built by the government in special irrigation projects for which the placement depends a lot on the geographical location with respect to rivers. The presence of a technical irrigation system could therefore (to some extent) be considered as exogenous in our land use model. The impact of other technologies such as chemical inputs, mechanization, etc. on land use should be studied in a dynamic framework.
7. Policy Implications
The population approach, resulting from subsistence models, considers technological improvement and control of population levels to be key in preventing further deforestation (Angelsen et al, 1999). Open economy models and the market approach, on the other hand, emphasize the importance of economic development outside the agricultural sector and point to the counter-productive effect of agricultural intensification on deforestation (Angelsen et al, 1999). The intermediate approach we applied and the results from our empirical analysis imply a deliberate mixture of those strategies.
The very high elasticity of agriculture land use with respect to population calls for control of population growth in remaining forested areas. Attention should be put towards the broader economy for creating better economic opportunities and alternative employment, especially in areas characterized by heavy emigration and so attenuate the push factors for rural migration.
improved. This would reduce pressure on forests by lowering transaction costs in already populated areas. At the same time, this could benefit rural incomes and reduce poverty.
Contrarily to what the market approach reasons, our results indicate that there is a potential for reducing deforestation by improving agricultural technology. Especially the establishment of irrigation systems could benefit the environment in the Lore Lindu area. Since technical improvement increases productivity, there could be a win-win situation for reaching environmental goals and economic growth.
Areas where the environment is less suited for agricultural production are less populated but unfavourable natural conditions cause agricultural land expansion because farmers compensate for a lower productivity by taking more land into cultivation. This observation makes land use planning with zoning and control of human settlement a rational policy from an environmental perspective. In addition, establishment of protected areas with entry restrictions could limit immigration and indirectly reduce pressure on forests.
8. Socio-Economic Land Use Modelling
In the theoretical discussion it was argued that the final effect of exogenous changes on agricultural land use depends on the marginal rate of substitution between consumption and leisure, which depends on households preferences and the functioning of the labour market. Our results indicate that the ‘income effect’ of household behaviour prevails above the ‘substitution effect’, especially in the short run. This could mean that households in this area are living close to subsistence levels of consumption or that they have high preferences towards leisure and are not really interested in increasing consumption above subsistence needs. However, we feel like this is both very unlikely. First, although there is poverty in this area, the problem is not that severe that it would completely determine our results. Second, farmers in the area are very well integrated in output markets and can trade their agricultural produce for other consumption goods, which makes subsistence type preferences very doubtful. The large ‘income effect’ observed is more likely to be the result of thin or missing off-farm labour markets.
land use changes, especially when it concerns rural areas of developing countries where labour market are often highly imperfect.
9. Conclusion
Reference List
Angelsen, A., 1995.Shifting Cultivation and "Deforestation”: A Study from Indonesia, World Development, 23(10): 1713-29.
Angelsen, A., 1999.Agricultural Expansion and Deforestation: Modelling the Impact of Population, Market Forces and Property Rights, Journal of Development Economics, 58(1): 185-218.
Angelsen, A., and D. Kaimowitz, 2001. Agricultural Technology and Forests: a Recapitulation,pp 383-402, Agricultural Technologies and Tropical Deforestation,Angelsen, A., and D. Kaimowitz, 2001. CABI Publishing/CIFOR, New York/Jakarta.
Angelsen, A., Shitindi, E.F.K., and J.Aarrestad, 1999.Why Do Farmers Expand Their Land into Forests? Theories and Evidence from Tanzania, Environment and Development Economics
4(3): 313-31.
Angelsen, A., van Soest, D., Kaimowitz, D., and E. Bulte, 2001. Technical Change and Deforestation: a Theoretical Overview, pp 19-34,Agricultural Technologies and Tropical Deforestation, Angelsen, A., and D. Kaimowitz, 2001. CABI Publishing/CIFOR, New York/Jakarta.
Angelsen, A., and D.Kaimowitz, 2001.Introduction: the Role of Agricultural Technologies in Tropcial Deforestation, pp 1-17,Agricultural Technologies and Tropical Deforestation,Angelsen, A.,
and D. Kaimowitz, 2001. CABI Publishing/CIFOR, New York/Jakarta.
Bakosurtanal, 1998. Peta Rupabumi Indonesia skala 1:25,000, Badan Koordinasi Survey dan Pemetaan Nasional, Jakarta.
Bappeda, 2000. Analisa Peta Dasar Neraca Lahan Kabupten Donggala, Badan Perencanaan Pembangunan Daerah Kabupaten Donggala dan Kantor Pertanahan Kabupaten Donggala, Palu.
Barbier, E.B., and J.C. Burgess, 2001.The Economics of Tropical Deforestation,Journal of Economic Surveys, 15(3): 413-33.
Barbier, E.B., 1989.Cash Crops, Food Crops, and Sustainability: The Case of Indonesia,World Development,17(6): 879-95.
Barbier, E.B., and J.C. Burgess, 1996.Economic Analysis of Deforestation in Mexico,Environment and Development Economics,1(2): 203-39.
Barbier, E.B., and J.C. Burgess, 1997.The Economics of Tropical Forest Land Use Options,Land Econmics,73(2): 174-95.
Chomitz, K.M., and D.A. Gray, 1996.Roads, Land Use, and Deforestation: A Spatial Model Applied to Belize,World Bank Economic Review,10(3): 487-512.
Contreras-Hermosilla, A., 2000.The Underlying Causes of Forest Decline,CIFOR occasional paper No 1, Centre for International Forestry Research, Jakarta.
Cropper, M., J. Puri, and C. Griffiths, 2001.Predicting the Location of Deforestation: The Role of Roads and Protected Areas in North Thailand,Land Economics, 77(2): 172-86.
Damodar, G., 1999.Essentials of Econometrics. Irwin/McGraw-Hill, Boston.
Deaton, A., 1992.Understanding Consumption.Oxford University Press, New York.
Deaton, A., 1997.The Analysis of Household Surveys: A Microeconomic Approach to Development Policy. John Hopkins University Press, Washington DC.
Deininger, K.W., and B. Minten, 1999.Poverty, Policies, and Deforestation: The Case of Mexico,
Economic Development and Cultural Change,47(2): 313-44.
Deininger, K.W., and B. Minten, 2002. Determinants of Deforestation and the Economics of Protection: An Application to Mexico. Unpublished.
Dirkse, J.-P., 1993. Development and Social Welfare: Indonesia's Experiences under the New Order.
Dirkse, Jan-Paul. KITLV Press, Leiden.
FAO, 2001. FAO Statistical Databases 2001, FAO, Rome.
Godoy, R.R., 1997.Household Determinants of Deforestation by Amerindians in Honduras,World Development,25(6): 977-87. Hyde, W.F., Amacher G.S., and W. Magrath, 1996.
Deforestation and Forest Land Use: Theory, Evidence, and Policy Implications,World Bank Research Observer,11(2): 223-48.
Information Centre for Natural Rubber, 2002. http://www.rubber-stichting.ind.tno.nl
International Coffee Organisation, 2002. http://www.ico.org
Jayasuriya, S., 2002.Agriculture and Deforestation in Tropical Asia: an Analytical Framework,pp 317-34, Agricultural Technologies and Tropical Deforestation,Angelsen, A., and D. Kaimowitz, 2001. CABI Publishing/CIFOR, New York/Jakarta.
Kaimowitz, D., and A. Angelsen, 1998. Economic Models of Tropical Deforestation. A Review,
Centre for International Forestry Research, Jakarta.
Mas-Colell, A., Whinston, M.D., and J.R. Green, 1995.Microeconomic Theory, Oxford University Press, New York.
Mertens, B., 2000.Impact of Macroeconomic Change on Deforestation in South Cameroon: Integration of Household Survey and Remotely-Sensed Data,World Development,28(6): 983-99.
Nelson, G.C., Harris, V., and S.W. Stone, 2001.Deforestation, Land Use, and Property Rights: Empirical Evidence from Darien, Panama,Land Economics,77(2): 187-205.
Nelson, G.C., and D. Hellerstein, 1997.Do Roads Cause Deforestation? Using Satellite Images in Econometric Analysis of Land Use,American Journal of Agricultural Economics,79(1): 80-88.
Pichon, F.J., 1997.Colonist Land-Allocation Decisions, Land Use, and Deforestation in the Ecuadorian Amazon Frontier,Economic Development and Cultural Change,45(4): 707-44.
Pitt, M.M., Rosenzweig, M.R., and D.M. Gibbons, 1993.The Determinants and Consequences of the Placement of Government Programs in Indonesia,World Bank Economic Review7(3): 319-48.
Ruttan, V.W., 1986. Technical Change and Innovation in Agriculture, pp 333-56, The Positive Sum Strategy: Harnessing Technology for Economic Growth, Landau, L., and N. Rosenberg, 1986. National Academy Press, Washington DC.
Shively, G., and E. Martinez, 2001.Deforestation, Irrigation, Employment and Cautious Optimism in Southern Palawan, the Philippines, pp 335-46.Agricultural Technologies and Tropical Deforestation,Angelsen, A., and D. Kaimowitz, 2001. CABI Publishing/CIFOR, New York/Jakarta.
Singh, I., Squire L., and J. Strauss, 1986.Agricultural Household Models. Extensions, Applications and Polic,John Hopkins University Press, Baltimore.
Sonderforschungsbereich 552, 1999. Stabilität von Randzonen Tropischer Regenwälder in Indonesian - Finanzierungsantrag für die Jahre 2000/2-2003/1 (Stability of rainforest margins in Indonesia - Application for funding 200-2003), Göttingen.
Southgate, D., Sierra R., and L. Brown, 1991.The Causes of Tropical Deforestation in Ecuador: A Statistical Analysis, World Development,19(9): 1145-51.
Sunderlin, W., and A.P. Resosudarmo, 2002. Rates and Causes of Deforestation in Indonesia: Towards a Resolution of the Ambiguities, CIFOR Occasional Paper No 9, Centre for International Forestry Research, Jakarta.
Thorbecke, E., and T. van der Pluijm, 1993.Rural Indonesia: Socio-Economic Development in a Changing Environment, New York University Press, New York.
Udry, C., 1997.Recent Advances in Empirical Microeconomic Research in Poor Countries: An Annotated Bibliography,Journal of Economic Education,28(1): 58-75.
van Rompuy, P., Berlage, L., De Bruyne, G., De Grauwe, P., Heremans, D., Moesen, W., Peeters, T., Schokkaert, E., and K. Tavernier, 1991. Inleiding tot de Economie,: Leuven University Press, Leuven.
von Amsberg, J., 1998.Economic Parameters of Deforestation,World Bank Economic Review,12(1): 133-53.
von Thünen, 1996.Der Isolierte Staat in Beziehung auf Landwirtschaft und Nationalökonomie..
World Bank, 2001.World Development Indicators 2001,The World Bank Group, Washington DC.
Coordinates of the Authors:
Miet Maertens: principal author and corresponding author Institute of Rural Development
Georg-August University Goettingen Waldweg 26
37073 Goettingen
tel: 0049-551-395668, fax: 0049-551-393076 email: mmaerte@gwdg.de
Manfred Zeller: co-author Institute of Rural Development Georg-August University Goettingen Waldweg 26
37073 Goettingen
tel: 0049-551-393901, fax: 0049-551-393076 email: m.zeller@agr.uni-goettingen.de Regina Birner: co-author
Institute of Rural Development Georg-August University Goettingen Waldweg 26
37073 Goettingen
tel: 0049-551-393906, fax: 0049-551-393076 email: rbirner@gwdg.de
1
There are 4 universities involved in the project: Georg-August University Goettingen; University of Kassel; Institut Pertanian Bogor; and Universitas Tadulako Palu. The project is funded by the Deutsche Forschungsgemeinschaft and is referred to as Sonder Forschungsbereich 552 or STORMA –‘Stability of Rainforest Margnal Areas’.
2
The digital elevation model was constructed using 1:25,000 scale topographic maps from Bakosurtanal.
3
Out-migration is not significant in this area. We estimated that over the last 20 years 1381 people migrated out of the area, which is 1.6% of the total 1980 population.
4
This figure has to be interpreted with care. It is often the case that farmers sell part of their rice harvest to fulfil immediate cash requirements but later they are forced to buy rice at market prices.
5
Aggreagtion of the behaviour of a representative agent is a valuable way to include microeconomic behaviour into aggregate issues (Deaton, 1992).
6
This can happen either through a direct increase in the household’s labour force or indirectly through the agricultural labour market for which wages are endogenous.
7