doi: 10.3926/ j iem .2009.v2n1.p128- 152 © © JI EM, 2009 – 2( 1) : 128- 152 - I SSN: 2013- 0953
The roles of communication process for an effective lean
manufacturing implementation
Perumal Puvanasvaran
1; Hamdan Megat
2; Tang Sai Hong
2; Muhamad Mohd.Razali
11
University Technical Malaysia (MALAYSIA);
2University Putra Malaysia (MALAYSIA)
[email protected]
;
[email protected]
;
[email protected]
Received October 2008 Accepted March 2009
Abstract:
Many companies are implementing lean manufacturing concept in order to
remain competitive and sustainable, however, not many of them are successful in the
process due to various reasons. Communication is an important aspect of lean process in
order to successfully implement lean manufacturing. This paper determines the roles of
communication process in ensuring a successful implementation of leanness in
manufacturing companies. All the information of lean manufacturing practices and roles of
communication in the implementation were compiled from related journals, books and
websites. A study was conducted in an aerospace manufacturing in Malaysia. A five-point
scale questionnaire is used as the study instrument. These questionnaires were distributed
to 45 employees working in a kitting department and to 8 top management people. The
results indicate that the degree of leanness were moderate.
Keywords: leanness, communication process, aerospace company
1 Introduction
I nterest in the concept of lean production or lean m anufacturing has grown and gained attention in the literature and in practice ( Soriano- Meier et al., 2002 and
Karlsson et al., 1996) . Many organizations have em ployed lean m anufacturing
doi: 10.3926/ j iem .2009.v2n1.p128- 152 © © JI EM, 2009 – 2( 1) : 128- 152 - I SSN: 2013- 0953
United Kingdom organizations have accom plished lean m anufact uring im plem entation successfully. A num ber of variables m ay have im pacts on lean im plem entation, and m anagem ent support plays an im portant role in a lean m anufacturing im plem entation (Worley et al., 2006) . However, since lean
im plem entation involves em ployees at all levels, t here is a need for a good com m unication process to enable a sm ooth flow of the process. One of the m ain challenges of com m unication is t o ensure that the changes are being readily accepted and im plem ented by everyone at all levels.
Karlsson et al. ( 1996) stated that lean should be seen as a direction and the focus
lies on the change in the determ inants. The determ inants that are able to reflect changes in an effort to becom e lean had been identified by Karlsson et al. ( 1997) .
I t is essent ial t o note t hat lean product ions viewed a com plex organizat ional principle that requires m aj or changes in a com pany ( Mathaisel et al., 2000) .
Hence, t here is a posit ive relat ionship between invest m ent s in t he supporting m anufacturing infrastructure and actual changes towards lean m anufacturing ( Soriano- Meier et al., 2002) .
1.1 Problem Statement
The com pany claim s to have im plem ented lean m anufact uring for about two years. The lean m anufacturing practices that had been carried out are Continuous I m provem ent , 5’s and General Visual Managem ent , Cellular Manufact uring, Value St ream Mapping, Tot al Product ive Maint enance and Pull Product ion. Although m anagem ent declared huge support for these practices, it has been noted that the com m unicative aspect is not em phasized in the im plem entation of leanness.
doi: 10.3926/ j iem .2009.v2n1.p128- 152 © © JI EM, 2009 – 2( 1) : 128- 152 - I SSN: 2013- 0953
1.2 Objective
The overall obj ective of this st udy is to evaluate the degree of leanness and com m unicative process em ployed in the im plem entation of leanness. The specific obj ectives of this study are:
To determ ine the degree of adoption of lean production principles in the organization.
To determ ine the level of com m unication process that supports m anufacturing infrastructure to becom e lean.
1.3 Significant of the study
The result s of t his st udy will show t he degree of leanness im plem ent ed in t he com pany and the roles played by com m unication process in lean im plem entation. This will help t he com pany t o ident ify t he problem s in t he im plem ent at ion of an effective lean m anufact uring system . I t can provide answers to questions such as: “ How com m unication process can support leanness?” , “ Where should we pay m ore attention to im prove better com m unication of leanness im plem entation?” and “ What should be done for a better com m unication in the im plem entation of lean process?” Consequent ly, t he com pany is able t o im prove and sustain t heir lean m anufacturing perform ance through a system atic com m unicative approach. Thus, it will increase and m aint ain com pany’s com pet it iveness in the indust ry. Besides that, a successful lean im plem entation by the com pany, supported by a system atic com m unicative approach will prom ot e t he lean m anufact uring t o ot her indust ries in Malaysia.
1.4 Scope of the study
doi: 10.3926/ j iem .2009.v2n1.p128- 152 © © JI EM, 2009 – 2( 1) : 128- 152 - I SSN: 2013- 0953
1.5 Hypotheses
The data generated will enable the test ing of a num ber of hypotheses for this study. However the st udy will concentrate on these hypotheses:
H1: The claim that the com pany has adopted lean m anufacturing principles by m aking actual changes in the direction of the lean m anufacturing principles.
H2: Com m unication process plays im port ant roles in lean product ion program s together with the support of m anufacturing infrastructure.
2 Literature review
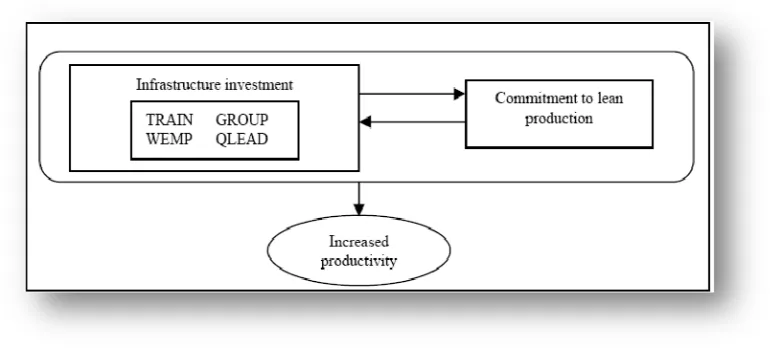
According to case studies conducted by Boyer, ( 1996) and Soriano- Meier et al.
( 2002) , there are two m aj or issues that will influence the im plem entation of lean m anufacturing in a com pany. They are m anagem ent com m itm ent to lean m anufacturing and supporting in m anufacturing infrastructure ( SMI ) . I n their research, they focus on four infrastructural invest m ent s: Qualit y Leadership ( QLEAD) , Group Problem Solving ( GROUP) , Training ( TRAI N) , and Worker Em powerm ent ( WEMP) . Boyer ( 1996) m entioned that the support and em phasis which places on t hese infrast ructural investm ents is considered to be a crit ical com ponent which contributes to the success of lean product ion. Figure 1 illust rat es the concept of lean producers who truly invest in the lean im plem entation.
doi: 10.3926/ j iem .2009.v2n1.p128- 152 © © JI EM, 2009 – 2( 1) : 128- 152 - I SSN: 2013- 0953
According to Boyer ( 1996) , m anagem ent that fails to em brace the im plem entation m ay interrupt the effort. Top m anagem ent should not only dem onstrate com m it m ent and leadership, but it m ust also work to create interest in the im plem entation and com m unicate the change to everyone within the organization. Managem ent m ust be connected to the proj ect and involved in the lean m anufacturing events. I f em ployees feel that the m anagem ent team does not respect their efforts, discouragem ent m ay exist and t he lean m anufact uring effort will fail. Though it is oft en desirable to drive change from the factory floor, it is im portant that a conversion to lean m anufacturing be driven by the executive m anagem ent team . On the other hand Gatchalian ( 1997) stat ed that the principles in TQM could only succeed if t here is well- inform ed qualit y leadership that sust ains the continuous im provem ent process.
Boyer, ( 1996) stated the successful im plem entation of lean production relies on well- t rained em ployees. I n a lean product ion environm ent , t raining is pivot al in order to develop a workforce, which is capable of shouldering the increased responsibilit ies, t o develop m ult i- skilled workers, and t o creat e an environm ent in which workers have t he skills and abilit y t o push for cont inuous im provem ent . I n reference to Wom ack, et al. ( 1990) , Boyer concluded that plants which allocat e
greater resources for the training of the workforce have been shown to have increased productivity.
Forrester, ( 1995) stated that lean m anufacturing is usually accom panied by a shift t owards exposure and problem solving. This changes calls for a new approach in problem solving. Boyer, ( 1996) m entioned that team work and group problem solving is a crit ical com ponent of TQM and JI T.I n t andem , t eam work and group problem solving serve to crash barriers and t o im prove t he flow of inform at ion through a com pany, thus leading to im proved productivity. Working as groups, while ut ilizing appropriat e problem solving t echniques, will also increase efficiency and pride in work im provem ent outputs ( Gatchalian, 1997) .
doi: 10.3926/ j iem .2009.v2n1.p128- 152 © © JI EM, 2009 – 2( 1) : 128- 152 - I SSN: 2013- 0953
There are three sim ilar researches conducted by Karlsson et al. ( 1996) , Boyer
( 1996) and Soriano- Meier et al. ( 2002) in different industries. Those researches
will serve as apt guidelines for this proj ect.
Karlsson et al. ( 1996) developed an operationalized m odel, which can be used to
assess the changes taking place in an effort to introduce lean production. Authors have lim it ed the factors that concern the work organization in the m anufacturing part of a com pany. This m odel has been developed using available theory, and has also benefited from an em pirical t est. By referring to the book “ The Machine that Changed the World” , authors had developed an operationalized m odel, which sum m arizes the im portant principles contained within lean production. The purpose is to find m easurable determ inants of what constitutes such a system in m anufacturing com pany.
The testing of the m odel has been conducted in an int ernat ional m anufact uring firm producing m echanical and electronic office equipm ent. The com pany restructures the operations by using lean production as the m odel in late 1991.they spent first year on planning and preparation. I n 1993, the physical and organizational changes started. The final m odel has im plications both for research and practice. For research, it can be used as a m odel for operat ionalzing lean production in order to be able to study change processes properly. I n practice, the m odel can be used as a checklist t o assess the developm ent taking place in an effort to becom e lean.
doi: 10.3926/ j iem .2009.v2n1.p128- 152 © © JI EM, 2009 – 2( 1) : 128- 152 - I SSN: 2013- 0953
The research sam ple consists of 491 m etalworking industries. The instrum ent was pre- tested and then sent by m ail to the m anufacturing plants. The survey yielded 202 usable responses. Scale used which have been shown to be reliable and valid in previous research, and also evaluat ed t wo t ypes of reliabilit y, int er- it em and inter- rater. The result of research shows that the correlat ions between each of the infrast ructural invest m ent variables and m anagem ent com m itm ent to JI T and TQM are significant. Regression used to determ ine the strength of the relat ionship bet ween invest m ent in infrast ructure and com m itm ent to lean production. Both of the results support research hypothesis t hat lean producers invest in t he infrastructure of the firm in order to support their com m it m ent to JI T and TQM.
On the other hand, Soriano- Meier et al., with the obj ective to develop the survey to
exam ine the relationship between the m ain com ponents of the Karlsson et al.
( 1996) conceptual fram ework, which are the adoption of lean production principles and m anagerial com m itm ent to lean production. Beside that, the author also used the m easurem ent of m anagerial com m itm ent as based on a m odel developed by Boyer ( 1996) .
The survey was com pleted by over 30 firm s in the UK ceram ics tableware industry and so represents a com prehensive overview of the state of play in that sector. The population was firm s with at least 35 em ployees. 33 out of 36 of target firm s agreed t o part icipat e and all com plet ed t he quest ionnaires. The sources of inform at ion were at t wo levels of the organization: top m anagem ent and production and operation m anagers. Two different questionnaires were directed to each level. One set of questionnaire is for latter level, used to gauge the extent of adoption of lean production principles. Another set is for m anaging director, used to m easure the level of com m itm ent of m anagem ent to lean production. The two groups of questionnaires m easured different variables and, therefore, were analyzed independently.
doi: 10.3926/ j iem .2009.v2n1.p128- 152 © © JI EM, 2009 – 2( 1) : 128- 152 - I SSN: 2013- 0953
firm s’ claim s to the adoption of lean production and actual changes m ade in this direct ion. Finally, t here is a posit ive relat ionship bet ween invest m ent in SMI and actual changes towards lean principles, and perform ance.
Meanwhile, the inform ation related to the im plem entation of leanness m ust be clearly spelled out to everyone from top to bot t om in the organizat ion. This is very im portant as the com m unication process will pave way for people to accept the new concept and able to overcom e resistance towards new changes in their work.
Com m unicat ion is very im port ant and is inseparable from the business environm ent. Little ( 1977) , highlighted that “ A substantial am ount of the day to day com m unication that goes on in any business is spoken com m unication between individuals ( face- to- face com m unication) or between individual and a sm all group ( com m ittee work, oral reporting to a board, instruction given to a group of subordinates etc.”
Warten L.Thom as ( 1985) pointed out that to achieve real success at workplace, one m ust be able to com m unicate what one knows. Even, Le Vassan ( 1994) has stressed that effective com m unication is certainly an added asset for the business sector to function in the econom ic network. I t is im port ant to use the technical knowledge to explore a problem and suggest ways of solving it . One m ust be able to assem ble inform ation, analyze it and report the findings in a m anner that will lead it t o m ore efficient procedures, bet t er ways of doing things.”
3 Methodology
3.1 Questionnaire development
The questionnaire was developed by referring to previous researches conducted by Boyer, ( 1996) and Soriano- Meier et al., ( 2002) and Karlsson et al., ( 1996) . The
instrum ent can be adapted for use in aircraft industries although the target indust ries in the above researches vary.
There were two parts in the questionnaire. The first part was used to m easure the degree of adoption of lean m anufacturing principles and the degree of leanness of the com pany. The respondents will rate nine variables with the provided odd-num bered alternative scale. These nine variables were adopted from Soriano- Meier
doi: 10.3926/ j iem .2009.v2n1.p128- 152 © © JI EM, 2009 – 2( 1) : 128- 152 - I SSN: 2013- 0953
continuous im provem ent, zero defects, j ust - in- t im e, pull instead of push, m ultifunctional team s, decentralized responsibilities, integrated functions and vert ical inform at ion funct ions. The response scale is 1 through 5, representing the range of no adopt ion, less adopt ion, part ial adopt ion, do adopt ion and t ot ally adoption.
The second part of the questionnaire was used to m easure the m anagerial com m itm ent and their support in the m anufacturing infrastructures. The supporting m anufacturing infrastructure m easured is Worker Em powerm ent, Training, Group Problem Solving and Qualit y Leadership, which was stated by Boyer ( 1996) . The first variable is rated by score range from 1 to 5 representing no em phasis, less
em phasis, m oderat e em phasis, do em phasis and ext rem e em phasis. The last three
variables rated with sam e score range but with different headings - are st rongly
disagree, disagree, m oderat e, agree and st rongly agree. I n this part, the
respondents have to rate the m anagem ent com m itm ents to six lean practices m entioned in first chapter. The score range is from 1 to 5, representing no com m itm ent, less com m itm ent, partial com m it m ent, do com m itm ent and total com m itm ent.
3.2 Pilot test
A pilot test was conducted to ensure the results of the questionnaire are valid and m eet the obj ectives of this proj ect. This is done by distributing questionnaire to two lean expertise of the com pany. A discussion was held with the respondents regarding the questionnaire and the feedback given by the respondents helped the researcher to edit and m ake changes to the questionnaire. Besides, based on the pre- test, total tim e spent to answer the questionnaire is ascertained.
3.3 Questionnaire modification
I f the responses from the pilot test do not show the validit y, m odifications on the questionnaire will be necessary. This m ay happen when the respondents m ay not be aware of certain inform ation which is not their field ( Grandzol et al., 1998) .
doi: 10.3926/ j iem .2009.v2n1.p128- 152 © © JI EM, 2009 – 2( 1) : 128- 152 - I SSN: 2013- 0953
3.4 Sending and receiving questionnaire
The questionnaire is directed to three levels of t he com pany, which are, t op m anagem ent, m iddle m anagem ent, and shop floor workers. For the top m anagem ent level respondents, the questionnaires were answered by all heads of departm ents of the com pany. However, the questionnaire was lim ited to the last two levels of kitting departm ent. The feedback was received wit hin two weeks from a total of 53 respondents.
3.5 Data analyzing
I n the first part of the questionnaire, the m ean and standard deviation were com puted with the scores of the nine variables. The m ean is t he value of t he degree of adoption ( DOA) . Degree of leanness ( DOL) was m easured as the m ean value of the nine separate variables in the m odel. Degree of com m itm ent (DOC) was m easured by the level of invest m ent in support ing m anufact uring infrastructure, as m easured by Worker Em powerm ent, Training, Group Problem Solving and Qualit y Leadership.
There are a num ber of different reliability coefficients. One of the m ost com m only used is Cronbach’s alpha ( Coakes, 2005) . I t is used to assess the internal consist ency reliabilit y of several it em s or scores that the researcher wants to add together to get a sum m ary or sum m ated scale score ( Morgan et al., 2004) .
Cronbach’s alpha is based on the average correlat ion of it em s wit hin a t est if the item s are st andardized ( Coakes, 2005) . The alpha value should be posit ive and usually great er t han 0.70 in order t o provide good support for int ernal consist ency reliabilit y ( Morgan et al., 2004) .
Correlat ions m easure how variables are relat ed. Before calculat ing a correlat ion coefficient, data is screened for outliers and evidence of a linear relat ionship. Pearson’s correlat ion coefficient is a m easure of linear association. I f the relat ionship is not linear, Spearm an’s rho will be used to m easure the correlation between the variables ( Morgan et al., 2004) . A Pearson’ correlation coefficient
doi: 10.3926/ j iem .2009.v2n1.p128- 152 © © JI EM, 2009 – 2( 1) : 128- 152 - I SSN: 2013- 0953
Linear Regression estim ates the coefficient of the linear equat ion, involving one or m ore independent variables, which best predicted the value of the dependent variable. For each value of the independent variables, the distribution of the dependent variable m ust be norm al. The variance of the distribution of the dependent variable should be constant for all values of the independent variable. The relationship between the dependent variable and each independent variable should be linear, and all observat ions should be independent ( Morgan et al., 2004) .
There are three m aj or regression m odels, which are sim ultaneous regression, hierarchical regression and stepwise regression. These m odels differ in t wo ways: first, in the treatm ent of overlapping variability due to correlation of the independent variables, and second, in term s of the order of entry of the independent variables into the equation. Regression analysis was used to determ ine the strength of the relationship between the supporting m anufacturing infrastructure variables and the com m itm ents to lean m anufacturing. Regression between the degree of adoption and the nine variables was also m easured. With these correlation and regression analyses, the two hypotheses of the proj ect will be proved or rej ected.
4 Results
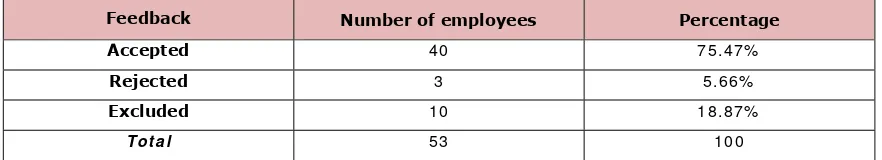
The response showed that all the workers and m anagem ent are happy to take part in the st udy. The num ber of em ployees from kiting departm ent that are willing t o part icipat e were only 35 people, which is 77.78% as som e of them were busy wit h their own work and others have resigned, on leave, out station, or at t ending courses. On top of that, three feedbacks were rej ected by researcher because the respondents rated the entire questions with the sam e answer or called patterned response bias, which is in line wit h Grandzol et al. ( 1998) opinion that this kind of
feedback will affect t he analysis of the result .
Feedback Number of employees Percentage
Accepted 40 75.47%
Rejected 3 5.66%
Excluded 10 18.87%
Tot a l 53 100
doi: 10.3926/ j iem .2009.v2n1.p128- 152 © © JI EM, 2009 – 2( 1) : 128- 152 - I SSN: 2013- 0953
Based on the statistics in Table 1, there were 40 feedbacks accepted with 75.47% . Num ber of feedbacks rej ected is 3, which is 5.66% . Tot al num ber of em ployees who were unwilling part icipant s were 10 person or 18.87% . Therefore, t he analysis of this study was based on 40 em ployees of t he com pany. The higher num ber of people who want t o take part in t he study m eans that they are very positive towards the new changes and really understand what is happening in the departm ent. This could happen only if there is a very good com m unication and int eract ion bet ween the various levels of em ployees. A good com m unication process ensures that the em ployees were m ore recept ive to changes and were willing to accept and carry out the new ideas.
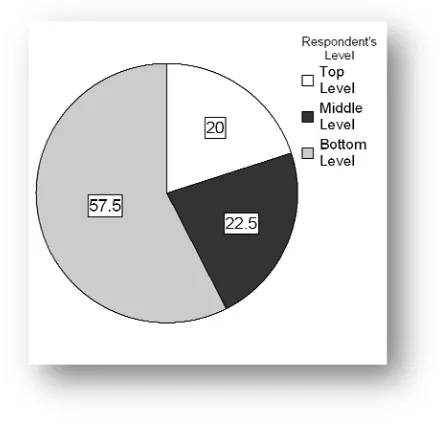
Figure 2 indicates the percentage of the respondents based on their levels in t he com pany. From the figure, the highest percentage of respondents is from bottom level, which is 57.5% , followed by m iddle level wit h 22.5% . The lowest percentage of respondent s is from t op level, which is only 20 % .
Figure 2. “ Respondent ’s Status in Percentage” .
4.1 Reliability
Cronbach’s Alpha was used t o assess int er- it em reliabilit y, wit h alpha values of 0.7 or higher considered t o indicat e accept able reliabilit y for est ablished scales ( Soriano- Meier et al., 2002) . I nter- item reliability is the degree of internal
doi: 10.3926/ j iem .2009.v2n1.p128- 152 © © JI EM, 2009 – 2( 1) : 128- 152 - I SSN: 2013- 0953
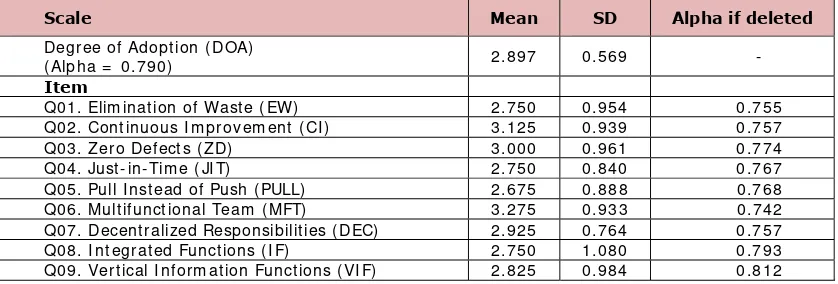
degree of adoption and the it em s if delet ed. The it em s represent the questions in the questionnaire.
Table 4.4a shows that the Alpha value for degree of adoption is 0.790, which exceeds the threshold. With the except ion of it em Q09, Vert ical I nform at ion Functions, the scale reliabilities are highest when all the nine item s are included, which is 0.812. But the Alpha value j ust increased slightly, approxim ately 2.8% of increm ent, even after elim inat ion of t his it em . Therefore the elim inat ion needs not necessarily t o be j ust ified ( Grandzol et al., 1998) .
Q07. Decentralized Responsibilit ies ( DEC) 2.925 0.764 0.757
Q08. I ntegrated Funct ions ( I F) 2.750 1.080 0.793
Q09. Vertical I nform at ion Funct ions ( VI F) 2.825 0.984 0.812
Table 2. “ Reliability analyses of DOA of lean m anufacturing principles ( N= 40) ” .
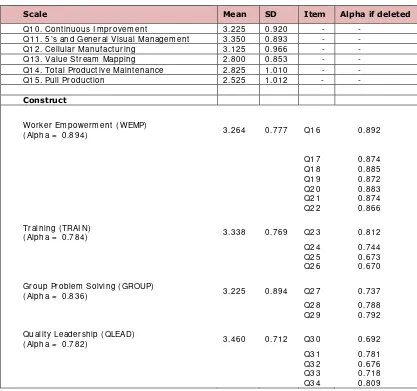
Meanwhile Table 3 shows the results of reliability analyses for each set of supporting m anufacturing infrastructure construct indicators; Worker Em powerm ent , Training, Group Problem Solving and Qualit y Leadership. I n addition, the m ean and standard deviation for m anagem ent com m itm ent in each lean m anufacturing practice are also indicated.
doi: 10.3926/ j iem .2009.v2n1.p128- 152 © © JI EM, 2009 – 2( 1) : 128- 152 - I SSN: 2013- 0953
4.2 Correlation
Correlation is the m easure of the degree of association between two variables when both are m easured on a series of obj ects ( Bower, 2000) . Spearm an rho will be com puted for both cases because the variables are not norm ally dist ribut ed ( Coakes, 2005) .
Group Problem Solving ( GROUP)
( Alpha = 0.836) 3.225 0.894 Q27 0.737
Table 3. “ Reliability analyses for m anagem ent com m itm ent in lean m anufacturing practices and the SMI ( N= 40) ” .
doi: 10.3926/ j iem .2009.v2n1.p128- 152 © © JI EM, 2009 – 2( 1) : 128- 152 - I SSN: 2013- 0953
I nform at ion Funct ions to degree of adopt ion is significant as well, where p is less
than 0.05. As shown in table 4.5a, correlation between degree of adoption and Continuous I m provem ent has the largest correlation, where value r is equal t o
0.70.
Table 4. “ I nter- correlation for DOA and predictors variables ( N= 40) ” .
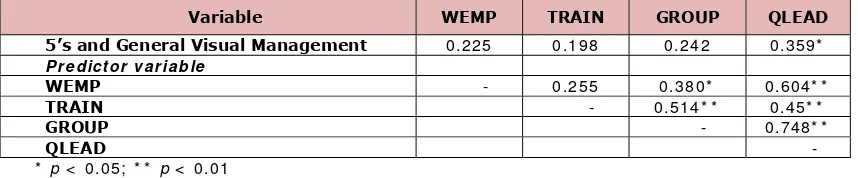
Table 5 indicates the correlation between the predictor variables and m anagem ent com m itm ent to 5’s General Visual Managem ent . Qualit y Leadership was t he only variable which significant ly correlat ed to the m anagem ent com m itm ent, where r is
equal to 0.359 with p less t han 0.05. All predict or variables positively correlated to
the m anagem ent com m itm ent.
Variable WEMP TRAIN GROUP QLEAD
5’s and General Visual Management 0.225 0.198 0.242 0.359*
Pr e dict or va r ia ble
Table 5. “ I nter- correlation for m anagem ent com m itm ent and predictors variables ( N= 40) ” .
4.3 Regression
doi: 10.3926/ j iem .2009.v2n1.p128- 152 © © JI EM, 2009 – 2( 1) : 128- 152 - I SSN: 2013- 0953
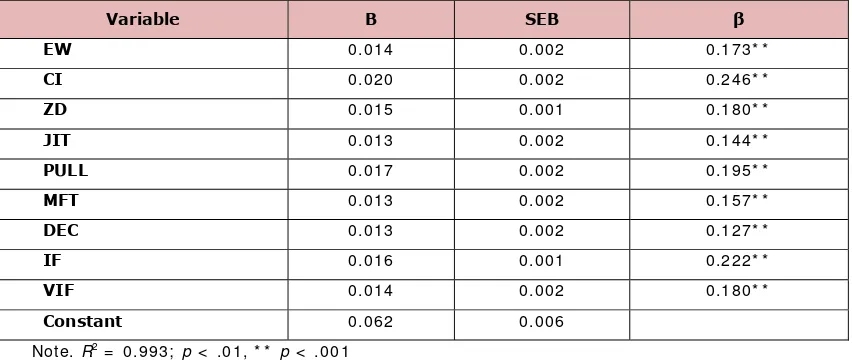
Sim ult aneous m ult iple regression was conduct ed t o invest igat e t he best predict ors of degree of adoption. I n sim ultaneous m odel, all independent variables ent er t he regression equation at once to exam ine t he relat ionship bet ween the whole set of predictors and the dependent variable ( Coakes, 2005) . This is because all the nine independent variables are significantly related to dependent variable. The beta coefficient s are present ed in the Table 6. Note t hat all nine variables significantly predict the degree of adoption when they are included. The adj usted R squares
value was 0.993. This indicates t hat 99.3% of the variance in degree of adoption was explained by all nine variables.
The regression equation for this m odel to predict the degree of leanness of the com pany is st at ed in Equat ion 1. The equat ion also can be used t o est im at e t he degree of adoption for other sam ple size.
Degree of adopt ion = 0.014* ( EW) + 0.020* ( CI ) + 0.015* ( ZD) + 0.013* ( JI T) +
0.017* ( PULL) + 0.013* ( MFT) + 0.013* ( DEC) + 0.016* ( I F)
+ 0.014* ( VI F) + 0.062
Equation 1. “ Degree of adoption”
Where,
EW = Elim inat ion of wast e m ean value CI = Continuous I m provem ent m ean value ZD = Zero Defects m ean value
JI T = Just- in- Tim e m ean value
PULL = Pull I nstead of Push m ean value MFT = Mult ifunct ional Team s m ean value
DEC = Decentralized Responsibilities m ean value I F = I ntegrated Functions m ean value
VI F = Vertical I nform ation Functions m ean value
doi: 10.3926/ j iem .2009.v2n1.p128- 152 © © JI EM, 2009 – 2( 1) : 128- 152 - I SSN: 2013- 0953
the dependent variables. The independent variables are the supporting m anufacturing infrastructure. The result s of stepwise regression are given in table 7. The only variable select ed t o ent er t he m odel is Qualit y Leadership, which accounts for 39.4% of the variance in the dependent variable, and is significant at
p is less t han 0.01.
Variable B SEB β
EW 0.014 0.002 0.173* *
CI 0.020 0.002 0.246* *
ZD 0.015 0.001 0.180* *
JIT 0.013 0.002 0.144* *
PULL 0.017 0.002 0.195* *
MFT 0.013 0.002 0.157* *
DEC 0.013 0.002 0.127* *
IF 0.016 0.001 0.222* *
VIF 0.014 0.002 0.180* *
Constant 0.062 0.006
Not e. R2 = 0.993; p < .01, * * p < .001
Table 6. “ Sim ultaneous Multiple Regression Analyses Sum m ary for EW, CI , ZD, JI T, PULL, MFT, DEC, I F, and VI F ( N= 40) ” .
The other variables are excluded from the m odel. These are true with the result of correlat ion analyses, where Qualit y Leadership is t he only relat ed variables and contribute to the 5’s and General Visual Managem ent. The regression equation for t his m odel t o predict t he m anagerial com m it m ent of the com pany is st at ed in Equation 2. The equation also can be used to estim ate m anagerial com m itm ent for other sam ple size.
Managerial Com m it m ent = 0.494* ( QLEAD) + 1.642
Equation 2. “ Managerial Com m itm ent” .
Where,
doi: 10.3926/ j iem .2009.v2n1.p128- 152 © © JI EM, 2009 – 2( 1) : 128- 152 - I SSN: 2013- 0953
Independent variables B SEB R2
F
QLEAD 0.494 0.187 0.394 6.964*
Constant 1.642 0.660
* p < 0.05
Table 7. “ Stepwise regression for Managem ent com m itm ent to 5’s and General Visual Managem ent with SMI ( N= 40) ” .
4.4 Degree of Leanness and Degree of Management Commitment
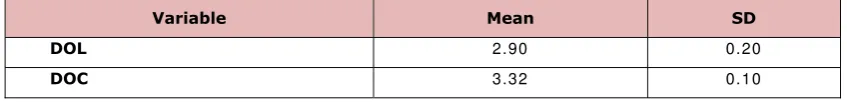
Degree of leanness (DOL) was m easured as the average of the actual changes taking place as m easured by the nine principles of lean m anufacturing. Degree of m anagerial com m itm ent ( DOC) was m easured by the level of investm ent in supporting m anufacturing infrastructure, as m easured by Worker Em powerm ent, Training, Group Problem Solving and Qualit y Leadership. Table 8 indicat es t he m ean and standard derivation of degree of leanness and degree of com m itm ent. The results indicate the degree of leanness of the com pany is m oderate with m ean value is 2.90± 0.20. Meanwhile, t he degree of com m itm ent is m oderate too, with m ean value is 3.32± 0.10.
Variable Mean SD
DOL 2.90 0.20
DOC 3.32 0.10
Table 8. “ Mean and standard deviation of DOL and DOC ( N= 40) ” .
4.5 Degree of the Roles Communication Process
doi: 10.3926/ j iem .2009.v2n1.p128- 152 © © JI EM, 2009 – 2( 1) : 128- 152 - I SSN: 2013- 0953
Variable Mean SD
CP 3.10 0.20
Table 9. “ Mean and standard deviation of CP ( N= 40) ” .
5 Discussion
Based on the results of correlation and regression in Table 3 and Table 5 Hypotheses 1 is accept able. The results of t his st udy show that the organization has adopted lean m anufacturing principles and have been m aking actual changes in t he direction of the lean m anufact uring principles.
Continuous I m provem ent, Zero Defects and Mult ifunct ional Team s were perceived highly by respondents, with m ean value 3.125± 0.939, 3.000± 0.961 and 3.275± 0.933 respectively ( Table 2) . The rest was less adopted in the organization. Thus the degree of adoption of the organization is low with m ean value 2.897± 0.569. Consequently, the degree of leanness is low as indicated in Table 7. This is because the organizat ion is in t he early st ages of im plem ent at ion of lean m anufacturing practices and principles. The results are sim ilar to t he results of Soriano- Meier’s ( 2002) research, where degree of adopt ion of an organization is st rongly relat ed wit h the changes m ade in t hose nine variables.
I nterestingly, all nine elem ents do contribute to degree of adoption ( Table 5) . The highest cont ribution is Continuous I m provem ent with B value equal to 0.020,
significant wit h p is less than 0.01. Thus, the com pany can increase the degree of
adopt ion by focusing in all variables especially in Cont inuous I m provem ent . Basically, there are two kinds of im provem ent, which are increm ental and innovation.
doi: 10.3926/ j iem .2009.v2n1.p128- 152 © © JI EM, 2009 – 2( 1) : 128- 152 - I SSN: 2013- 0953
The significance level at t ained depends on several factors, but it cannot be assum ed that high m agnitude coefficient s, of the order nearing unity, are st at ist ically significant . One of t he m aj or influences is t he num ber of pairs of readings or the sam ple size. A sm all sam ple size m ay produce a high coefficient, but it m ay not be significant . Conversely, wit h a large sam ple a significant correlat ion m ay be obtained even though no obvious relationship exists ( Bower, 2000) . I nappropriate, inadequate, or excessive sam ple sizes continue to influence the quality and accuracy of research ( Bartlett et al., 2001) .
Alt hough there is only one m anufacturing infrast ructure, Qualit y Leadership, it significantly correlates with the m anagem ent com m itm ent, but the rest of the elem ent has relationship with m anagem ent com m itm ent. This is because the correlat ion coefficient of all m anufact uring infrast ruct ure is in t he range of - 1 and + 1. The zero correlation only occurs when the correlation coefficient is 0 ( Bower, 2000) . The result is sim ilar with researches of Boyer ( 1996) and Soriano- Meier ( 2002) , where both show that Quality Leadership having the largest correlat ion with m anagerial com m itm ent.
There are several com m on errors that m anagers m ake when im plem enting lean m anufacturing. Managers presum e that lean m anufacturing is not a com prehensive m anagem ent syst em . For t hem , the applicat ion of lean m anufact uring is lim it ed t o only a portion of com pany’s activities such as operation ( Em iliani et al., 2005) .
doi: 10.3926/ j iem .2009.v2n1.p128- 152 © © JI EM, 2009 – 2( 1) : 128- 152 - I SSN: 2013- 0953
6 Conclusion
The purpose of this paper is to evaluate the degree of leanness possessed by the com pany and the roles played by com m unication process in lean practice. The results show that the degree of leanness and degree of com m itm ent in term s of com m unication is m oderate for the com pany although the patterns of com m unication do exist . Prim arily, t he m ain findings show t hat the com pany is in their early stage to becom e lean, thus there is a need to keep their efforts for an effective com m unication process at all levels in order to be successful in lean m anufacturing im plem entation. There is a need for everyone to be aware and understand the lean concept and the process of im plem entation. This is where t he com m unication process plays a crucial role in ensuring the successful im plem entation of leanness. The com pany can increase their degree of adoption of lean m anufacturing by putting efforts into the nine principles especially Continuous I m provem ent. The com pany should encourage t he Qualit y Leadership in order t o im prove the m anagerial com m itm ent.
This finding has im plicat ions for the com pany as it provides a m ean to help t hem t o m easure it s degree of com m itm ent to lean m anufacturing and its degree of adoption of lean m anufacturing principles. The results of correlation and regression analyses have provided support to the first and second hypotheses. The finding signifies t hat t here is a st rong relat ionship between com pany’s adoption of lean m anufacturing and actual changes m ade in nine variable of leanness. I n addition, evidence proves that a good com m unication process supports the lean practices in m anufacturing. The m anagem ent should understand and em phasis the im portance of the com m unication to successfully im plem ent lean practice in their organization.
doi: 10.3926/ j iem .2009.v2n1.p128- 152 © © JI EM, 2009 – 2( 1) : 128- 152 - I SSN: 2013- 0953
Appendices: Questionnaire survey form (in English and Malay)
Please fill Top Level
the circle Middle Level
Bottom Level Category/
Kategori No
Rate the degree of adoption of the following lean production principles.
Nilaikan tahap pengamalan prinsip "Lean Production" berikut.
Rate the management commitment to the below lean practices.
doi: 10.3926/ j iem .2009.v2n1.p128- 152 © © JI EM, 2009 – 2( 1) : 128- 152 - I SSN: 2013- 0953
16 Giving workers a broader range of tasks.
Pekerja diberi lingkungan tugas yang luas .
23 Direct labor undergoes training to perform multiple tasks in the production process.
Pekerja melalui latihan untuk menjalankan pelbagai tugasan dalam proses pengeluaran.
24 Employees are rewarded for learning new skill.
Pekerja diberi peluang untuk mempelajar kemahiran baru.
25 Our plant has a high skill level, compared with our industry.
Kilang kami mempunyai tahap kemahiran tinggi berbanding dengan industri lain.
26 Direct labor technical competence is high in this plant.
Kecekapan teknikal buruh disini adalah tinggi.
27 Our palnt forms teams to solve problems.
Kilang kami mewujudkan pasukan untuk menyelesaikan masalah.
28 In the pass three years, many problems have been solve through team efforts.
Banyak masalah telah diatasi dalam tiga tahun sebelum secara berpasukan.
29 During problem solving sessions, all team members' opinions and ideas are considered before making a decision.
Dalam sesi penyelesaian masalah, semua pendapat dan idea ahli ditimbangkan sebelum keputusan dibuat.
30 All major department heads within our plant accept responsibility for quality.
Semua ketua jabatan dalam kilang kami bertanggungjawab terhadap qualiti.
31 Plant management provides personal leadership for quality improvement.
Pengurusan kilang memberi pimpinan khusus untuk kemajuan qualiti.
32 The top priority in evaluating plant management is quality performance.
Keutamaan dalam penilaian pengurusan dalam kilang kami ialah prestasi quality.
33 All major department heads within our plant work to encourage lean manufacturing.
Semua ketua jabatan utama dalam kilang kami menggalakan "Lean Manufacturing"
dipraktikan.
34 Our top management strongly encourages employees involvement in the production process.
Pengurusan atasan kami sangant menggalakan penglibatan pekerja dalam proses
doi: 10.3926/ j iem .2009.v2n1.p128- 152 © © JI EM, 2009 – 2( 1) : 128- 152 - I SSN: 2013- 0953
References
Bartlett, J. E., Kotrlik, J. W., & Higgins, C. C. ( 2001) . Organizational Research: Determ ining Appropriate Sam ple Size in Survey Research. I nform at ion
Technology, Learning, and Perform ance Journal, 19( 1) : 43- 50.
Bhasin, S. & Burcher, P. ( 2006) . Lean Viewed as a Philosophy. I nt ernat ional Journal
of Manufact uring Technology Managem ent, 17( 1) : 56 - 72
Bower, J. A. ( 2000) . Statistics for Food Science- VI : Correlation and Regression ( Part A) . Nut rit ion & Food Science, 30( 6) : 295- 299.
Boyer, K.K. ( 1996) . An Assessm ent of Managerial Com m it m ent to Lean Production.
I nt ernat ional Journal of Operat ion & Product ion Managem ent, 16( 9) : 48 - 59
Coakes, S. J. ( 2005) . SPSS: Analysis wit hout Anguish- version 12.0 for Window s,
John Wiley & Sons Australia. Ltd, Queensland.
Em iliani, M.L. & St ec, D.J. ( 2005) . Leaders Lost in Transform ation. I nt ernat ional
Leadership & Organizat ion Developm ent Journal, 26( 5) : 370- 387
Forrester, R. ( 1995) . I m plications of Lean Manufacturing for Hum an Resource Strategy. Work St udy, 44( 3) : 20- 24.
Gatchalian, M.M., ( 1997) . People em powerm ent: the key to TQM success. The TQM
Magazine, 9: 429- 433.
Grandzol, J.R., & M. Gershon, ( 1998) . A survey instrum ent for standardizing TQM m odeling research. I nt . J. Qualit y Sci., 3: 80- 105.
Karlsson, C., & Åhlström , P. ( 1996) . Change processes towards lean production: The role of the m anagem ent accounting syst em . I nt . J. Operat ion and Product ion
Manage. 16: 42- 56.
Le Vassan, M. ( 1994) . Effectiveness of com m unication in business. Journal of
Educat ional Research, 4( 1) : 35- 47.
Little, P. ( 1977) . Com m unicat ion in Business. 3rd Edit ion. London. Brown Com pany
doi: 10.3926/ j iem .2009.v2n1.p128- 152 © © JI EM, 2009 – 2( 1) : 128- 152 - I SSN: 2013- 0953
Morgan, G.A., Leech, N.L., Gloeckner, G.W., & Barret, K.C. ( 2004) . SPSS for
int roduct ory St at ist ics: Use and I nt erpret at ion Second Edit ion. Lawrence Erlbaum
Associates, Publishers: 111- 124.
Soriano- Meier, H., & Forrester, P.L. ( 2002). A Model for Evaluating the Degree of Leanness of Manufacturing Firm s. I nt egrat ed Manufact uring Syst em, 13( 2) :
104-109.
Warten L.T. ( 1985) . Technical Writ ing Purpose, Process and Form. California:
Wadsworth Publishing Com pany USA.
Wom ack, J.P., Jones, D.T., & Roos, D. ( 1990) . The Machine t hat Changed t he
World. Em erald Group Publishing Lim ited.
Worley, J.M., & Doolen, T.L. ( 2006) . The role of com m unication and m anagem ent support in a lean m anufacturing im plem entation. J. Managem ent Decision, 44:
228- 245.
©© Journal of Industrial Engineering and Management, 2009 (www.jiem.org)
Article's contents are provided on a Attribution-Non Commercial 3.0 Creative commons license. Readers are allowed to copy, distribute and communicate article's contents, provided the author's and Journal of Industrial Engineering and Management's names are included. It must not be used for commercial purposes. To see the complete