Flock Identification using Connected Components Labeling
for Multi-Robot Shepherding
Sazalinsyah Razali, Nurul Fathiyah Shamsudin, Mashanum Osman Faculty of Information & Communication Technology
Universiti Teknikal Malaysia Melaka 76100 Durian Tunggal, Melaka, Malaysia
{sazalinsyah, mashanum}@utem.edu.my, [email protected]
Qinggang Meng, Shuang-Hua Yang Department of Computer Science
Loughborough University
LE11 3TU Loughborough, Leicestershire, U.K. {Q.Meng, S.H.Yang}@lboro.ac.uk
Abstract—Shepherding is often used in robotics and applied to various domains such as military in Unmanned Aerial Vehicle (UAV) or Unmanned Ground Vehicle (UGV) combat scenarios, disaster rescue and even in manufacturing. Gener-ally, robot shepherding refers to a task of a robot known as shepherd or sheep herder, who guards and takes care of flocks of sheep, to make sure that the flock is intact and protect them from predators. In order to make an accurate decision, the shepherd needs to identify the flock that needs to be managed. How does the shepherd can precisely identify a group of animals as a flock? How can one actually judge a flock of sheep, is a flock? How does the shepherd decide how to approach or to steer the flock? These are the questions that relates to flock identification. In this paper, a new method using connected components labeling is proposed to cater the problem of flock identification in multi-robot shepherding scenarios. The results shows that it is a feasible approach, and can be used when integrated with the Player/Stage robotics simulation platform.
Keywords-flock identification; connected components label-ing; image processlabel-ing; multi-robot shepherdlabel-ing;
I. INTRODUCTION
In general, shepherding refers to the task of a person known as a shepherd or sheepherder who tends, feeds or guards flocks of sheep. The duty of the shepherds is to make sure that their flock is intact and protect them from predators. An example of shepherding behaviors can be seen in the agricultural sector, in which a dog or sheepdog is trying to control a flock of sheep. Shepherding behaviors can also be seen in crowd management scenario.
The shepherd decides on how to move in order to control the movements of the flock. This is known as shepherds locomotion. In order to make the decision, the shepherd needs to identify the flock that he wanted to manage. This task is known as flock identification. The purpose of flock identification is to recognize and determine whether the individuals in the area are in the same flock. It is important because it leads to shepherds locomotion decision.
II. BACKGROUND
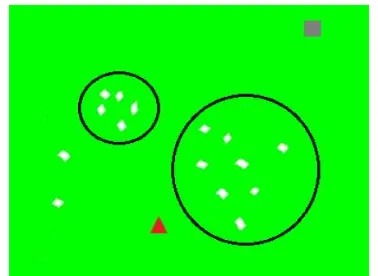
Figure 1 shows a scenario of the flock identification phase in single shepherding. The purpose of flock identification
Figure 1. Flock Identification in a single shepherding scenario
is to recognize and determine whether the individuals in the area are in the same flock. The shepherd (shown as a triangle) needs to observe the area and identify which sheep (marked as white) belongs to which flock (shown as black circles). It is important because it leads to shepherds locomotion decision. Once the flock has been identified, then the shepherd can decide which flock needed to be steered first. The flock center will be calculated in order to determine the steering point and push the flock towards the goal (shown as the gray square near the top-right corner of Fig. 1).
This paper focuses on investigating on how to adapt the connected-components method in image processing for flock identification in which the idea that each individual in the group can be viewed as a pixel in a digital image.
A. Related Works
Figure 2. The perceived flock center—the right-most & top-most sheep are not detected to be in the same flock
in 2009 and 2010 [4], [5] uses a different approach whereby the shepherds only have local ground view of the flock, and thus uses a ‘perceived flock center’ and the nearest ‘flock’ member as an anchor to determine the steering points.
1) Flock blobs: Harrison et al. [3] proposed a shepherd-ing strategy, called DEFORM. In this algorithm, the flock identification task is done by using flock blobs. Flock blob (BF) is the set of all grid cells occupied by members of the
flock. Target blob (BT) is the area to which the shepherds
try to guide the flock. Target blob is formed by using 8-connected set around the cell that contains the member of the flock which is closest to the goal (fclosest). This technique
is based on a bird’s eye view of the whole scenario. 2) Compact area: Lien et al. [2] uses a mathematical model for flock identification. The shepherds are often not able to keep the flock intact especially for large flocks. Thus, Lien et al. came up with a technique called compact area. The compact area of a group is the smallest circle that could contain all group members. All members outside the compact area are considered as separated, in other words, they are not in the same flock. This technique is based on the inverse version of the packing circles in a circle problem. 3) Perceived flock: Razali et al. [4], [5] uses a different approach whereby the shepherds only have local ground view of the flock, and thus uses a ‘perceived flock center’ and the nearest ‘flock’ member as an anchor to determine the steering points.
B. Motivation
The problem of current approaches is that it is either quite complex or it is not precise enough, such as the ‘perceived flock center’ approach. Therefore, our proposed approach tries to balance between having a simple flock identification technique and obtaining a high degree of accuracy. Although this proposed approach is using the ‘bird’s eye view’, it is limited by the communication radius of the flock members, as discussed in the later sections.
C. Proposed Method
This paper proposes a technique based on existing method from a different domain. Connected-components methods are well researched in the image processing domain [6]. It is also known as connected components labeling. It is based on graph-theory where the digital image pixels are viewed as vertices and the connected neighbors are the edges. Accord-ing to Stefano and Bulgarelli [7], the definition of connected component relies on that of a pixels neighborhood. It can be adapted for a more precise identification of flocks by viewing each sheep as a pixel and using the sheep’s communication range to find the connected neighbors.
III. CONNECTEDCOMPONENTSLABELING
In image analysis, specifically in binary images, one of the common problem is to determine which parts of an object is physically connected. Human are gifted with the ability to easily distinguish the differences and notice the similarities, but not computers or robots. The connected components labeling is introduced by Rosenfeld and Pfaltz in 1966 [8] to solve this problem.
Connected components labeling is defined as a set of pixels that is said to be connected in which each pixel is connected to their neighboring pixels. A connected com-ponents labeling of a binary image, B is a labeled image
LB in which the value of each pixel is the label of its connected components [9]. An algorithm that takes in a binary image and outputs a new labeled image with distinct labels for each connected components is called a connected components labeling algorithm [10]. There are two general algorithms for connected components labeling which are recursive algorithm and row-by-row algorithm.
The first one is a straightforward algorithm known as the recursive algorithm. A pixel is chosen from an image and from that pixel, we check its neighbors for connectivity. As the image size grows, the time taken for the algorithm to execute increases rather quickly. This is the disadvantage of the recursive algorithm.
A. The Classical Algorithm
The other one is the row-by-row algorithm also known as the classical algorithm [8]. It consists of two passes. During the first pass, the algorithm scans the pixels from left to right, record the equivalences and assign temporary labels. In the second pass, replacement of each temporary label is done by relabeling the label of its equivalence class. Figures 3 and 4 shows the flowchart of first pass and second pass respectively. This classical algorithm uses the union-find data structures which makes this algorithm more efficient [11].
Figure 3. First Pass in the Connected Components Algorithm
although it obviously performs faster than the 8-connectivity variant. The connected components algorithm takes place when the shepherd sees a sheep from its current location. It only takes place within the shepherd’s vision radius. Once the shepherd has confirmed the number of sheep within its radius of vision, the First Pass is executed.
During the First Pass, the shepherd will perform an 8-connectivity neighbor checking technique using the sheep location as the center of the 8-connectivity. Whenever a neighboring sheep is spotted, the current sheep will be assigned to the neighbors label. This phase will continue until all the sheep has been labeled.
After completing the First Pass, the Second Pass will execute. This phase will use the information from the union-find data structures in relabeling the sheep. The shepherd will check each and every sheep in its vision radius. From the sheep’s labels, the shepherd could find out whether the label is actually the parent or the child of other labels.
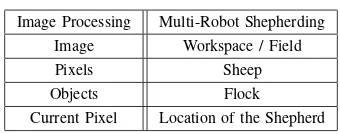
The terms of the classical algorithm in image processing slightly differs from the terms of adapted algorithm in multi-robot shepherding but the functionality or the roles of the terms are the same. Table I shows the comparison of connected components terms between image processing domain and the multi-robot shepherding domain.
IV. METHODS
In the first part of the experiment it is done only on C++ command line to test the connected components algo-rithm. These experiments are done without integrating with Player/Stage related base codes. The purpose of these tests
Figure 4. Second Pass in the Connected Components Algorithm
Table I COMPARISON OF TERMS
Image Processing Multi-Robot Shepherding Image Workspace / Field Pixels Sheep Objects Flock Current Pixel Location of the Shepherd
is to measure the accuracy of the connected components algorithm.
The testing data used for this experiment is obtained by manual identification from the output of the system. The output generated by the system are then compared to the testing data. Each run will be measured according to three performance measures which are discussed in Section V-A. The results from each run for each performance measures are produced and recorded. The results are used for further analysis.
The latter part of the experiment is performed on the Player/Stage [12], [13] robotics simulation software to test the connected components algorithm together with other robotics behaviors, such as obstacle avoidance, navigation, goal-seeking, and lining-up. A total of 10 runs have been executed on a workspace of size40×40.
V. SIMULATIONRESULTS
Figure 5. Example of Player/Stage simulation run
A. Performance Measures
In this paper, in order to verify the usefulness and the effectiveness of the proposed algorithm, the algorithm needs to undergo a process called performance measurement. Per-formance measures are composed of a number and a unit of measure that quantitatively tell us something important about the processes that have produced them.
1) Identification: The identification performance test is done to measure the accuracy of the algorithm in the identifying task. The identifying task involves the number of flocks detected by the algorithm and the number of flock members in each flock. The results from the algorithm are compared with the testing dataset which is done manually. This test is done with total 40 sets of testing data, 10 sets on four different workspace sizes each.
The accuracy of the algorithm in flock identification for each run is calculated based on the number of detected flocks. The results were then compared to the actual number of flocks which had been done manually identified. The for-mula for the accuracy of the algorithm in flock identification is shown in Eq.(1).
f lockaccuracy=
f lockdetected f lockactual
×100% (1)
Apart from the number of flocks, this test will also involve the flock members in each flock. The accuracy of flock members identification is done by comparing the number of detected flock members by the algorithm and the testing dataset. The formula of flock member identification is shown in Eq.(2).
memberaccuracy=
memberdetected memberactual
×100% (2)
Figure 6. Flock Identification accuracy for different workspaces
Figure 7. Flock Member Identification accuracy for different workspaces
2) Time taken: The time taken performance test is also done to measure the effectiveness of this algorithm. In this test, it involves the variation of workspace size that the algorithm is working on. This algorithm is executed with four different workspace size and 10 different testing data on each size. The accuracy of the flock and flock members identification is assumed to be 100% since this test focuses on the time taken for the algorithm to complete its task. The time taken for the algorithm to complete its task is calculated as shown in Eq.(3).
timeworkspace=
timetotal
n scenarios×100% (3)
B. Results
Based on the results in Fig. 6, the proposed algorithm has the highest accuracy of flock identification in workspace of size 20 × 20 and has the lowest accuracy of flock identification in workspace of6×6. There is an increasing pattern from workspace6×6to20×20but decreases when it comes to workspace of40×40. This probably occurred because of the spread of flock members are more dispersed in the workspace of size40×40.
Based on the results in Fig. 7, the proposed algorithm has the highest accuracy of flock member identification in workspace 20×20 and has the lowest accuracy of flock identification in the workspace of10×10. The placement of the flock members are oddly placed which results in irregular pattern.
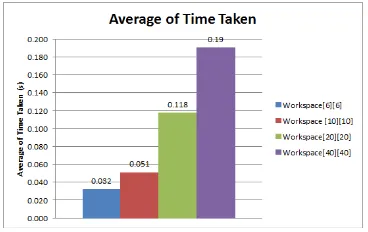
Figure 8. Average Time Taken for different workspaces
Table II
COMPARISON BETWEEN WITH&WITHOUT USINGPLAYER/STAGE
without P/S with P/S Flock Identification (%) 85.00 70.83 Average Correct Flock Detected 2.10 1.00
Time Taken (s) 0.19 10.50
Figure 9. Flock Identification accuracy with & without using Player/Stage for a 40x40 workspace
algorithm takes the longest time in workspace of 40×40 while it takes the shortest time in workspace of 6 ×6. Obviously, the bigger the workspace size, the more pixels that it needs to process.
Based on the results in Table II, it shows that the proposed algorithm without the integration of Player/Stage base code performs better flock identification (see Fig. 9) and managed to detect higher number of correct flock with lesser time taken. This is because the integrated algorithm involves additional computational works that are needed to be done to perform other navigational behaviors and the line-up of the shepherds.
It is shown that this proposed algorithm has a chance of performing better flock identification in bigger size of workspace but the drawbacks of performing in such a workspace is that it consumes more time and more memory. The proposed algorithm is expected to perform better flock member identification in bigger workspaces, but further experiments are required in order to clarify this notion.
VI. CONCLUSION
In this paper, the connected components method has shown its ability to perform flock identification and flock member identification in a satisfyingly high accuracy. The first part of the experiment proved that connected com-ponents labeling can be done and is feasible. The second part of the experiment showed that connected components labeling can be used in a multi-robot shepherding scenario by integrating with the Player/Stage robotics simulation platform and its related base codes.
ACKNOWLEDGMENT
The authors, namely S. Razali, M. Osman and N. F. Shamsudin, are grateful to the Faculty of Information & Communication Technology for the support in terms of computational resources and facilities, and to the Uni-versiti Teknikal Malaysia Melaka (UTeM) for the grant (PJP/2012/FTMK(2B)/S01104) that provided the financial support in this research.
REFERENCES
[1] J. Lien, O. Bayazit, R. Sowell, S. Rodriguez, and N. Amato, “Shepherding Behaviors,” Parasol Lab, Texas A& M., Tech. Rep., 2004.
[2] J. Lien, S. Rodriguez, J. Malric, and N. Amato, “Shepherding Behaviors with Multiple Shepherds,” Parasol Lab, Texas A& M., Tech. Rep., 2005.
[3] J. F. Harrison, C. Vo, and J.-M. Lien, “Scalable and Robust Shepherding via Deformable Shapes,” Department of Com-puter Science, George Mason University, USA, Tech. Rep., 2010.
[4] S. Razali, Q. Meng, and S.-H. Yang, “Multi-robot cooperation using immune network with memory,” inProceedings of the IEEE International Conference on Control & Automation (ICCA). IEEE, 2009, pp. 145–150.
[5] ——, “A refined immune systems inspired model for multi-robot shepherding,” inProceedings of the 2nd World Congress on Nature & Bio-inspired Computing (NaBIC). IEEE, 2010, pp. 473–478.
[6] M. B. Dillencourt, H. Samet, and M. Tamminen, “A general approach to connected-component labeling for arbitrary im-age representations,” Journal of the ACM (JACM), vol. 39, no. 2, pp. 253–280, 1992.
[7] L. Di Stefano and A. Bulgarelli, “A simple and efficient connected components labeling algorithm,” inImage Analysis and Processing, 1999. Proceedings. International Conference on. IEEE, 1999, pp. 322–327.
[8] A. Rosenfeld and J. L. Pfaltz, “Sequential operations in digital picture processing,” Journal of the ACM (JACM), vol. 13, no. 4, pp. 471–494, 1966.
[10] L. Shapiro. (2000, Spring) Recursive Connected Components Algorithm for Labeling Binary Images. CSE 326: Data Structures, Online Notes. University of Washington. Computer Science & Engineering, University of Washington, Seattle. Accessed Mar 1, 2013. [Online]. Available: http://courses.cs.washington.edu/courses/cse326/ 00sp/assignments/prog1.html
[11] L. G. Shapiro and G. C. Stockman,Computer Vision. New Jersey: Prentice-Hall, 2001.
[12] B. P. Gerkey, R. T. Vaughan, and A. Howard, “The Player/Stage Project: Tools for Multi-Robot and Distributed Sensor Systems,” in Proceedings of the 11th International Conference on Advanced Robotics, vol. 1, 2003, pp. 317–323.