AN EMPIRICAL ANALYSIS OF ASYMMETRIC DUOPOLY IN THE
INDONESIAN CRUDE PALM OIL INDUSTRY
Diana Chalil
A thesis submitted in fulfilment of the requirements for the degree of Doctor of Philosophy
Agricultural and Resource Economics
Faculty of Agriculture, Food and Natural Resources The University of Sydney
New South Wales Australia
Declaration
I hereby certify that the text of this study contains no material which has been
accepted as part of the requirements for any degree or diploma in any university, nor does
it contain any material previously published unless due reference to this material is made.
Diana Chalil
Abstract
The apparent increase in market concentration and vertical integration in the Indonesian
crude palm oil (CPO) industry has led to concerns about the presence of market power.
For the Indonesian CPO industry, such concerns attract more attention because of the
importance of this sector to the Indonesian economy. CPO is used as the main raw
material for cooking oil (which is an essential commodity in Indonesia) and it contributes
significantly to export earnings and employment. However, dominant producers argue
that the increase in economies of scale and scope lead to an increase in the efficiency,
which eventually will be beneficial for the end consumers and export earnings. This
research seeks to examine whether the dominant producers do behave competitively and
pass the efficiency gains to the end consumers, or they enhance inefficiency through
market power instead.
In order to identify the most suitable model to measure market power in the Indonesian
CPO industry, different market power models are explored. These models can be divided
into static and dynamic models. In general, all of them accept the price–cost margins as a
measure of market power. However, static models fail to reveal the dynamic behaviour
that determines market power; hence the dynamic models are likely to be more
appropriate to modelling market power. Among these dynamic models, the adjustment
model with a linear quadratic specification is considered to be a more appropriate model
to measure market power in the Indonesian CPO industry.
In the Indonesian CPO industry, producers can be divided into three groups, namely the
public estates, private companies and smallholders. However, based on their ability to
influence market price, smallholders are not considered as one of the dominant groups.
By using the adjustment cost model, the market power of the dominant groups is
estimated. The model is estimated using a Bayesian technique annual data spanning
1968–2003. The public estates and private companies are assumed to engage in a
non-cooperative game. They are assumed to use Markovian strategies, which permit firms to
their rivals’ previous action, implying that firms respond to changes in their rivals’
previous action.
The key contribution of this thesis is the relaxation of the symmetry assumption in the
estimation process. Although the existence of an asymmetric condition often complicates
the estimation process, the different characteristics of the public estates and private
companies lead to a need for relaxing such an assumption. In addition, the adjustment
system—which can be seen as a type of reaction function—is not restricted to have
downward slopes. Negative reaction functions are commonly assumed for a quantity
setting game. However, the reverse may occur in particular circumstances. Without such
restrictions, the analysis could reveal the type of interaction between the public estates
and private companies. In addition, it provides insights into empirical examples of
conditions that might lead to the positive reaction function. Furthermore, the analysis
adds to the understanding of the impact of positive reaction functions to avoid the
complicated estimation of the asymmetric case.
As expected, the public estates act as the leader, while the private companies are the
follower. Interestingly, results indicate that as well as the private companies, public
estates do exert some degree of market power. Moreover, the public estates enjoy even
higher market power than the private companies, as indicated by market power indices of
-0.46 and -0.72, respectively. The exertion of market power by both the public estates and
the private companies cast some doubts about the effectiveness of some current policies
in the Indonesian CPO industry. With market power, the underlying assumption of a
perfectly competitive market condition—that serves as the basis for the government
interventions—is no longer applicable. Hence, many government interventions are
unlikely to have the desired effect.
The Indonesian competition law that has been imposed since 1999 might be effective in
preventing firms to sign collusive contracts. In fact, even without such an agreement,
firms in the CPO industry are likely to exert some degree of market power. As an
public estates have the aim of maximising welfare, privatisation might improve their
efficiency, hence they have ability to suppress the private companies’ market power.
However, if in fact, the public estates deliberately reduce output to gain higher profit,
privatisation might increase the degree of market power of both groups of companies
even further. In such a condition, addressing the long term barriers of entry stemming
from the requirement of high investment might be a better alternative to address the
Acknowledgement
First, I wish to thank my supervisor Associate Professor Fredoun Ahmadi-Esfahani, who
first introduced me to the market power issue, encouraged me to think more analytically
and continuously guided me throughout my candidature. I would also like to thank Dr
Nicolas de Roos, who was always critical and helped me to improve my understanding of
the concepts and models being analysed in the thesis.
I am indebted to the Australian taxpayers who have financially supported me through the
Australian Agency for International Development (AUSAID) scholarship. I would also
like to acknowledge the financial support from the Faculty’s Postgraduate Research
Support Scheme for financially supporting my trips to conferences.
Special thanks go to Associate Professor Ross Drynan, who has willingly provided his
time to help me with many queries on dynamic and computer programming. I am also
grateful to Professors Jeff Perloff and Larry Karp for responding to my inquiries about
problems in estimation, and providing me with their forthcoming book about market
power. I am sincerely grateful to Ms. Lorraine Ryan, for her tireless encouragement in
improving my English writing. Without her support, I would have never accomplished
the entire thesis. I also wish to thank Mrs Carolyn Tanner and Rudy Ginting, for kindly
proofreading and editing my final draft, bringing much clarity in the thesis. I express my
deep gratitude to Fortunée Cantrell and Pamela Stern for always being helpful during the
entire period of my candidature.
My special thanks to my office-mate Emily Gray, not only for being a great colleague and
friend, but also her professional contribution to my thesis. Special thanks must also go to
my other colleagues Al Hajj, for helping me with computer programming, and to Chi
Truong and Dr Jean–Mark Kutschukian for the valuable discussions about the dynamic
model and estimation problems. I would also like to thank all my colleagues in the
Wallace Basement. Their hard work was so inspiring and their warm friendship was so
I would like to express my love to my late father, Ahmad Chalil Harahap, who was
always very encouraging and had great faith in me. My greatest appreciation goes to my
dearest mother, Hayati Chalil for her unconditional love and continued prayer. I would
also like to express my thanks to my brother, Syahrizal Chalil, my sister, Aldina Chalil,
my sister-in-law, brother-in-law and my nephews for their love. Finally, I would like to
humbly dedicate this achievement to my dearest husband Rosadi Young Adam and my
dearest son Ahmad Rasyid Maulana, who always stayed by my side along this long and
challenging road. Their love and understanding provided the motivation and strength that
I needed to continue and complete the work. Above all, I praise Allah the most merciful,
Table of Contents
Declaration ii
Abstract iii
Acknowledgement vi
Table of Contents viii
List of Tables xi
List of Figures xii
Chapter 1
Introduction 1
1.1 Basic research questions 3
1.2 Objectives of the study 4
1.3 Methods and data 4
1.4 Organisation of the study 5
Chapter 2
The Indonesian Crude Palm Oil Industry 8
2.1 The importance of the Indonesian crude palm oil industry 9
2.2 Features of the industry 12
2.2.1 The production pattern and homogeneity of the product 12
2.2.2 The strategic groups 16
2.2.3 Government intervention 18
2.3 Possible sources of market power 25
2.3.1 The requirement of high investment and market share 25
2.3.2 Vertical integration 29
Chapter 3
Market Power Models: A Review 32
3.1 Market power 32
3.2 Structure–conduct–performance approach 33
3.3 New empirical industrial organization approach 36
3.3.1 Static models 36
3.3.2 Dynamic models 52
3.4 Concluding comments 58
Chapter 4
Modelling Market Power in the Indonesian Palm Oil Industry 60
4.1 Theoretical model 60
4.2 Empirical model 66
4.3 Estimation method 74
4.4 Types of interaction 83
4.5 Concluding comments 87
Appendix 4
Appendix 4.1 The derivation of the optimal control function 88
Appendix 4.2 The solution for the Markovian strategy 90
Appendix 4.3 Asymmetric condition in the duopoly model 93
Appendix 4.4 Stability condition in an asymmetric duopoly case 94
Appendix 4.5 The range of Gij and vij in static model 95 Appendix 4.6 G matrix and vijin the asymmetric open–loop solution 97
Chapter 5
Data, Estimation and Results 102
5.1 Data 102
5.2 Demand equation and adjustment system 105
5.4 Adjustment cost parameter, market power index and
type of competition 116
5.5 Welfare analysis 122
5.5 Concluding comments 124
Appendix 5
Appendix 5.1 Research data 123
Appendix 5.2 Estimation result for the demand equation 126
Appendix 5.3 Estimation result for the adjustment system 127
Chapter 6
Policy Implications and Conclusions 128
6.1 Subsidies, negative price–cost margins and market power 128
6.2 Adjustment costs, pricing policy and market power 133
6.3 The leader–follower relationship and the role of
public estates as an internal regulator 135
6.4 The existence of market power 138
6.5 Limitations of the study and future research 141
6.6 Concluding comments 143
List of Tables
Table 2.1 Geographical distribution of oil palm plantations 15
Table 2.2 Comparison of CPO production costs, 1997 15
Table 2.3 Changes in the CPO Distribution System in 1998
and 1999 21
Table 2.4 Indonesian CPO export ban and export tax 22
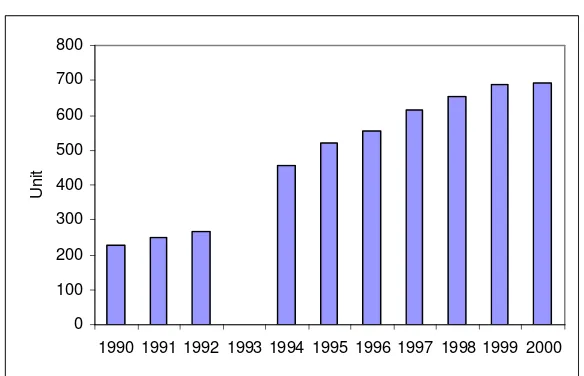
Table 2.5 Growth in the number and capacity of CPO
processing plants, 1990–2003 28
Table 2.6 Market share of the dominant cooking oil producer groups,
1996–2004 28
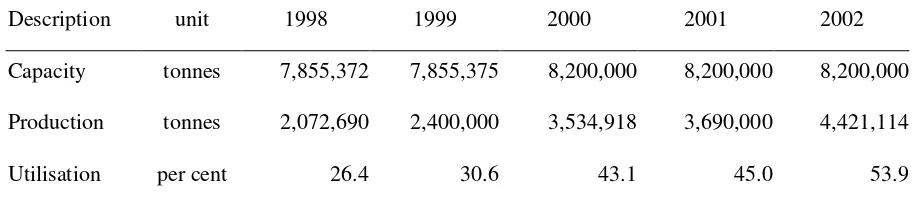
Table 2.7 Utilisation of the Indonesian refineries, 1998–2002 29
Table 4.1 Output response and implied market interactions 87
Table 5.1 Statistical summary of research data 104
Table 5.2 Estimation of the adjustment system 111
Table 5.3 Results of the Monte Carlo numerical integration using
asymmetric matrix 113
List of Figures
Figure 2.1 CPO real demand from the cooking oil industry,
1980–2003 9
Figure 2.2 Indonesian production and export of CPO, 1995–2002 10
Figure 2.3 Growth of palm oil exports, 1981–2002 11
Figure 2.4 The palm oil industry 13
Figure 2.5 The production stages of the oil palm tree 14
Figure 2.6 CPO production and palm cooking oil consumption,
1984–1990 19
Figure 2.7 Development of the public and private estate production
and the palm cooking oil consumption, 1996–2002 20
Figure 2.8 Growth in the number of plantations, 1990–2000 24
Figure 2.9 The Indonesian oil palm plantation share by area,
1967–2003 27
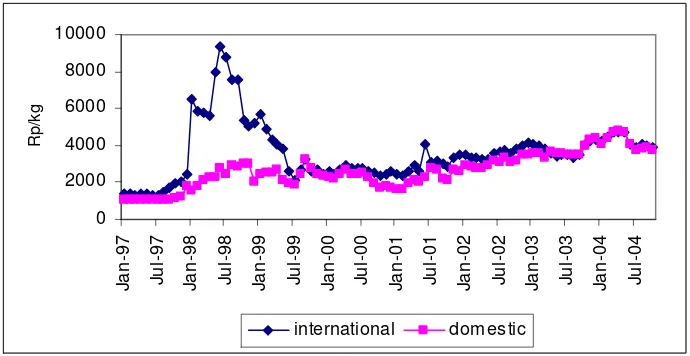
Figure 2.10 Average CPO prices in the domestic and international
market, 1997–2004 30
Figure 3.1 Effect of changes in exogenous variable without interactive
term on the demand function 44
Figure 3.2 Effect of changes in exogenous variable with interactive
term on the demand function 45
Figure 3.3 Supply relationships under different models of conduct 51
Figure 4.1 Single-period pay-offs for a large firm and a small firm 64
Figure 4.2 Changes in consumer surplus 74
Figure 4.3 Relationship between v and G values 76
Figure 4.4 The estimation process 77
Figure 5.1 CPO cross price elasticities of demand, 1969–2003 108
Figure 5.2 CPO own price elasticities of demand, 1969–2003 109
Figure 5.2 Probability distribution function of θ1 and θ2 114
Figure 5.3 Rate of production of the public and private groups,
1971–2003 114
Figure 5.4 Probability distribution function of v1 and v2 115
Figure 5.5 Log function distribution 119
Figure 5.6 f
( )
. probability distribution function 119Figure 5.7 g
( )
. probability distribution function 120Figure 6.1 Subsidies and welfare 130
Abstract
The apparent increase in market concentration and vertical integration in the Indonesian
crude palm oil (CPO) industry has led to concerns about the presence of market power.
For the Indonesian CPO industry, such concerns attract more attention because of the
importance of this sector to the Indonesian economy. CPO is used as the main raw
material for cooking oil (which is an essential commodity in Indonesia) and it contributes
significantly to export earnings and employment. However, dominant producers argue
that the increase in economies of scale and scope lead to an increase in the efficiency,
which eventually will be beneficial for the end consumers and export earnings. This
research seeks to examine whether the dominant producers do behave competitively and
pass the efficiency gains to the end consumers, or they enhance inefficiency through
market power instead.
In order to identify the most suitable model to measure market power in the Indonesian
CPO industry, different market power models are explored. These models can be divided
into static and dynamic models. In general, all of them accept the price–cost margins as a
measure of market power. However, static models fail to reveal the dynamic behaviour
that determines market power; hence the dynamic models are likely to be more
appropriate to modelling market power. Among these dynamic models, the adjustment
model with a linear quadratic specification is considered to be a more appropriate model
to measure market power in the Indonesian CPO industry.
In the Indonesian CPO industry, producers can be divided into three groups, namely the
public estates, private companies and smallholders. However, based on their ability to
influence market price, smallholders are not considered as one of the dominant groups.
By using the adjustment cost model, the market power of the dominant groups is
estimated. The model is estimated using a Bayesian technique annual data spanning
1968–2003. The public estates and private companies are assumed to engage in a
non-cooperative game. They are assumed to use Markovian strategies, which permit firms to
their rivals’ previous action, implying that firms respond to changes in their rivals’
previous action.
The key contribution of this thesis is the relaxation of the symmetry assumption in the
estimation process. Although the existence of an asymmetric condition often complicates
the estimation process, the different characteristics of the public estates and private
companies lead to a need for relaxing such an assumption. In addition, the adjustment
system—which can be seen as a type of reaction function—is not restricted to have
downward slopes. Negative reaction functions are commonly assumed for a quantity
setting game. However, the reverse may occur in particular circumstances. Without such
restrictions, the analysis could reveal the type of interaction between the public estates
and private companies. In addition, it provides insights into empirical examples of
conditions that might lead to the positive reaction function. Furthermore, the analysis
adds to the understanding of the impact of positive reaction functions to avoid the
complicated estimation of the asymmetric case.
As expected, the public estates act as the leader, while the private companies are the
follower. Interestingly, results indicate that as well as the private companies, public
estates do exert some degree of market power. Moreover, the public estates enjoy even
higher market power than the private companies, as indicated by market power indices of
-0.46 and -0.72, respectively. The exertion of market power by both the public estates and
the private companies cast some doubts about the effectiveness of some current policies
in the Indonesian CPO industry. With market power, the underlying assumption of a
perfectly competitive market condition—that serves as the basis for the government
interventions—is no longer applicable. Hence, many government interventions are
unlikely to have the desired effect.
The Indonesian competition law that has been imposed since 1999 might be effective in
preventing firms to sign collusive contracts. In fact, even without such an agreement,
firms in the CPO industry are likely to exert some degree of market power. As an
public estates have the aim of maximising welfare, privatisation might improve their
efficiency, hence they have ability to suppress the private companies’ market power.
However, if in fact, the public estates deliberately reduce output to gain higher profit,
privatisation might increase the degree of market power of both groups of companies
even further. In such a condition, addressing the long term barriers of entry stemming
from the requirement of high investment might be a better alternative to address the
Chapter 1
Introduction
In recent decades, the problem of market distortion in the Indonesian crude palm oil
(CPO) industry has been widely discussed. The issue is a source of public concern
because CPO has been an important contributor to the Indonesian economy for at least
three reasons. Firstly, cooking oil, an end product of the CPO industry, is an essential
commodity in Indonesia. As an essential commodity, the fluctuations in cooking oil
prices appear to influence not only economic stability in Indonesia, but also political
stability. Secondly, the industry is a major contributor to Indonesia’s exports. In 2002,
palm oil exports grew by 93 per cent, which was the highest rate among all sectors
contributing to export revenue (Indonesian Bureau of Statistics 2003). This has been the
case both in periods of strong economic growth and during the economic crisis of 1997–
1998 (Susila 2003). Finally, the CPO industry is a significant employer, which is
important given Indonesia’s large population. It is estimated that in 2002, 1.2 million
people worked in the Indonesian palm oil production and processing industries, and that
around 5.5 million people were being supported by this industry (Barlow et al. 2003, p. 9).
The CPO industry has been the focus of many acts of government intervention. The main
purpose of these interventions has been to ensure that the cooking oil price remains
stable, either by subsidising CPO and cooking oil prices, or by imposing CPO export
taxes. However, these policies are not always effective. Although Indonesia is arguably
known as the most cost efficient CPO producer in the world, the cooking oil price in the
domestic market is often higher than that of in the international market’s. Theoretically,
efficient producers can sell their output at a low price. If producers are vertically
integrated with the downstream industry, lower prices will be transmitted to the final
output. However, such assumptions hold only when producers behave competitively. If
the CPO producer exerts some degree of market power, prices will remain above the
marginal cost of production. As a result, low production costs will not be followed by
output prices. Arifin (2002) suggests that both government interventions and CPO
producers’ non-competitive behaviour might explain the distortions in the CPO market.
While studies such as Larson (1996), Marks et al.(1998) and Hasan (2000) have scrutinised the impact of the government interventions, to date no study appears to have
been addressed the impact of the CPO producers’ behaviour on the market.
In Indonesia, CPO producers can be divided into three groups: public estates, the private
companies and the smallholders. Before 1986, public estates were the dominant group in
the Indonesian CPO market. Triggered by the 1986–1996 distribution of concessionary
credits, in 2003, private companies and smallholders gradually increased their share,
reaching 50 per cent and 40 per cent of the market, respectively (Indonesian Bureau of
Statistics 2004). The public estates and private companies tend to be more integrated with
both the upstream industry (such as the seed gardens) and the downstream industry (such
as the cooking oil refineries). In contrast, smallholders do not possess such facilities.
They also suffer from diseconomies of scale and are lack of joint marketing associations.
Hence, although the total size of smallholders has reached 40 per cent of the market
share, this group is not considered as one of the dominant groups in the industry.
A number of economists believe that this change in structure might allow the dominant
producers to control market price, and hence exercise market power (Basri 1998;
Pasaribu 1998; Rachbini 1998; Arifin 2001; Competition Indonesia 2001; Arifin 2002;
Widjojo 2004; Syachrudin 2005). In 2001, the Indonesian Commission for the
Supervision of Business Competition (2001) indicated that one of the largest and most
vertically integrated firms in the palm oil industry might exercise market power, yet
failed to provide empirical evidence to support this claim. In fact, high market shares and
vertical integrations might increase firms’ efficiency rather than market power. For this
reason, empirical analysis is essential to an examination of market power. A likely
complication is that market power, although well-defined, is not always easy to be
measured. These concerns constitute the motivation for this research to model and
1.1 Basic research questions
Despite the importance of the CPO industry for Indonesia, and concerns over the
presence of market power, to the author’s best knowledge, to date no study has been
taken to investigate market power in this industry. This research is designed to fill the
void by modelling and measuring market power in this industry. Specifically, the
following research questions are addressed:
• What is the most appropriate model to analyse and measure market power in the Indonesian CPO industry?
• Do the dominant players in the Indonesian CPO industry exercise market power? • If these players do exert market power, does market power vary among them? • What is the type of interaction between the players?
• What factors do affect the type of interaction between the players? • What are the policy implications of the research findings?
The answers to the questions will provide useful information for promoting competition
in the Indonesian CPO industry. Loughlin et al. (1999, p. 26) suggest that the understanding of competition issues among policy makers in Indonesia is often narrowed
to market concentration or conglomerates, while in fact, competition is a more complex
issue. A descriptive or statistical analysis that is often employed appears inadequately to
prove whether producers in an industry behaved competitively or exercised some degree
of market power. In contrast, a model could provide a measurement that reveals the
behaviour of the producers, even that emerge from a non-cooperative mechanism.
Although competition laws might not be able to address such tacit collusion, the evidence
is useful for the policy makers in addressing the market power problems. Despite the fact
that the competition issue in Indonesia has been widely examined from a legal
perspective—especially after the introduction of the competition law—no market power
model has been introduced as a tool to measure market power. The proposed analytical
framework of this thesis is expected to give insights for modelling and measuring market
1.2 Objectives of the study
Based on the previous research questions, the aims of this study are:
• To understand the relevant features of the Indonesian CPO industry in developing a framework for the theoretical and empirical model;
• To explore various market power models and to determine the most suitable model for the Indonesian CPO industry;
• To develop an empirical model to estimate the type of interaction and the degree of market power held by the dominant players, and to analyse possible factors that
might explain the results; and
• To use the estimation results to assess the effectiveness of current government policies and to propose some alternative policies that might prevent the abuse of
market power and increase social welfare.
1.3 Methods and data
The study employs a dynamic duopoly model to measure the market power of dominant
players in the Indonesian CPO industry. Specifically, an adjustment cost model with a
linear quadratic specification is considered mostly appropriate to capture the important
features of the industry. In particular, the long maturation period and an extended
economic life in the CPO production pattern induce the substantial adjustment costs
associated with changing the level of production.
In this dynamic duopoly model, the reaction functions of the players are modelled
through an adjustment system. In a static model, the slope of a reaction function is
conjecture about its rivals’ reactions causes the firm to change its own actions. The
conjectural variation values are also interpreted as the market power index. In contrast, in
this dynamic model, the slope of a reaction function is the actual response rather than the
conjecture of the response. The market power index is not directly inferred from but is
calculated using the value of the slope. The index nests all possible behaviours, from
perfectly competitive to perfectly collusive.
In order to capture the specific characteristics of each duopolist, the symmetry
assumption—that is common in the previous studies—is relaxed. With a symmetry
assumption, the responses of both firms will be identical. Therefore, it can only show
whether the firms interact cooperatively or non-cooperatively. Without the assumption of
symmetry, the slope of a firm’s reaction function will show the firm-specific response.
Hence, a more complex pattern of interdependence will be revealed (Gollop and Roberts
1979). The relationship between the firms’ degrees of market power and the type of
interaction between the firms provides insights into possible sources of the market power.
The linear quadratic specification is useful as it allows the estimation of the market power
index without using any cost data. Ideally, firm-level data would provide the best
information about market power in the industry. However, firm-level data are
insufficient, and therefore group data are used as an alternative.
1.4 Organisation of the study
A plethora of approaches to modelling market power are reported in the literature,
focusing on different aspects of the problem and using different frameworks. In order to
identify the most suitable model to the Indonesian CPO industry, the main features of the
industry are explored in Chapter 2. This chapter explains the reasons behind setting the
public estates and private companies groups as the dominant players in the industry. The
different characteristics of these groups are discussed, highlighting the requirement of an
asymmetric duopoly model. In addition, the existence of an intertemporal link is also
In Chapter 3, various models of market power are explored. In comparing these models,
the chapter focuses on the main factor that determines market power in an oligopolistic
(duopolistic) market, which is the ability of oligopolists (duopolists) to respond to their
rivals’ actions. These models are divided into models using the structure–conduct–
performance approach and the new empirical industrial organization (NEIO) approach.
The structure–conduct–performance approach includes various static models, while the
NEIO approach includes both static and dynamic models. In addition, the NEIO static
models are grouped into the comparative and conjectural variations models, while the
NEIO dynamic models are grouped into the repeated-game and the state-space game
models. The assumptions employed in each model are discussed to determine the
appropriateness of its application in certain cases.
Chapter 4 explores the theoretical and empirical models in greater details. The theoretical
model provides the foundation of the state-space game framework. Three different
strategies—the open-loop, closed-loop and Markovian strategies—widely used in
previous studies are discussed. This is followed by a discussion of the Lagrangean
multiplier and dynamic programming as the tools for obtaining the optimal solution. The
empirical model presents the adjustment cost model with a linear quadratic specification.
The relevance of this model for the CPO industry and the importance of its specification
for market power estimation are discussed. The reasons for relaxing the symmetry
assumption in the Indonesian CPO industry case are highlighted. The model is estimated
using a Bayesian technique in order to impose the stability, convexity and market power
properties of the model. In the last section of Chapter 4, the estimation procedure is
presented.
The model is estimated by using annual data for the period of 1968–2003. The estimation
results are presented in Chapter 5. Firstly, the results of the demand equation and the
adjustment system are presented. The results from the adjustment system provide insights
into the impact of positive reaction functions in avoiding the complicated estimation of
the asymmetric case. Secondly, given these estimates, the adjustment cost parameter and
market power index are calculated. The Monte Carlo numerical integration results are
market power index properties. This is followed by a discussion of the accuracy of the
estimation. Finally, the type of interaction and the degree of market power exerted by the
dominant groups are detailed.
Based on these findings, several policy implications of the analysis are considered in
Chapter 6. The effectiveness of the subsidy and export tax policies is examined. The role
of the public estates and the effectiveness of Law No.5/1999 as an instrument to suppress
market power in this industry are also discussed. Then, some possible alternative policies
to address the market power problem are provided. Limitations of the study are outlined,
leading to some avenues for further research. Finally, a number of concluding comments
Chapter 2
The Indonesian Crude Palm Oil Industry
The structure of the Indonesian crude palm oil (CPO) industry has undergone a number
of significant changes since the first large-scale establishment of an oil palm plantation in
1911. The public estates’ share of production is decreasing, overtaken by a group of
private companies (Directorate General of Plantation 2004), and vertical integration
among oil palm plantations, crude palm oil millers and cooking oil refineries is increasing
(BIRO 1999). Also, the regulatory environment in this industry appears to be moving
towards free trade, by reducing the palm oil export taxes (Tomich and Mawardi 1995,
cited in Sugiyanto 2002, pp. 18-19).
On one hand, these changes may increase cost efficiency, as they increase economies of
scale and scope, which in turn may benefit consumers through lower output prices. Noor
et al. (2004) show that the cost of production index of fresh fruit bunches (FFB)—that is the output from the oil palm trees—steadily decreases from 100 to less than 80 with an
increase in estate size from less than 100 ha to 3,500 ha. Similarly, the cost of processing
index of CPO steadily decreases from 100 to 80 with an increase in CPO mill capacity
from less than 20 tonnes of FFB/ hour to more than 50 tonnes of FFB/ hour. They show
that, in general, non-integrated mills are more costly than their integrated counterparts. In
addition, vertical integration between the oil palm estates and CPO mills allows the CPO
mills to operate without interruption, which further increases the mills’ efficiency. On
the other hand, the increase in market share and vertical integration of large private
companies in this industry might also provide them with an ability to control market
prices and exercise market power (Basri 1998; Pasaribu 1998; Rachbini 1998; Arifin
2001; Competition Indonesia 2001; Arifin 2002; Widjojo 2004; Syachrudin 2005).
However, these allegations could not be supported by evidence.
This research seeks out to model and measure market power in the Indonesian palm oil
industry. The main features of the Indonesian palm oil industry are explored in this
section 2.2, the main features of the industry are described. These features will be useful
later on in choosing the most appropriate model for the Indonesian palm oil industry. In
section 2.3, possible factors that can lead to market power are examined. Finally, some
concluding comments are presented in section 2.4.
2.1 The importance of the Indonesian crude palm oil industry
The importance of the CPO industry in the Indonesian economy arises from at least three
conditions. First, CPO is used as the main raw material for cooking oil, which is an
essential commodity in Indonesia. Demand for cooking oil is strong and has gradually
been increasing as Indonesia’s population growth and purchasing power increased
(Amiruddin et al. 2005). Population increased from 150 million in 1980 to 217 million in 2003, and the real gross domestic product volume index (2000=100) almost tripled from
40 in 1980 to 114 in 2003 (International Financial Statistics 2006). Overall, cooking oil
consumption per capita has significantly increased from 0.08 litre per capita in 1980 to
0.19 litre in 2003, resulting in an increase in CPO demand (2000=100) from the cooking
oil refineries from 14.7 millions Rupiah in 1980 to 29.4 millions Rupiah in 2003
(Indonesian Bureau of Statistics various issues-a) as shown in Figure 2.1.
Figure 2.1 CPO real demand from the cooking oil industry, 1980–2003
0 10 20 30 40 50 60 70
1980 1982 1984 1986 1988 1990 1992 1994 1996 1998 2000 2002
M
il
li
o
n
s
R
u
p
ia
h
Second, CPO is one of the main contributors to Indonesia’s export revenue. From 1979 to
1987, the government limited CPO exports to ensure an adequate supply for the domestic
cooking oil industry. Since 1988, when CPO production increased sharply, this restriction
was no longer necessary and exports started to grow again. From 1995 to 2002, on
average, more than half of the total CPO production was exported (see Figure 2.2).
Figure 2.2 Indonesian production and export of CPO, 1995–2002
0 1000 2000 3000 4000 5000 6000 7000 8000 9000 10000
1995 1996 1997 1998 1999 2000 2001 2002
T
h
o
u
s
a
n
d
t
o
n
n
e
s
export production
Source: Indonesian Bureau of Statistics (various issues-b).
The volume of CPO exports declined only during the economic crisis of 1997–1998,
resulting from the imposition of the export ban and high export tax. During the economic
crisis, the Rupiah–U.S dollar exchange rate significantly decreased, and selling in the
international market became more profitable than selling domestically. CPO exports
increased sharply, leading to a significant reduction in domestic supply. Coupled with the
annual increase in domestic demand during New Year, Ramadhan and Eid Fitr (Muslim
festive seasons), this led to a significant increase in the domestic price. To address this,
the Indonesian government banned CPO exports from the end of December 1997 to
March 1998. However, as the export ban significantly decreased national income and led
to smuggling, in July 1998, the government lifted the ban and replaced it with an export
tax of 60 per cent (Marks et al. 1998, pp. 53-54). Despite the decline in the volume of CPO exports, along with a significant increase in the CPO world price, the revenue from
and after the crisis. As the second largest CPO producer in the world, the decrease in
Indonesia’s volume of exports during the export ban and high export tax significantly
increased the CPO world price. When domestic prices returned to their pre-crisis level,
the government gradually reduced the export tax. CPO exports rose and reached a 71 per
cent share of total production in 2002. With a growth rate of 93 per cent, the CPO
industry recorded the highest growth in export revenues among all the contributing
sectors (see Figure 2.3).
Figure 2.3 Growth of palm oil exports, 1981–2002
0.E+00 5.E+05 1.E+06 2.E+06 2.E+06 3.E+06
1979 1981 1983 1985 1987 1989 1991 1993 1995 1997 1999 2001 2003
U
S
$
Source: Indonesian Bureau of Statistics (various issues-b).
Third, the industry employs a large number of workers. This is important in Indonesia
where a high unemployment rate is still a problem, especially since the economic crisis.
In 2005, there were almost 11 million unemployed workers, resulting an unemployment
rate of 10.26 per cent (Indonesian Bureau of Statistics 2006). In 1994, more than 250
thousand workers were recorded as permanent workers on the oil palm estates. Six years
later, the number had almost doubled to more than 450 thousand (Indonesian Bureau of
Statistics various issues-c). Permanent workers are estimated to comprise one third of
total workers in the CPO industry. Including casual workers in estates and all workers in
processing industries, the total number employed is between 1.2 and 2 million people
In summary, the CPO industry plays an important role in the Indonesian economy. It
affects consumers, the government and producers. For consumers, palm oil is important
because it is used as the main raw material for cooking oil. For the government, it
contributes to significant export earnings and employment. For producers, it is found to
be a profitable business, both for large companies and for smallholders. Accordingly, if
producers in this industry exercise some market power, the impacts can be wide ranging
and significant. Thus, it is important to analyse the market power issue in this industry.
2.2 Features of the industry
2.2.1 The production pattern and homogeneity of the product
The palm oil industry is an industry which produces a huge range of commodities based
on the fresh fruit bunches (FFB) (output from the oil palm/ Elais guineensis sp. tree). Among the various commodities, cooking oil appears to be most important to Indonesian
economic sector. From 1993 to 2003, on average, the cooking oil industry accounted for
75 per cent of palm oil usage. The remainder was used in the oleochemical (13 per cent),
soap (7 per cent) and margarine/shortening (5 per cent) industries (CIC 1994, 1997, 2003,
2004). This study focuses on the CPO industry as a part of the cooking oil production
chain. Figure 2.4 illustrates the production chain of cooking oil (shown by the shaded
area), as a part of the whole palm oil industry. After being harvested, FFB are processed
in the mills to extract the CPO. Then, they are further processed in the refineries to
produce the refined, bleached and deodorised olein, which in its pure form could be sold
as cooking oil.
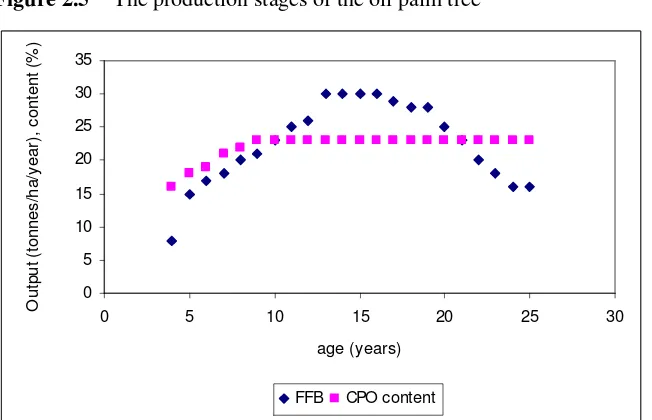
The production of FFB is a long term process. The maturation period between initial
input and first output is about three years. Then, FFB yield gradually increases from eight
for about four years, then decreases slowly and remains steady at 16 tonnes/ ha/ year until
the end of the oil palm tree’s economic life at the age of 25 (see Figure 2.5). 1
Figure 2.4 The palm oil industry
Source: van Gelder (2004, p. 3).
The mature age comprises three periods: the periods when the oil palm is considered
young (3–8 years), prime (9–20 years) and old (>20 years). Each period has different
levels of productivity and oil content. On average, the mature FFB contain 23 per cent
1
With a production cycle that lasts for several years, capital used in the CPO production process can be seen as a quasi-fixed input. For such an input, it is more expensive to make changes quickly, hence they are spread over time (Perloff et al. 2005 chapter 7, p.3).This shows that the existence of quasi-fixed inputs in a
Oil palm plantation
Fresh fruit bunches
CPO mill
Crude palm oil (CPO) Palm kernels
Refinery
Crushing plant
Refined, bleached and deodorised palm oil
(RBDPO)
Oleo chemical plant
Crude palm kernel oil (PKO)
Palm kernel meal
Refinery
RBD PKO Fatty acids, fatty
alcohols, esters, glycerin RBD Olein RBD Strearin
Food industry
Detergent and cosmetics industry
Chemical and other industries
CPO, but this depends on when the FFB are harvested. To gain the maximum oil
possible, FFB need to be picked at the right level of ripeness. However, the ripeness level
changes quickly. Unless the FFB are processed within 24 hours of harvesting, the amount
of free fatty acid (FFA) will quickly increase. The FFA reacts to oxygen and causes the
[image:30.612.94.420.200.410.2]oil to develop a rancid taste, thus damaging the CPO quality (van Gelder 2004, pp. 4-5).
Figure 2.5 The production stages of the oil palm tree
0 5 10 15 20 25 30 35
0 5 10 15 20 25 30
age (years) O u tp u t (t o n n e s /h a /y e a r) , c o n te n t (% )
FFB CPO content
Source: Marihat and Plantation Research Centre cited in CIC (2004, p. 22).
Generally, CPO has a single standard quality and price in both domestic and international
markets. The standard specifies FFA content of less than 5 per cent, moisture and
impurity levels less than 0.5 per cent, and an iodine value of less than 51 per cent
(Alibaba.com 2006). Hence, it would be reasonable to treat CPO as homogeneous
product.
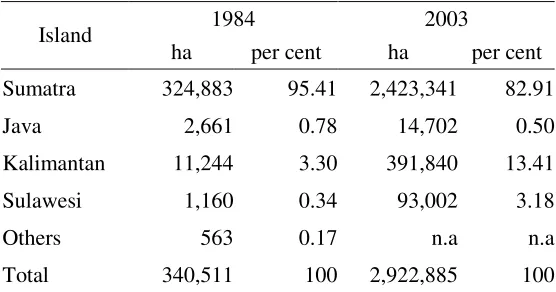
Another factor that determines palm oil productivity is soil condition. Initially most of the
Indonesian oil palm plantations were located in Sumatra Island, because these areas have
land highly suitable for oil palm trees. In 1984, 324,883 hectares of oil palm plantations
had been established in Sumatra. Two decades later, the oil palm plantation area in
Table 2.1 Geographical distribution of oil palm plantations
1984 2003
Island
ha per cent ha per cent Sumatra 324,883 95.41 2,423,341 82.91 Java 2,661 0.78 14,702 0.50 Kalimantan 11,244 3.30 391,840 13.41 Sulawesi 1,160 0.34 93,002 3.18
Others 563 0.17 n.a n.a
Total 340,511 100 2,922,885 100 Source: Indonesian Bureau of Statistics (various issues-e).
Oil palm plantations on Sumatra were found to be more profitable than those in other
islands because they yielded higher production at a minimum cost. Moreover, the
infrastructure and services that were needed for the plantation establishment were already
developed. However, as land became more limited in Sumatra, the plantation
establishment was extended to other lands, especially those more suited to oil palm
production, such as Kalimantan and Sulawesi. From 1984 to 2003 the oil palm plantation
area in Kalimantan and Sulawesi islands had increased more than 30 (from 11,244
hectares in 1984 to 391,840 hectares in 2003) and 90 times (from 1,160 hectares in 1984
to 93,002 hectares in 2003), respectively. Given land suitability and low labour costs, in
1997, Indonesia was recorded as the most cost efficient CPO industry in the world. The
cost of production was 14.3 per cent lower than the world average and 8.3 per cent lower
[image:31.612.90.368.81.227.2]than Malaysia’s, which is the largest palm oil producer in the world (see Table 2.2).
Table 2.2 Comparison of CPO production costs, 1997 US$ per tonne
Colombia
Cote
d'Ivoire Indonesia Malaysia Nigeria
2.2.2 The strategic groups
In Indonesia, three different groups of CPO producers can be identified: the public
estates, private companies and smallholders groups. The public estates group comprises
10 public estates with a single Joint Marketing Office. Hence, it is assumed that all of
these estates act strategically as a coordinated group. The private companies are
dominated by 10 conglomerates (Casson 2000). Unlike the public estate, they do not have
a single marketing office. However, together with the public estates, these conglomerates
are the members of the Indonesian Palm Oil Producers Association. The existence of
such an association allows the members to homogenise their perceptions of both the
market state and other firms’ information (Clarke, 1983). Therefore, the private
companies are also assumed to act strategically as a coordinated group.
The public estates and private companies are usually organised on traditional lines from
president director to local supervisors. Most possess good infrastructure and operate
estates with size more than the minimum efficient scale. On average, the size of an
individual public or private estate is approximately 10,000–25,000 ha, and is usually a
part of a larger group whose estates ranging from 100,000 to 600,000 ha (Casson 2000).
Both public estates and private companies appear to be highly vertically integrated, from
the seed gardens to the cooking oil refineries. They have good access to capital markets,
new technologies and information. However, public estates tend to be more bureaucratic,
less adaptable to change and consequently less efficient (Barlow et al. 2003, pp. 10-13; van Gelder 2004, pp. 31-45; LONSUM 2005).
Smallholders appear to have a different organisation from that of the public estates and
private companies. In general, they tend to have a lack of technical knowledge, for
example many of them could not distinguish poor and good seeds and periodically
purchase the low yielding seedlings. Others plant without terracing or following the
appropriate fertilizer applications. This leads the smallholders to produce crops of low
yield and quality. While on average, the private companies and public estates could
produce 20 and 15 tonnes per ha, respectively, smallholders could only produce 10
Smallholders can be divided into supported and independent growers. On average, the
size of supported smallholders’ individual plantations can be less than five ha, while that
of the independent ones is less than 20 ha. Without sufficient economies of scale,
smallholders are unable to operate their own CPO mills or other essential facilities, and
do not have access to capital market to obtain credit for planting. Supported growers are
integrated with public estates or private companies, with whom they often have verbal or
written contract to sell their products. In contrast, independent growers cultivate their oil
palm crops without any assistance and sell their Fresh Fruit Bunches either directly to
local mills or through service providers. However, both the supported and independent
smallholders often have problems in selling their products, especially in determining the
quality and price of their products.
The quality of Fresh Fruit Bunches is mainly determined by their oil content or CPO
rendement. Problems in determining the quality of their products stem from several
factors. First, given a lack of knowledge to choose good seedlings and to apply the
appropriate technique of production, many of smallholders produced Fresh Fruit Bunches
with low level of oil content. Second, the rendement is not the same among each of the
smallholders’ products. Third, most of smallholders do not have enough knowledge to
measure the rendement of the oil palm.
Similarly, problems in determining the price of their products arise from several factors.
First, while market prices fluctuate in daily bases, prices offered to smallholders are
calculated based on the 2-week average prices, hence current market prices are not
always the same as prices received by the smallholders. This gives incentives for
supported smallholders to break their agreement with the public estates or private
companies and sell their products to other millers that offer higher price. Second, with no
processing facilities and given the perishability of the Fresh Fruit Bunches, smallholders
appear to have low bargaining power and often have to accept prices offered by the
buyers (Susila 2004). Accordingly, in 1993, during the peak season, hundreds of tonnes
of Fruit Fresh Bunches produced by the smallholders were spoiled as they were not
processed within 24 hours. Capacities of the CPO mills were less than the Fresh Fruit
their integrated estates rather than that of the smallholders. However, after the
implementation of Otonomi Daerah (Local Authority) in 2001, many independent CPO mills—which were not supported by oil palm estates—were established with permits
from the kabupaten (regional)authorisation. In fact, such mills help smallholders to avoid delays in processing their Fresh Fruit Bunches production. Some of them even finally
sign agreements to integrate with the independent smallholders.
Smallholders do not have any joint marketing associations, and have areas less than 200
ha, smallholders are not listed as members of the Indonesian Palm Oil producers
Association. In 2001, the government helped smallholders to establish their own
association called Indonesian Association of Palm Oil Farmers (Assosiasi Petani Kelapa Sawit Indonesia/ APKASINDO). It accommodated some of the smallholders’ inspiration, but this association still has not dealt with any marketing arrangement, hence
smallholders do not act strategically. Together with the perishable characteristic of the
Fresh Fruit Bunches and lack of processing facilities, smallholders appear to be price
takers. Therefore, although the total size of smallholders’ production has reached 40 per
cent of the market share, we could argue that they are effectively a (high-cost)
competitive fringe. Hence, this group is not considered as one of the strategic groups in
the industry.
2.2.3 Government intervention
There has been a high degree of interference in the palm oil industry by the Indonesian
government, including domestic market obligations, export taxes, subsidies, and
plantation size limitations. The domestic market obligations and export taxes policies
were imposed when the CPO international price significantly increased, giving incentives
for the producers to increase their export, while there was a lack of CPO supply in the
domestic market. As a result, the CPO domestic price increased, as did the cooking oil
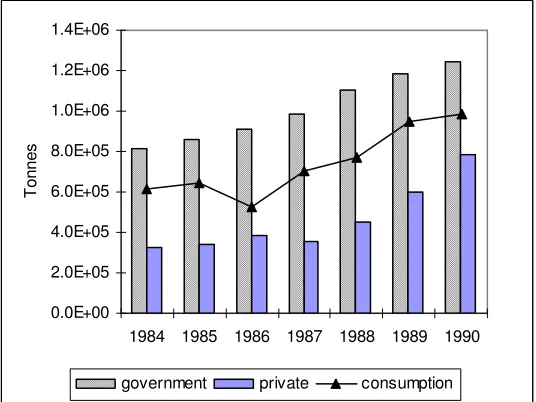
When this price remained high, say for a month, the government required CPO producers
to distribute a certain amount of their production at a certain price to meet all domestic
consumption. During 1984–1990, the public estates group was still the largest CPO
producer. With adequate production from the public estates, the domestic market
obligation policy was likely to be effective in increasing the domestic supply to meet all
[image:35.612.94.362.236.437.2]domestic consumption (see Figure 2.6).
Figure 2.6 CPO production and palm cooking oil consumption, 1984–1990
0.0E+00 2.0E+05 4.0E+05 6.0E+05 8.0E+05 1.0E+06 1.2E+06 1.4E+06
1984 1985 1986 1987 1988 1989 1990
T
o
n
n
e
s
government private consumption
Source: Indonesian Bureau of Statistics (2004); Oil World in KPB (various issues).
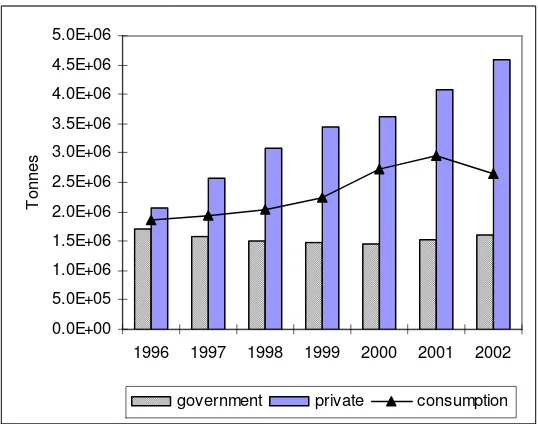
Since 1996, private companies have replaced the public estates’ role as the main CPO
producer. The public estates’ share was no longer sufficient to cover all of the domestic
consumption and needed some contribution from private companies’ production (see
Figure 2.7), whereas in fact, the domestic market obligations policy does not apply to
Figure 2.7 Development of the public and private estates production and the palm cooking oil consumption, 1996–2002
0.0E+00 5.0E+05 1.0E+06 1.5E+06 2.0E+06 2.5E+06 3.0E+06 3.5E+06 4.0E+06 4.5E+06 5.0E+06
1996 1997 1998 1999 2000 2001 2002
T
o
n
n
e
s
government private consumption
Source: Directorate General of Plantation, Department of Agriculture (2004) and CIC (2003).
During this period, various schemes were still used to directly control the market
distribution of CPO produced by the public estates. Table 2.3 shows the changes in the
CPO distribution system determined by government policies. Each of the policies
appeared to hold for a brief period, indicating that the DMO policy was no longer
effective to stabilise the domestic price. For example, initially the CPO and cooking oil
distributions were monopolised by BULOG (Badan Urusan Logistik or the Government Logistic Institution). In May 1998, the monopoly right was replaced by the State Joint
Table 2.3 Changes in the CPO Distribution System in 1998 and 1999
April 1998 State-owned plantation companies were told to supply their entire CPO production to the three government-owned refineries (which were supported by 12 additional refineries owned by smaller private producers), as opposed to 12 private refineries. Cooking oil produced by these refineries would be distributed by BULOG and other state-owned distribution companies to ensure price stabilisation in the market. Distribution of cooking oil processed by the private sector was independent of this system.
25 May 1998
The new Habibie government signed a Ministerial decree which revoked the exclusive rights given to private companies to process CPO produced by state-owned plantation firms.
27 May 1998
BULOG was stripped of its role to distribute CPO in the domestic market and the Government made the State Joint Marketing Office (Kantor Pemasaran Bersama,
KPB) and the state distribution company PT Dharma Niaga responsible for ensuring the supply of cooking oil around the country. Under the new scheme, KPB would buy all the cooking oil from the Association of Indonesian Cooking Oil Industries (AIMMI) and sell it directly to market retail cooperatives (Inkoppas) in the city at a subsidised price.
July 1998 The government directed PT Dharma Niaga to sell olein at a subsidised price to the cooperatives, which were supposed to channel the cooking oil directly to retail consumers.
July 1998 The government instructed the KPB to buy 176,850 tonnes of palm olein from private companies at international prices. The palm oil would be sold domestically at a subsidised price. This move was made as an effort to curb smuggling.
July 1998 State plantation companies were ordered to sell their CPO to private refineries and BULOG was directed to buy it and sell it at a subsidised price. PT Dharma Niaga
was then removed from the distribution chain. 7 Sept
1998
The government handed over the task of distributing cooking oil produced by state-owned refineries to the Indonesian Distribution Cooperative (Koperasi Distribusi Indonesia, KDI), with BULOG’s assistance until the end of 1998. June 1999 The government lifted the monopoly granted to KDI to distribute cooking oil from
state-owned companies in the domestic market. Source: Casson (2000, p. 28).
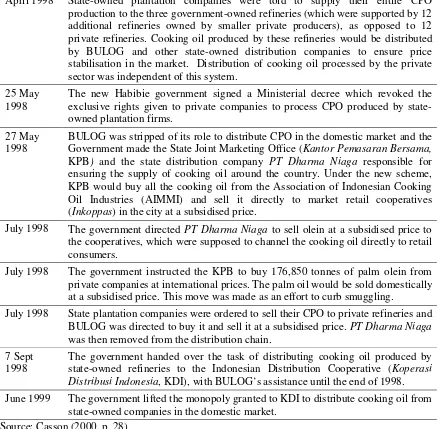
As an alternative, export taxes were used to limit exports, especially those from the
private producers. Table 2.4 shows how the government applied CPO export taxes in
Table 2.4 Indonesian CPO export ban and export tax
Date CPO export tax/ban (per cent) 31 August 1994 10–12
4 July 1997 2–5
17 December 1997 40
24 December 1997 Export ban
7 July 1998 60
29 January 1999 40
3 June 1999 30
2 July 1999 10
12 September 2000 5
February 2001 3
Source: Department of Treasury (2000) in Arisman (2002, pp. 80-81); van Gelder (2004, p. 2).
Higher export taxes are expected to limit CPO exports, thus leaving adequate supply for
the domestic market. By increasing CPO supply to the domestic cooking oil refineries,
policy makers expected a decrease in CPO prices, and in cooking oil prices. In fact,
increasing export taxes could only be justified for developing downstream industries that
used CPO as their main input, but not for decreasing the final output price (Arifin 2007).
Table 2.4 indicates that this policy appeared to be reactive rather than long run strategic
actions; the government admitted that the CPO export taxes policy was a short run policy,
and was only temporarily imposed to stabilise the domestic price. Although export taxes
did temporarily decrease the cooking oil wholesale prices, it was unlikely to stabilise the
domestic cooking oil prices. The domestic cooking oil price still significantly increased,
especially during New Year and Muslim festive seasons, indicating the failure of the
market distribution to meet the market clearing level, or the gain from the low price CPO
is not fully transmitted to the end consumers. The tax did discourage foreign investors
and affected the competitiveness of the Indonesian palm oil industry. The export taxes
that decreased the CPO supply to the international market appeared to lead to even higher
increase in the CPO international price. Moreover, it harmed the oil palm estates—
especially that of the smallholders that did not possess any CPO mills—as the price of
Casson 2000, p.10; Hasan et al. 2001). As a result, CPO domestic supply was still low and its price was high.
Both the DMO and export tax policies can be seen as government interventions that
would indirectly influence the CPO and cooking oil domestic prices, as the price
determination was still left to the market mechanism. Since they were unlikely to
effectively decrease neither the CPO nor the cooking oil prices, the government imposed
CPO and cooking oil price subsidies as an alternative policy. Subsidies were given when
the domestic market price significantly increased as the demand increased during festive
seasons. However, similar to the other policies, subsidies were not aimed at improving
the market structure, but more as a response to the public demand for affordable cooking
oil.
In this case, the amount of subsidy was understood as the difference between market
prices with and without the government intervention, which could either be determined in
absolute value or in percentage. For example, once market prices increased up to
Rp8,500-Rp11,000 (about AUS$1.2 to 1.5) per litre, the government gave subsidies
Rp2,500 per litre (Tempo 2007). At another time, the government reduced to 5 per cent
(from 10 per cent) the cooking oil selling tax or the private companies cut their selling
price by 30 per cent (Depkomfindo 2007). Although subsidies from the government
appeared lower than those from the private companies, they were often available for a
longer period. The government subsidies could be in effect for up to 4 months,
depending on the market price and the government financial conditions (Bisnis Indonesia
2007). While CPO domestic prices are often compared to the international prices—as
most of them are sold in the world market—cooking oil domestic prices are rarely related
to the international ones because they are mainly produced for domestic consumption.
CPO subsidy was distributed to the cooking oil refineries, while the cooking oil subsidy
was either indirectly distributed to the end consumer through the retail distributor, or
directly distributed to a target group—people that were considered poor—through market
operations arranged by the public estates or private companies (Republika 2007). The
source of the government’s subsidy expenditure was CPO export tax earnings or
Rakyat 2007). Therefore, while subsidies might increase the consumer welfare, they
could also decrease the aggregate welfare. Most, if not all of the subsidy policies, which
decrease market price, intend to help end consumers to meet their daily needs rather than
to reach the competitive market condition.
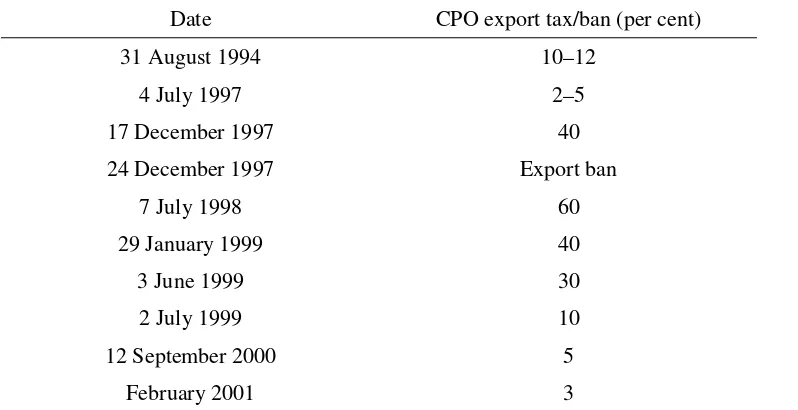
The purpose of the plantation limitation policy was to reduce market concentration, and
to prevent the dominance of a few groups of companies in the private sector. The size
limitation varied across provinces, ranging from 20,000 ha to 100,000 ha. However, these
groups still continued to acquire more land by establishing new companies (Casson 2000,
pp. 12-13; van Gelder 2004, p. 28). From 1990 to 1996, the number of oil palm estates
significantly increased from 226 to 555 units (see Figure 2.8). However, this did not
reflect a more competitive industry because hundreds of new oil palm plantation
companies were still controlled by only 18 Indonesian and 16 foreign business groups
[image:40.612.92.384.394.582.2](van Gelder 2004, pp. 18,19,32).
Figure 2.8 Growth in the number of plantations, 1990–2000
0 100 200 300 400 500 600 700 800
1990 1991 1992 1993 1994 1995 1996 1997 1998 1999 2000
U
n
it
Source: Indonesian Bureau of Statistics (various issues-d). Note: Data for 1993 not available.
In summary, the Indonesian CPO industry is characterised by several main features:
(a) CPO has a single standard quality and market price, and thus can be seen as a
(b) As a perennial crop, CPO has a long maturation period and economic life. Given
this pattern, capital used in CPO production can be considered as a quasi-fixed
input. ‘The average cost of changing the level of quasi-fixed input increases with
the size of the changing period’ (Perloff et al. 2005 chapter 7, p.3). This indicates the existence of an intertemporal link and substantial adjustment costs in the CPO
process;
(c) Indonesia’s CPO producers can be divided into three groups, namely the
government, private companies and smallholders. However, due to the absence of
economies of size, skills and facilities, smallholders are unlikely to have an ability
to influence market price. Hence, only the public estates and the private
companies are considered as the dominant groups in this industry; and
(d) As an important sector, the CPO industry has been the subject of considerable
government interference. The main purpose of these policies was to ensure that
CPO and cooking oil domestic prices remained low. In addition, they also aimed
to reduce the market concentration and the dominancy of a few companies in the
private sector. However, these policies were not always effective.
2.3 Possible sources of market power
2.3.1 The requirement of high investment and market share
Oil palm plantations require a significant initial investment; Potter and Lee (1998)
estimate that US$ 2,500–3,500 per ha is needed to establish a new plantation and another
US$ 5 million to build a CPO mill (cited in van Gelder 2004, p. 22). Due to the lack of
funds partly caused by economic crisis, plantation expansions were not always followed
by the establishment of new mills, thus the growth in mills was not enough to meet the
sharp increase in FFB production. Consequently, at least one million tonnes of FFB were
wasted i