Vol 6, No 2, April - June 1997 Reproductive Paîtern in Down Syndrome
103
Parental Age and Reproductive
Pattern in Children
with
Down Syndrome
Lily
D. Sidiarto
Abstrak
Diteliti
beberapa pola reproduloif pada orang tua dart 194 anak dengan sindroma Down (sD) pada 2 sel<olah pendidikan Luar r ibu saat melahirkan anak dengan usiapada ke dua kelompoksekolah kelompok LA. Usia ayah saat anakitkan dengan umur
p
(2r,6vo)darikelompoklAmengalamiabortusse
lcasus (q'4vo)'Tigap
ibu
35_3gtahun.
'utnruourtusse
rcrbanyakterdapatAbstract
A study on some reproductive pattern in parents of 194 children with Down Sytdrome (DS) enrolled at 2 special schools (SA and I'A) in 1970- 1996 was conducted. This study revealed: most of the mothers giving birth to DS chidren were in the age range
of
30-39years(29'9Vo).Therewasashifttotheloweragerangefrom35-'gyearslSZ.lC")intheSAgroupto
j0-34years(30.9Vo)intheLAgroup' Most of thefathers when the DS childwas bomwere in the age range
of 35-39
years (si.sEo). Most of thefirst born DS children in relation to maternal age was in the age range of 25- 29 years(2s.iU.
;his
study wefound only5
cases (0.4vo) with consanguineous marriage'of
the 139 mothers in the I'A group, 30 mothers (21.6Vo) reported having rniscarriagei preceded and/or after the biith of the DS child.Reywords: maternal age, paternal age, birth order, consanguineous marringe, miscarriages.
The incidence
of
Down Syndrome
at birth
varies
in
different countries.
In
1969
Lilienfeld
(cited from
Smith
andBerg)l
analysed 34 studies on theincidence
of Down
Syndrome
andfound that the reported
ratesranged
from
0.32
to
3.4
per
1000 births
(l:3000
ro1:300).
Hospital
data from several countries
showed anincidence which ranged ftom
l:45j
to l:1262.1The
incidence
of
Down
Syndrome
in
the
Indonesian
po_pulation
is not yet known, but in
theperinatal
study(1975-1979)
of
the Deparrmenr
of
Child Health, Di.
Cipto Mangunkusumo Hospital, Kadri et al
in l9g2
reported
anincidence
rateof
1.08in
1000live births.2
Data from
thePerinatology
Unit of
theDepartment
of
Child Health,
Dr.
Cipto
Mangunkusumo Hospital
during
thefour-year
period l9g2-lgg5
showed that theincidence
of DS was
1.22in
1000live births.
The incidence varies
greatly with
the maternal
age atbirth
of a
child with
Down
Syndrome.
The relative
Departrnent of
Neurology,
,
IJniversityof
Indonesia/Dr. CiptoMang
Jal<arta, Indonesiaincidence
datashow consistency
of pattern, although
there are
variation
in the steepness of the riseofrelative
incidence
in relation to the increase
of
age.Different
case selection
criteria
usedin hospital
orpublic health
surveys
in
othercountries
makeit difficult
to
comparethe
datafrom
thesesurveys. The incidence
of
Down
Syndrome increases
also
with
birth
order which
is
correlated
with
themother's age.l
The
f chromosomal aberations
is not
clear,but
some possible
causes
that might
beresp
the birth
of
aDown syndrome infant.
factor to be
of
etiological
sig-y
2l
is
the
role
of
maternal
tudies
mentioned
also theeffect
of paternal
ageon
theincidence
of Down
Syndrome.
Other factors
which
are
suspected
as the
cause
of
chromosomal
anomalies areenvironmental influences
such as
radiation, consanguinity, sex-hormones
(con_traceptive
use),viral
infectio,n-s (especialIy hepatitis),
and
thyroid autoantibodies.r,4')
1O4
Sidiartotal
age atbirth
of a
child with Down
Syndrome (DS),
and the incidence
of
DS
in
relation
to birth
order,consanguineous
marriage, or
miscarriages
comparedwith
other
studies. These datawill
bebeneficial for
the purposeof
genetic counselling.
METHODS
Subjects
for
this
study
were
children
with
Down
Syndrome (DS) collected
from
1970 toJanuary
1996.These subjects were divided
into
two
groups:
onegroup
were
children referred
to "Luhur Asih"
Special
Preschool
for Down
Syndrome Children
(LA)
for
con-sultation
or
intervention (1983-1996),
and
the
other
group were
DS
school-agedchildren of
"SumberAsih"
Special School
for Mentally
RetardedChildren (SA).
In
theLA
group
the diagnosisof Down
Syndrome wasestablished
clinically
and confirmed
by
cytogenetic
examination
which
wasperformed
at theDepartment
of
Biology, University
of
Indonesia
or
at
private
genetic
clinics, while
in
the SA
group
the
diagnosis was establishedclinically.
Clinical
diagnosis was
basedon physical
findings of
themost characteristic
signsof
Down
Syndromepub-lished
by
Oster
in
1953 andHall
in
1964
(cited
from
Smith
and Berg), t such as: brachycephaly/flat
occiput,
high-arched palate
,
small
teeth and
irregular
align-ment,
furrowed
tongue, epicanthic
folds,
oblique
pal-pebral fissures, dysplastic ears, short broad
hands,four-finger
palmar crease,
short
and curved
fifth
finger, dysplastic middle phalanx on 5th finger, flat
facial
profile,
muscular
hypoton i a, hyperextensibility
orhypèrflexibility.T'8'e'10
Thechildren
were diagnosed asDS when
at least 6 signs werefound.
In
the
SA
andLA
group
information
on
thematernal
and paternal age at
birth of
the children with Down
Syndrome,
birth
order,
consanguineous marriage,
miscarriages
andother
informations
wereobtained by
a self- admini steredquestionaire.
RESULTS
There were
198
children
with
Down
Syndrome
andfour
cases were excluded because
of
incomplete
documentation.
TheDS children included in this
study consistedof 104
boys
and90
girls. Fifty five
children
(30
boys
and25
girls)
wereenrolled
at "SumberAsih"
(SA)
and
139
children (74 boys
and
65 girls)
werereferral
casesto "Luhur
Asih"
(LA).
From
the LAgroup
117 cases were diagnosedclinical-ly
andconfirmed
by
cytogenetic examination.
In the
Med J Indones
remaining
22cases the diagnosis was establishedclini-cally
because
at
their
home
town
laboratory
for
cytogenetic examination
is not yet
available
or
someparents
refused
to
send
their child
for
cytogenetic
examination
with
the reasonthat
their DS child
is
the lastborn
child.
In
clinical
diagnosis, thephysical
findings
showedthat
individual
dysmorphism varied
among thesechildren,
but
at leastthey
showed 6 or morecharacteristic
signsof
DS.The DS children
from
SA were born
]n
1963to
1986,while
casesfrom
LA
were born
in
1980to
1995.The
child's
age when referredfor
consultation/intervention
varied greatly from below the
ageof
one
year
to
74 years (seeTable
l).
The youngestbaby referred
was 2months old.
The distribution
of
the cytogenetic examination
ac-cording
to the new proposedcytogenetic
classification
of Down Syndromel'
was asfollows:
One
of the
117 cases(0.85%),
aboy
showed normal
46,XY karyotype. Primary
orregular DS
wasfound
in
51boys
and 50girls (totally
101 casesor
86.3%).
The secondary or Robertsoniantranslocation
DS wasfound
in
3
cases (2.6Vo), oneboy
and2 girls;
the
tertiary
or
mosaic
DS
in 12 cases
(10.25Vo),ten boys
and 2girls.
Table
1.
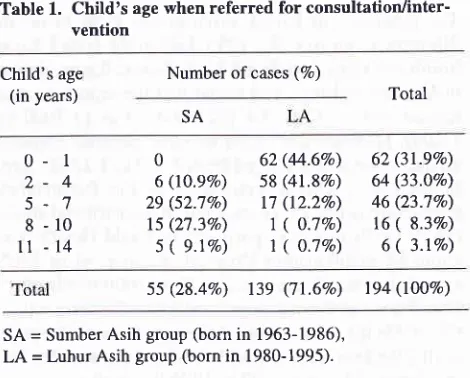
Child's age when referred for consultation/inter-ventionChild's age
(in years)
Number of cases (%)
Total SA
0 2
5 8
t1
-l
-4
1
-10
-14
0
6 (t0.9Vo) 29 (52.7Vo) 15 (27.3Vo)
s ( 9.1%)
62 (44.6Vo)
s8 (41.8%)
17 (12.27o)
1
(
O.1Vo) 1(
O.1Vo)62 (3l.9Vo) 64 (33.OVo)
46 (23.7Vo) 16
(
8.3Vo)6
(
3.lVo)55
(28.4Vo)
139(7l.6%o)
194 (lOO%)SA = Sumber Asih group (born in 1963-1986), LA = Luhur Asih group (born in 1980-1995).
In
theSA group most of
thechildren
werereferred
for
consultation
in
the
ageof
5-7
years (52.7Vo)while in
the
LA
group
it
was
in the
ageof
0-1
year
(44.6Vo),(Table
1).Table
2
provides
information on mother's
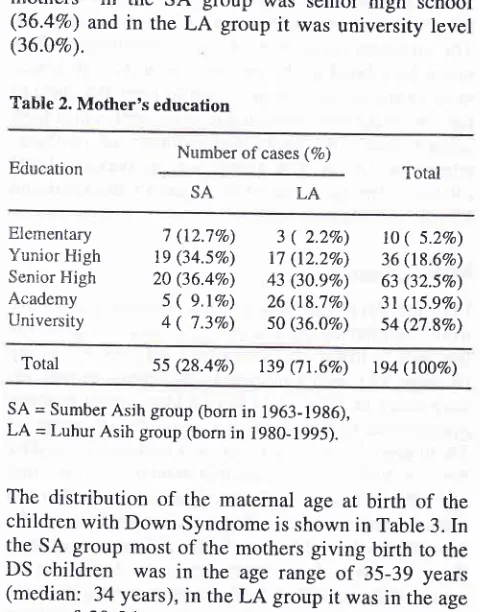
education. [image:2.595.310.545.443.632.2]Vol 6, No 2,
April
- June 1997ûlothers
in
the
SA
group
was(36.48")
and
in
rhe
LA
group
it
(36.}Eo).
Table 2. Mother's education
Reproductive Pattern in Down Syndrome
Table 4. Paternal age distributions
105
senior
high
schoolwas
university
level
Paternal's age
(in years) Number of DS cases (7o) Total
I-A
SA
Number of cases (7o)
_i9
20-24
25-29
30-34
35 -3940-44
45-49
50-54
0 ( o.oEo)
0 ( o.oEo)
6 (l0.9Vo) tt(2O.OEï)
18 (32.8Vo)
13 (23.6Vo) 7 (12.7Vo) O
(
O.ÙVo\A
(
0.0vo)1
(
O.l%o)19 (13.7Eo) 43 (30.9Vo) 47 (33.8Vo) 16 (ll.5Vo) 9
(
6.5Vo)4
(
2.9Eo)A
(
0.0Va) 1( O.SVo)
25 (12.97o) 54 (27.8Vo) 65 (33.5Vo) 29 (t4,9qo)
16
(
8.3Vo)4 ( 2.1Vo)
Education Total
I-A SA
Etrementary Yunior Fligh Senior F{igh Academy University
7 (12.7Eo) 19 (34.5Vo) 20 (36.4Vo) 5
(
9.1E") 4(
7.3Vo)3 ( 2.2Vo)
17 (t2.2Eo) 43 (30.9Vo) 26 (18.7Eo) 50 (36.OVo)
to
( 5.2%)
36 (t8.6qo) 63 (32.5vo)3t (ls.e%)
54 (27.8Eo)Total 55
(28.4Eo)
139(71.6Vo)
194 (10080)Total 55 (28.48o) 1.39 (7l.6Vo) 194 (1O0Eo)
SA = Sumber Asih group (born
in
1963-1986), LA = Luhur Asih group (bornin
1980-1995).Most
of the fathers in both groups werein
the age rangeof 35-39 years
(Table
4).Table 5
shows theincidence
of
DS
in relation
to
birth
order.Most of
the DSchildren
werefirst
born children
(28.9Vo of the
total
cases).In
theSA group
thepercent-age was 20.0Vo and in the
LA
group
it
was 32.4Vo.Table
6
revealed
the incidence
of
DS
in
first
born
children in relation
to
mother's
age.In
the
SA
group
most
of
the
first
born
DS
cases (27.3Vo)were born to
mothers
in the
maternal
age rangeof
20-24 years
and 30-34 years,while
in
theLA
group the peak wasin the
maternal age range of25-29
years (44.4Vo).In
thetotal
DS
casesthe highest
percentagewas
in
the mother's
age range of
25-29
years (39.3Vo).Table 5.
The
incidence ofDown
Syndromein
relation tobirth
orderBirth
order Numberofcases (7o) Number after Penroseofcases (1 933)*
LA Total I 2 3 4 5 6 7 8 9 t0
ll
t2 l3 14 l555 (28.4Eo) 139 (7t.6Eo)
194(to\Eo) 154(toovo)
* cited from Smith and Berg (1976).
SA = Sumber Asih group (bom in 1963-1986),
LA = LuhurAsih group (born in 1980-1995).
SA = Sumber Asih group (born
in
1963-1986),LA
= Luhur Asih group (bornin
1980-1995).The
distribution
of
the maternal
age
at
birth of the
children
with Down
Syndrome is
shownin Table
3. Inthe
SA
group most
of
the mothers
giving birth to
theDS
children
was
in
the
age
range
of
35-39 years
(median:
34years),
in the
LA
group
it was
in the
agerange
of
30-34
years
(median: 32
years) and
in
theoverall
it was in the
age rangeof
30-39
years (median: 33 years).The number
of mothers
giving birth to their
DS
child
before the
ageof 35 years
(54.6Voin the SA
group
and58
r thanafter
the age
of
35
and 4l.gVoin
theLA
gro
numberof
mothers
giving birth
totheir DS
child
before
andafter
the age
of
35 years showed that there was nosignificant
difference
between theSA
andLA
group
(p=0.6362).
Table 3. Maternal age distributions SA
Mother's age
(in years) Number of DS cases (7o)
tt
(20.ovo)
45 (32.4Vo)lO
(l8.2Vo)
43 (30.9Vo) l0(18.270)
24 (l7.3Vo) 6(l0.9Eo)
19 (r3.7Vo)5(
9.tVo) 3(2.2Vo)
3
(
5.5Eo)
2(
t.4Vo)3(
5.5Vo) l(
0.7Vo)|
(
l.8Eo)
1(
0.7Eo)4
(
7.2Eo)
0t( t.8Eo) t(
o.7%)00
|
(l.qEo)
000
00
00
LASA Total
56 (28.9Vo)
53 (27.3Vo)
34 (17.sEo) 25 (l2.9Vo)
8
(
4.tVo) 5(
2.6Eo)4
(
2.tEo) 2(
l.OVo)4
(
2.tEo)2(
l.OVo)0
I (O.sEo)
0 0 0
21 (l3.6Vo)
17 (l1.0Eo)
t6 (10.470) 16 (l0.4Eo) 9
(
5.9Vo) 17 (tt.oEo) t5(
9.770) t2(
7.88o) ro(
6.5vo)I
(
5.2Vo)4
(
2.6Vo)2(
t.3Vo)4
(
2.6Vo)2
(
l.3Eo)I ( 0.7Vo)
-19
20-24
25-29
30-34
35-39
40-44
45-49
2 ( 3.6Eo)
5
(
g.tEo) 9 (16.4Eo) t4 (25.5qo) 18 (32.7Vo) 6 (10.9Vo)t
(
1.8Eo)o ( o.ÙEo) 5
(
3.680) 33 (23.7Vo) 43 (30.9Vo) 40 (28.9%) t6 (lt.5Vo) 2( t.
Eo)2 ( l.O%o)
l0
(
5.2Vo)42 (21.680) 57 (29.480) 58 (29.9Eo) 22 (11.3Vo) 3 ( l.6Eo\ Total
cases
55 (28.4Vo) 139 (71.6Eo)SA = Sumber Asih group (born
in
1963-1986), LA = Luhur Asih group (bornin
1980-1995). [image:3.595.35.275.95.401.2] [image:3.595.296.530.511.723.2]106 Sidiano
Table 6. The incidence of DS in first born children in relation to motherts age
Mother's age
(in years) Number of cases (7o)
Med J Indones
Table
I
most
DS
children
in
the
LA
group
were
referred
for intervention in
the
age rangeof0-1
years.The
youngest
child referred
was
2
months
old. This
might be
related
to the mother's
education
in
which
most
of
the mothers
giving birth to their DS child in
the SA group were
educated atleast
until
senior
high
school,
while
the highest percentage
of
mothers'
education
in
the
LA
group was university
level
(36.0Vo).The latter might be
aware
of
the
need
andbenefit
of
early intervention.
Maternal
ageIn this
study,characteristic of
thematernal
age atbirth
to
DS
children in
theLA
group (median:
32years)
isthe shift
to
lower
age
compared
with
the SA
group
(median:
34 years). Comparedwith
aprevious
prelimi-nary
study
in
1981in
51 DS children,
most
mothersgiving birth,to DS children
was
in
the age
range
of
35-39 years.
"
Also the
report
of
a studyperformed by
Kadri
et alin
1982 revealed thatin relation
tomaternal
age,
18 of21
casesof Down
Syndrome were
born
to
mothers over the ageof 35
y^ears, the mostbeing in
theage
group
of
40-44 years.z
The difference
betweenthose studies and
rhis
study
might be due
to the
in-creaseofthe
use of familyplanning
bymostly
educated mothersrecently,
so that the number of DS babiesborn
tomother
over 40 years in thisstudy
was reduced.A
comparison
of
age
distribution
of
mothers
of
children
with DS in
othsr countrigs is
shownin Figuro
1.In
the
Australian
andBritish
casesthe
minor
peak
was between
25 and
29
years
of
age and
the
pronounced peak between
35 and 44 years
of age. In
the
Swedish
casesthe
pattern
was reversed,
but the
study was conducted
in
1968-1970, compared
to the
Australian
(1942-1957) and
British
(1951-1963)
study; thus this reversal
of
pattern
might be related
to
family
planning.
Sweden 1968-70
Australia 1942-57 England 1951-63 Total
l9
20-24
25-29
30-34
35-39
40-44
45-49
2 (l8.2Vo) 3 (27.3Vo)
2 (l8.2Vo) 3 (27.37o)
|
(
9.0Vo) 0 o0
(
O.OVo) 4(
8.9Vo) 20 (44.4Vo) 16 (35.6Vo)3
(
6.7Eo)|
( 2.2Vo)
I
(
2.2Vo)2(
3.6Vo) 7 (l2.5Vo) 22(39.3Vo) 19 (33.9Vo)4(
7.r%)I (
t.8Vo)t (
l.ïVo)Total
ll
(l9.6Vo) 45 $A.4Vo) 56 (t00%o)SA = Sumber Asih group (born in 1963-1986), LA = Luhur Asih group (bom in 1980-1995).
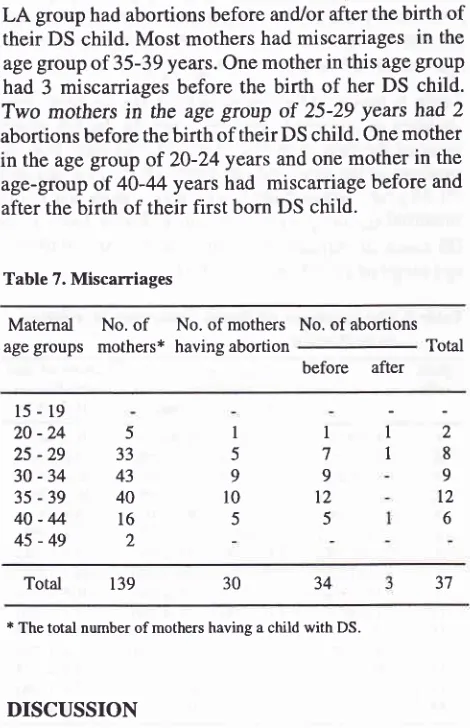
Table
7 shows
that 30
of
139mothers
(2l.6%o)in
the
LA
group hadabortions before
and/or after thebirth
of
their
DS
child. Most
mothers
had miscarriages in the age groupof
35-39 years. One motherin
this agegroup
had
3
miscarriages
before the birth
of
her DS
child.
Two
mothers
in
theage
grcùp
of
25-29 years had 2
abortions before thebirth of
their DSchild.
Onemother
in
the
agegroup
of
20-24
years and onemother
in the
age-group
of
40-44 yearshad
miscarriage before
and after thebirth of their first
born DS
child.
Table 7. Miscarriages
Maternal
No.of
age
groups
mothers*No. of mothers having abortion
No. of abortions Total
before
after15-19
20
-24
25-29
30-34
35-39
40-44
45-49
Total 139
* The total number of mothers having a child with DS.
DISCUSSION
In
the
LA
group the age
of
the
children
referred
for
consultation
andearly intervention shift
to theyounger
age
group
compared
to the
SA
group.
As
shown
in
I
59
l0
5 533 43
40
l6
2
I
I
I
7 9
t2 5
2 8 9
l2
637 34
30
Figure I. Age distrtbuilon
Syndrome ( Linsjô, I 974 )J
rï-t
I
[image:4.595.53.288.332.696.2] [image:4.595.317.557.541.703.2]Vol 6, No 2, April - June 1997
Factors
which
may be connectedare
intrinsic
andextrinsic factors
is
in the
processof
cell division;
theco
first meiotic division of
theoocvte
of
ds
on
the
hormonal control.l,4'In
older
women
(approachesclimacterium)
increasedrisk
of chromosomal
aberation may be connectedwith
lessefficient hormonal control, while
in
teenagegirls
the increasedrisk
might
be connectedwith hoÀonal
con_were
40
years and over.Paternal
ageUntil
themid-1970s paternal
age had asmall effect
onthe incidence
of Down
syndrome.
But with
the
im_provement
in
techniquesfor
chromosome staining
andbanding
in
recent years, a numberof
studiesmentioned
studies that
found
nosignificant statistical
evidencefor
paternal
ageeffect
independent
of maternal
age, andsuggested
that paternal
age should
not
be treated
asempirical risk
values
for
genetic counselling.4
Birth order
cases, 20.0Vo
in
the SA group and
32.4Voin
the LA
group). There
was a decreasein
therelative incidence
age-range recornmended
by
theCoordinating Body
of
Farnily
Planning programme.
Reproductive Pattern in Down
Syndrome
lO7Maternal
age,
cannot be the
only
factor
producing
Down
Syndrome,
becausemost
women
in
this
studv
(57.2Eo) are
under the
ageof
35 years.
BendaTfounâ
out that 41 per cent of the mothers
with
a DSchild
wereat an age
that
wasfavourable
for
child_bearing
age.Consanguineous
marriage
Studies have
beencarried
out to obtain
evidence
for
the
participation of
recessive
traits
in the
etiology
of
nondisjunction
andfound
out that there was afour
fold
t
thconsanguineous
I
nly
5 cases (0.4Eo)n
Miscarriages
One
of
themost
striking
featuresin
the caseof Down
Syndrome
is
the frequency
of abortions.
Benda's
in_vestigation
showed
that 80
of
255 mothers
had
reported
miscarriages,
95
abortions
preceded
DS child
and
3l
followed
afterward
30
of
139 mothers reported
having
ab
eding
and 3after
thebirth
of
the
DS child.
report on the
increasedfrequency
of triploidy
amongabortions
in
mothers
who
had'""ur"d
to
take
oral
contraceptives
less than 6months before conceptions.
However, the
data
concerning the role
of oral
con_traceptive
pills
should be treatedwith
caution
and needto
beconfirmed
by
other
studies.Other factor such
as
endocrine
disturbances
in
themother have
not
found sufficient attention.
BendaTfound out
that
in the younger
agegroup
between
2l
and
40,
38.5Voof
mothers
of
a
OS
cÀitO
showedbut
,Ï::
DS108 Sidiarto
Prenatal detection
by
amniocentesis
for
women over
the
age
of
35 years could be
done,
but
in
case
of
abnormal chromosome
findings, termination of
preg-nancy
raisesiegal, moral
andethical problems irr
trn-donesia.
Therefore,
studies onprobable
risk
factors
in
relation with DS
should
be
suggestedfor
preventive
values.
CONCLUSION
1.
Most of
themothers
of
aDS
child
werein
the agerange
of
30-39 years; 35-39
yearsin
theSA group
(born
in
1963-36)
and 30-34 yearsin
theLA
group
(born
in
1980-95)
2.
Most of
the fathers
of
aDS child
were
in
the
agerange
of
35-39
years.3.
Most
of
the first
born'DS children
were
born
tomothers
in
the
agegroup
of
25-29
years.RBFERENCES
l.
Smith GF, BergJM.
Down's Anomaly. 2nd edition.Edin-burgh London: Churchill Livingstone, 1976.
2.
KadriN,
Siregar SP, Surachman, Monintja HE. Umur ibusebagai faktor risiko kelainan bayi Mongoloid di Rumah Sakit
Dr.
Cipto Mangunkusumo Jakarta, 1915-1979.Maj Obstet Ginek Indon 1982;8:147-54.3.
LindsjôA.
Down's Syndromein
Sweden. Acta PaediatrScand 1974:63:571-76.
Med J Indones
4.
ZarcmbaJ. RecentMedicalResearch. In: Lane D,Stratford-ts,
editors. Current Approaches to Down's Syndronre.Lon-don: Cassell,'i.985:27-51.
5.
Epstein CJ. Down Syndrome. In: Scriver CR, Beaudet AL,Sly WS,
Valle
D,
editors. Metabolic tsasisof
trnheritedDisease. 6th edition. New York: MacGraw-Hill,
1989:.29I-324.
6.
Selikowitz M. Down Syndrome. The Facts. Oxford: Oxford University Press, 1990.7.
Benda CC. Down's Syndrome: Mongolism and ItsManage-ment. Revised edition. London, New York: Grune
&
Strat-ton, 1969.8.
Smith DW. Recognizable Patterns of Human Malformation, Genetic, Embryonic, and Clinical Aspects. Philadelphia: Saunders,1970.9.
Smith DW, Wilson AA. The Child with Down's Syndrome(Mongolism), Causes, Characteristics and Acceptance.
Philadelphia: Saunders, 1973.
10. Cunningham
C.
Down's Syndrome:An
Introduction forParents. 2nd edition. London:
A
Condor Book, Souvenir Press, 1987.11. Ramelan
W.
Down Syndrome: Reportof
a
Cytogenetic Study anda
New Proposed Practical Ctassification' Med JIndones, 1995,
4
(2):78-83.12. Sidiarto
L.
The Maternal Age atBirth
of
Children withDown's Syndrome.
In:
Kenneth Bayes, ChanWMH'
NgWM, Tang FC, editors. Developing Resources for Mentally
Retarded Persons. Proceedings of the 5th Asian Conference
on Mental Retardation. 1981 September; Hong Kong. Hong Kong: Double Print and Art, 1982:71-3.
13. Uchida AU, Holunga R, Lawler C. Maternal Radiation and