An Application Guide for Biodiversity Monitoring in Forest
Ecosystems of South Sumatra
Authors: Dr. Doris Kelle, Albert-Ludwigs University of Freiburg, Germany
Photo credits: Doris Kelle (front)
Acknowledgements
2
Table of Contents
Acknowledgements ... 1
Executive Summary ... 4
1. Introduction ... 8
1.1. Background and project objectives ... 8
1.2. Report objectives and organization ... 9
2. Why monitor biodiversity in South Sumatra ... 10
3. Where to measure ... 12
3.1. Project area and scale ... 12
3.2. Study sites... 13
3.2.1. Primary dryland forest ... 13
3.2.2. Dry lowland secondary forest... 14
3.2.3. Mangrove (primary & secondary forest) ... 15
3.2.4. Peatland (primary & secondary forest) ... 17
3.2.5. Plantation and conservation zones within industrial plantation concessions (HTI) ... 19
3.2.6. Burnt areas ... 19
4. What to measure ... 22
4.1. Analysis of remote sensing data to identify areas of interest ... 23
4.2. Validation of locations in the field and establishment of a diversity inventory baseline .... 25
4.2.1. Why is a baseline inventory important for biodiversity assessments? ... 25
4.2.2. External support for inventory data collection ... 25
4.3. Consideration of surrogate indicators ... 26
4.4. Biodiversity measures ... 28
4.4.1. Alpha, Beta and Gamma diversity in South Sumatra ... 28
4.4.2. Additional information on biodiversity ... 29
3
References ... 39
Appendix I - Recommendation Summary... 42
Appendix II - Data Sheet: Tree Species Diversity /Daftar Pohon ... 44
Appendix III - Data sheet: Digital Herbarium... 48
List of Figures
Fig 1 - Dry lowland secondary forest ... 15Fig 2 - The mangrove forest at Sembilang National Park ... 16
Fig 3 - Mangrove restoration project at Sembilang National Park ... 16
Fig 4 - Intact peat swamp forest has become rare in South Sumatra ... 17
Fig 5 - Fire clearing and drainage destroy the peat land ecosystems ... 18
Fig 6 - In 2015 fires destroyed approximately 730.000 ha of forest ... 20
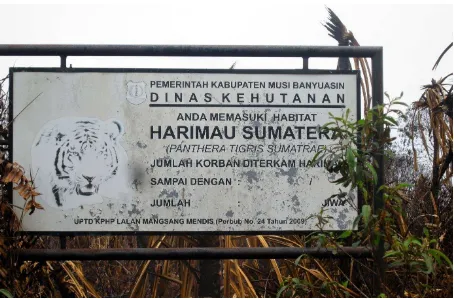
Fig 7 - Signs are often used to demarcate wildlife reserve boundaries and wildlife habitats ... 29
4
Executive Summary
In South Sumatra, habitat loss has endangered biodiversity and with it some of the last remaining endemic species. The mechanisms of REDD+ pose advantages and disadvantages for biodiversity. Assessments have shown that well implemented REDD+ projects could serve as safeguards for ecosystem services, preserve biodiversity and support local livelihoods without shortcutting their core objective, mitigating climate change. The Gesellschaft für international Zusammenarbeit (German International Cooperation, GIZ), the Forest Agency of South Sumatra and the Ministry of Environment and Forestry have launched the project BIOCLIME, Biodiversity and Climate Change, to conduct a province wide carbon and biodiversity assessment. The overall goal is to introduce a methodology that combines carbon assessment and biodiversity monitoring into already existing political programs and management activities such as the National Forest Inventory (NFI). For biodiversity, the aim of the project is to identify high biodiversity value and priority conservation areas in order to enhance effective and efficient conservation management. Frameworks and toolkits providing methods and information for general biodiversity monitoring and monitoring in context with REDD+ have been established (Latham et al. 2014, Pitman 2011, HCV Toolkit 2008). This report aims at providing guidance in applying the existing biodiversity monitoring methods for the study area of South Sumatra. The report supports the process of identifying priority conservation areas for the protection of biodiversity.
Why monitor biodiversity in South Sumatra
Many species in South Sumatra are at the brink of extinction. Because biodiversity is invaluable there is a moral obligation to protect species from extinction. Apart from the moral dimension there is also a very practical reason for protecting biodiversity: to safeguard the stability of ecosystems and as such, the functions and services of ecosystems.
Only if the objectives of monitoring biodiversity are defined can monitoring results be translated into purposeful management practices. South Sumatra is experiencing rapid loss of habitat fueled by wild and semi-wild fires, habitat degradation, the expansion of human settlements and plantation concessions. Despite this, South Sumatra still possesses large areas of contiguous forest and a large variety of ecosystems such as peatland, mangrove and lowland forest – all are habitats for endemic Sumatran flora and fauna. Many silvicultural practices may reduce carbon emissions, but there is often little to no value or benefit for the conservation of biodiversity. By strengthening the focus on biodiversity, the effectiveness of REDD+ activities will be enhanced.
Where to monitor biodiversity in South Sumatra
5 the main study areas. At a local scale there are additional factors such as conservation status and land ownership classes. With the large variety of scales and diverse management objectives in different forest classes (forest land that has been allocated for use as conservation forest, protection forest, limited production forest or production forest) it is essential to provide a comprehensive habitat description to place the project into the proper geographic and biological context, describe the significance of each ecosystem for biodiversity and to identify threats.
What to monitor
A well designed biodiversity assessment consists of three aspects that build on each other. 1) A coarse analysis of remote sensing data, aerial imagery and maps will enable the identification of sampling areas and define the extent of habitat types. It will enable the initial identification of areas of high biodiversity importance. Often spatial information is outdated and consequently the habitat extent is overestimated. Therefore a spatial analysis based on the latest imagery is essential for this procedure. The spatial analysis identifies areas that qualify for further investigation. The analysis will also provide spatial information about the extent and intensity of habitat degradation and destruction.
2) After identifying the sample sites based on the spatial analysis and existing secondary data, a baseline inventory for flora and fauna will provide data about species rarity, richness and spatial distribution. Establishing a baseline is essential because it represents the current status which will serve as a foundation for management decisions, the development of management actions, the evaluation of management effectiveness and future biodiversity monitoring results.
From the baseline inventory data a species list will be produced with information about rare and threatened species and species with specific functions. Based on this information the project managers can identify indicator species or indicator communities and adapt management efforts towards those indicators accordingly. 3) The consideration for surrogate indicator species and the process of choosing good indicators is a result of the baseline inventory. Therefore a careful and thorough analysis of the baseline inventory and a good understanding of the ecological features of each species are critical.
Indicator species for the project BIOCLIME must be chosen in accordance with the project objectives. Suitable indicator species for this project are those targeted by illegal trade and illegal logging, species with large home ranges, prey species for predators and species dependent on old growth forest.
How to monitor
8
1.
Introduction
1.1. Background and project objectives
The biodiversity in the province of South Sumatra is unique having some of the last remaining viable populations of species endemic to Sumatra (Whitten et al. 2000). One reason for the high species diversity is the large variety of ecosystems including mangroves, peatlands, lowland forests and mountain forests. In the last decades the transformation of natural forest into industrial plantations, small-scale forestry, coal mining, road construction and semi-wildfires have increased the pressure on those last remaining ecosystems, and the pressure is ongoing (Gaveau 2012). South Sumatra is one of the Sumatran provinces with the highest human population growth rate (Nijman 2009). Deforestation and forest degradation have been the main reasons for habitat loss. Within 25 years, South Sumatra has lost 70% of its natural forest cover (Gaveau 2012). The extinction of numerous endemic species is imminent. The Sumatran elephant (Elephas maximus sumatranus) and the Sumatran tiger (Panthera tigris sumatrae) are just two examples of the more charismatic, well known species at risk.
With the loss of biodiversity, linked to deforestation and forest degradation, REDD+ activities have been evaluated as beneficial for the preservation of biodiversity. In the past, REDD funds were allocated to regions with high carbon content but they were not necessarily valuable biodiversity hotspots. Thus, poorly designed REDD+ activities did more harm than good to biodiversity. The conversion of natural forests to plantations with low biodiversity value and the increase of biofuel crops put greater pressure on forests with high biodiversity as well as on non-forest ecosystems. Well intended but poorly designed afforestation in areas of high biodiversity led to habitat change and change of species composition (Christophersen & Stahl 2011).
Solutions that protect biodiversity and reduce carbon emissions must be found. The ability of REDD activities to not only reduce carbon emissions but also protect biodiversity has been reported by Venter et al. 2009. By making biodiversity one of the targets of REDD, four times the number of species could be protected. Careful allocation of REDD funds to maximize the benefits for both concerns could result in a doubling of the benefits for biodiversity with only 4-8% reduction in the carbon benefits. Thus, in the wake of a purposeful application of REDD+ activities, areas with high biodiversity must be identified. The province of South Sumatra has been targeted by REDD+ initiatives mainly in the large peatlands. However, the province contains a variety of diverse ecosystems all threatened by encroachment, logging and conversion.
9 of sustainable land use plans with biodiversity monitoring concepts and data to preserve natural resources. The BIOCLIME objectives for the conservation of biodiversity are:
identifying high biodiversity value areas and conservation priority areas, and establishing concepts for conservation and sustainable use,
establishing an inventory database of high biodiversity value areas to provide fundamental knowledge and research results for management decisions, providing transparent and participatory management processes for the
selection of conservation priority areas,
establishing and supporting participatory community processes,
creating a data management, reporting and survey system to secure biodiversity and specific features of the ecosystems in South Sumatra,
defining degradation and degradation parameters.
1.2. Report objectives and organization
The objectives of this report are to provide guidance in the application of biodiversity monitoring in South Sumatra. This report is based on the technical and scientific supervision of monitoring in progress, the attendance of focus group discussions and workshops, and visits to the field. Biodiversity monitoring frameworks and toolboxes provide important information on how to design a biodiversity monitoring concept (Latham et al. 2014, Pitman 2011, HCV 2008). However, the information provided needs to be translated into action and applied in the field where it has to be matched to the individual project objectives. By providing guidance and structure for the decision making processes and the establishment of the study design, the effectiveness of the project will be enhanced.
After each chapter there will be practical recommendations to summarize the most important aspects.
This report aims at:
providing information on important aspects in order to ensure that biodiversity monitoring (habitat-wildlife relationships, flora and fauna monitoring, the role of disturbances) is successful, repeatable and effective,
10
2.
Why monitor biodiversity in South Sumatra
It is important to incorporate the results of biodiversity monitoring into land use planning to protect nature. Efficient land use planning requires knowledge about the past and present condition of land cover types. It also requires knowledge about potential future developments including political processes, ecological processes and interactions (Noss 1999).
The main objectives of the project BIOCLIME are to identify areas with high biodiversity value for REDD+ activities and consequently acknowledge their unique state and consider them in future land use planning.
Assigning a value to biodiversity, especially in highly complex and diverse ecosystems such as tropical rainforests is very difficult (Albers & Ferraro 2006). The value of biodiversity discussion has been ongoing (Cafaro & Primack 2014, Marvier & Kareiva 2014, Noss et al. 2013, Kareiva & Marvier 2012). It is a discussion involving economic, ecological and moral dimensions without easy answers (Ehrenfeld 1988). The complex systems of tropical ecosystems are still largely unknown (Albers & Ferraro 2006). Biodiversity depends on spatial and temporal scales, on processes, composition, structure and function, and it differs between populations, species and genes (Primack 2014, Maczulak 2010). Due to this complexity there is a high risk that the assignment of a biodiversity value to a specific area will lead to wrongly justified management decisions.
An alternative is the identification of priority conservation areas. Margules and Kitching (1995) defined biodiversity priority areas as: a set of areas ithi a pres ri ed geographi al region that together encompass all, or as much as possible, of the biodiversity of that region (Margules & Kitching 1995, p.359). Of course these areas will not be enough to
11 species itself is yet absent, must be included into concepts for prioritizing conservation areas. This requires that in advance, the conservation purpose must be well defined to ensure monitoring objectives are successfully achieved and management decisions are based on a thorough foundation. The identification of priority areas can be approached from two different angles.
1. In the human dominated landscape of South Sumatra, intact, contiguous habitats such as large and healthy forest ecosystems have become rare. Therefore, the remaining ecosystems already are invaluable for biodiversity, and with ongoing and increasing pressure they also qualify as priority conservation areas. Management decisions should focus on protecting what is still left.
12
3.
Where to measure
A thorough description of the study area is essential, especially if the scale of a project includes numerous different habitats, ecosystems, land ownership types and differences in forest condition of forest classes at a provincial scale. They establish the geographical and biological context of the project. A detailed description of the specific features of these ecosystems and habitat types is the first step for outlining the project design. This also facilitates the identification of stakeholders, management units, NGOs and authorities. It represents the foundation of forthcoming discussions and communications with project participants, as well as with national and international institutions.
In addition, the description of the study area enables the project managers to identify and define habitat features closely related to biodiversity for each habitat type: condition of vegetation and vegetation types, biodiversity threats, habitat size and the extent of human impact on the project area (Pitman 2011).
A preliminary description of the major ecosystems, habitat types and specific land features in South Sumatra is given in this section for consideration in the study design.
3.1. Project area and scale
The western mountain range of the Bukit Barisan Mountains along with the Kerinci Seblat National Park and the Bukit Barisan Selatan National Park forms the western border of the province South Sumatra. Both national parks are characterized by their mountainous terrain and difficult access. They hold some of the last pristine forests and important habitats for endemic wildlife. In the north, across the border of Jambi and South Sumatra, is the Harapan rainforest, an ecosystem restoration concession with a total of 98,554 ha of lowland rainforest. Meanwhile, the eastern coast of South Sumatra is characterized by one of the largest, contiguous mangrove ecosystems in Sumatra. It consists of primary and secondary mangrove forest with backwater forest transitioning into peat swamp and peat forest. As many as 400,000 ha of the ecosystem have been identified as important bird area (IBA) by Birdlife International. Covering 205,100 ha the Sembilang National Park is part of the ecosystem. The remaining land cover of South Sumatra is dominated by plantations. They produce palm oil, rubber and fiber for the pulp and paper industry. Plantations are usually surrounded by settlements intensifying the pressure on remaining forest habitats by encroachment, illegal logging and poaching.
The general scale of the project is the whole province of South Sumatra. The different study areas however, can be assorted into various categories:
13 three classes of state forest (conservation, protection and production forest--
subdivided into limited production forest, permanent production forest and convertible production forest),
conservation forests include the management categories national park and wildlife/nature reserve,
three different forest concession license categories (the industrial concession/Hutan Tanaman Industri (HTI), logging concession/Hak Pengusahaan Hutan (HPH) and ecosystem restoration concession),
forest and non-forest area.
Incorporating these classifications is necessary to understand the objectives of each management unit which in return may influence the process of data collection and the success of implementing actions to protect biodiversity. Acknowledging these various definitions and management classes allows for an investigation of biodiversity with a focus on management practices and management. Purposeful recommendations for future management decisions, based on the outcome of the biodiversity assessment, will enhance or maintain the biodiversity within the management objectives. However, the many scales also elevate the risk of confusion and misinterpretations. This represents a challenge for biodiversity monitoring, which is to design a monitoring concept that meets the requirements of all existing scales and categories.
3.2. Study sites
According to a preliminary analysis of land cover maps the following forest land cover types can be found in South Sumatra:
3.2.1. Primary dryland forest
Sumatra´s prevailing forest type is dryland forest. It has been categorized into lowland and mountainous forest. Primary lowland forest has probably gone extinct in South Sumatra. The only pristine forest areas left in South Sumatra are located in the steep and rugged mountains of the Barisan mountain range. Here, difficult access and little that interests economic actors protects the forest from encroachment and conversion.
14 specialization, many species are endemic and the specialized habitat is critical for their survival. Some mammals are endemic to montane forest such as the Sumatran rabbit (Nesolagus netscheri) and the Kerinci rat (Rattus korinchi).
Thus, in the collection of inventory data, elevation is an important variable. For optimal representation of flora and fauna diversity, various elevation zones should be sampled. When forest habitat at lower elevations, with similarities to primary lowland forest is of interest, data sampling should focus on those areas to avoid wasting time and money.
3.2.2. Dry lowland secondary forest
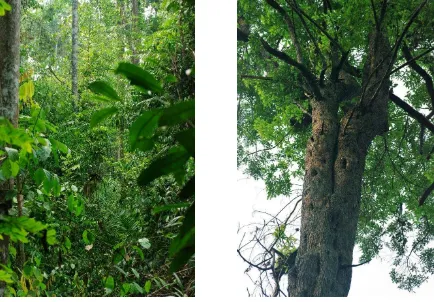
This forest type is found in various locations of South Sumatra. Its extent is patchy, and many remaining forest fragments are isolated and disturbed by logging and encroachment. Remnants of this forest type in South Sumatra are always adjacent to, and often surrounded by plantations. The largest contiguous forests of this type are the forests of Meranti, Danku and Harapan. Harapan rainforest is managed as a restoration concession which allows the delineation of protection and production forest. Harapan rainforest provides habitat for tigers and elephants. It is currently under investigation to determine whether the forest habitat is large enough to support viable populations of both. Whether or not large mammals exist at Meranti or other secondary lowland forests is unknown. The Danku nature reserve, established in the 1980s, has been under pressure from illegal land use since its establishment. Local authorities and indigenous farmers never accepted the boundaries of the reserve. Moreover, local authorities even granted oil palm leases to companies within the reserves boundaries.
15
Fig 1 - Dry lowland secondary forest (left). Old growth habitat trees provide important resources for various tree-dwelling species (right). (Photographs by Doris Kelle.)
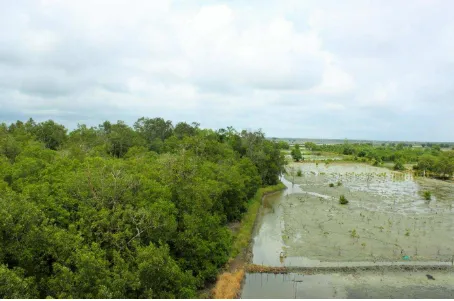
3.2.3. Mangrove (primary & secondary forest)
16 Fig 2 - The mangrove forest at Sembilang National Park provides habitat for many shorebird communities and migratory bird species. (Photograph by Dudy Nugroho, GIZ BIOCLIME.)
17 3.2.4. Peatland (primary & secondary forest)
Undisturbed, pristine peatlands have become rare in Sumatra. In South Sumatra the remaining peatlands are located in the east and landwards adjacent to the coastal mangrove forests. Vast areas of these peatlands burned during the forest fires of 2015.
Peatlands are generally characterized by lower biodiversity although the forested areas offer habitat for many specialized and endemic species. The variety of available habitats from swamps, to heavily inundated areas, to areas with rivulets and dry forests are home to various species of large mammals, orchids, nepenthes and fish. A very unique aquatic species composition has developed in water bodies characterized by low oxygen levels and high amounts of humic acids. Many of the fish are air breathers and other fish usually found elsewhere are absent. For a tropical ecosystem, the low abundance of insects is special. Many larvae are bound to water but the acidity inhibits the breeding process (ASEAN 2011).
Fig 4 - Intact peat swamp forest has become rare in South Sumatra. (Photograph by Hendi Sumantri, GIZ BIOCLIME.)
Forests here feature a lower canopy, trees are smaller in girth and leaves tend to be thicker (Whitten et al. 2000). Some valuable timber tree species such as Ironwood (Bulian,
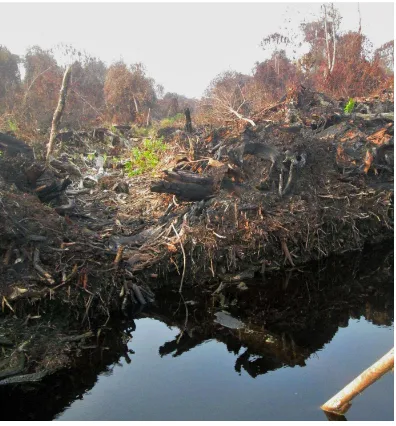
18 storage capacity, peatlands also function as freshwater buffers against saltwater incursion and floods. They secure the steady supply of water for agriculture in other areas. Peatlands have a very complex interconnected system consisting of water, peat and vegetation. If the balance of those components is disturbed, the ecosystem functions are disabled (ASEAN 2011). Companies drain the area to be able to transform it into plantations and for agricultural use. Once drained the ecosystem loses all of its valuable functions. Additionally, it becomes unsuitable for wildlife, susceptible to fires and water pollution increases. Furthermore, the construction of drainage channels enables poachers and illegal loggers to access to the area.
Fig 5 - Fire clearing and drainage destroy the peat land ecosystems. (Photograph by Dudy Nugroho, GIZ BIOCLIME.)
19 In South Sumatra many peatlands are adjacent to mangrove forests and serve as a natural barrier to human access. As described by Whitten et al. (2000), there is a strong relationship between mangrove and peat ecosystems based on the gradual succession of decomposer microorganisms. This is ecologically fundamental for the formation of these ecosystems. This suggests that degradation and destruction of one such ecosystem has negative consequences for other adjacent ecosystems. More research needs to be conducted to fully understand this complex connection.
3.2.5. Plantation and conservation zones within industrial plantation concessions (HTI)
A variation of secondary forest habitat is the so called conservation area within plantations. Plantation forests are mostly monocultures and poor in terms floral diversity. The use of pesticides limits the growth of any other vegetation. However, some plantations support animals such as wild boars, monkeys and birds. More important, and in accordance with the objectives of BIOCLIME, are the patches of original forest that remain inside plantation concessions due to their contribution to diversity.
Every concession owner is obliged to leave 10% of their plantation area in a natural state. The patches chosen are highly important within a plantation landscape because they serve as wildlife corridors, enable dispersal, provide nesting sites, and even provide habitat for metapopulations. Regrettably, the areas are usually too small to provide habitat for viable populations. There are no regulatory instruments to ensure the functionality and protection of these areas. In some areas, responsible concession owners choose the location systematically within the landscape matrix, for example along rivers. They can also create an ecologically meaningful buffer zone adjacent to national parks or wildlife sanctuaries. Most of the time the effectiveness of the intended function as corridor or stepping stone is nil because the areas are too isolated, too small, continuously disturbed and used as hunting grounds. Due to their extremely isolated locations, their diversity might be very different from other secondary forests, and pooling data collected from them would falsify the results. Information about diversity is not available so far, thus, it is necessary to include these patches into the monitoring design as an independent habitat type.
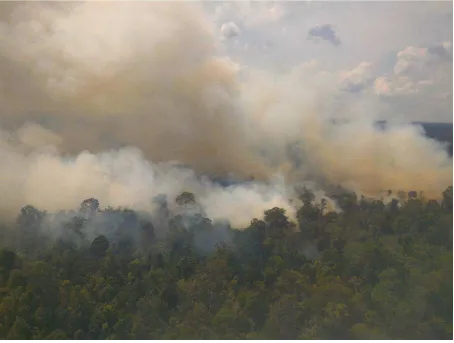
3.2.6. Burnt areas
20 It is recommended to do the flora biodiversity data collection in nearby forest patches that have been unaffected by fires. Because leaves were burnt, it is difficult to identify tree species on the original plots.
Fig 6 - In 2015 fires destroyed approximately 730.000 ha of forest. (Photograph by Adong Tarigan.)
It is advisable to conduct a flora assessment and, with the help of an expert, identify the regeneration potential of the tree species. Aerial drone pictures indicate that there are small, intact forest patches unaffected by the fire. The pictures also indicate that the fires primarily destroyed above ground biomass such as litter and canopy leaves and left behind standing trees. This leads one to make the cautious assumption that the fires crossed the landscape quickly and affected the trees only superficially. Bark and sap might have prevented the complete destruction of the transport tissue potentially leaving the trees able to bud out.
21 Valuable information could be gathered about:
the regeneration process of forest trees and the potential of fire damaged standing trees to bud,
the value of green unburned patches and their role as seed sources, the natural succession after disturbances in different forest habitats,
the role of green unburned patches and fire damaged standing trees as cover for animals,
the recovery and succession of animal populations after fire.
RECOMMENDATIONS:
Establish a common ground of information for all parties involved, Gather ecological and spatial information about the project area,
Put the project in the correct geographic and biological context, establish a biodiversity context,
Provide information about project scale,
Identify areas that serve as discrete sampling units such as landownership classes, major ecoregions and smaller scale vegetation types as well as specific features such as burnt areas and conservation areas within plantations,
Describe current biological conditions,
22
4.
What to measure
Large-scale projects with a limited time to implement recommendations resulting from the information gathered always face the same dilemma: collect as much data as fast as possible at the lowest possible costs. As most of these projects do not aim at collecting continuous long-term data, the collected data should meet the following requirements:
data and information derived should function as a baseline record of the current state of biodiversity in South Sumatra,
data collection should meet scientific standards to withstand discussion and be useful for national or international comparison and publication,
the data collection procedure and data management must be well documented and transparent to allow a follow up assessment in the future,
repetition of the assessment within a given timeframe must be affirmed by the project and its partner institutions. Without regular assessments, changes over time and an evaluation of the effectiveness of management practices will not become known.
The following sub-chapters will provide a hierarchical process of:
1. Identifying areas of interest, 2. Establishing a baseline inventory,
3. Identifying potential surrogate indicators.
This process will determine what to measure to get as much information as possible and to provide project managers with options for refinement. This process is necessary because otherwise management decisions will be based on inaccurate data and faulty conclusions. The main risk associated with receiving erroneous data lies in the fact that practitioners want quick results: thereby causing them to focus on the concept of surrogate indicator species. It is possible to choose indicators and skip establishing a baseline inventory if inventories have already been done, secondary data is available, and if there is reliable knowledge about the species existing. However, if there is no available data, or if available data is outdated or lacks thorough documentation, it is ill advised to choose indicators and use them to draw conclusions about ecosystem health.
23 4.1. Analysis of remote sensing data to identify areas of interest
This procedure not only identifies small- scale priority areas it also helps to identify gaps in data availability. Consequently, it represents the transition from where to measure towards the basis for the decision what to measure . In order to perform an assessment correctly on the areas of interest, the project objectives must be followed. One of BIOCLIMEs main objectives is to identify priority areas for conservation. A preliminary analysis using remote sensing techniques and GIS is a simple, yet effective way to identify contiguous, least disturbed and least degraded areas. The following procedure has been adapted from the top-down priority setting step by step procedure by Margules (1986) and elaborated on by Sutherland (2000).
Although this procedure aims at the broad identification of remaining forests with high protection priority, it does not serve as a substitute for field data collection. Instead, it is intended as a tool to be used to focus on specific areas of interest. Subsequently, it is important to examine the species diversity and the level of intactness later on by field work.
The main requirement for this procedure is the latest areal or remote sensing imagery, as well as detailed land cover classification maps. Outdated imagery or maps will not serve the purpose of this analysis.
STEP 1:FOREST TYPE IDENTIFICATION
Identify forest ecosystems of South Sumatra. Include additional types that might not be targeted by land use planning, such as conservation areas in plantations or habitat types with different levels of disturbance. This step supports the delineation of habitat types and defines the criteria of each type.
STEP 2:AREA QUALIFICATION
24 The result should be a list of potential priority conservation areas based on ecological
riteria. I u derli e pote tial e ause the last step i ludes the a al sis of pra ti al
constraints such as financial issues and concerns with authorities and stakeholders.
The identification of priority areas will save time and permit the focus to be directly on those areas with high biodiversity potential and biodiversity importance. A more detailed investigation of habitat features and biodiversity will be followed up by field work.
The identification of priority areas will save time and permit the focus to be directly on those areas with high biodiversity potential and biodiversity importance. A more detailed investigation of habitat features and biodiversity will be followed up by field work.
STEP 3:SPECIAL FEATURES & FUNCTIONS
Identify and rank those areas with special functions for conservation within the landscape context, such as extent of contiguous forest cover, stepping stones, wildlife corridors, contiguous habitats and habitat mosaics. If available you can also include additional information such as presence of rare species.
STEP 4:PRACTICAL & FINANCIAL DIMENSION
25 4.2. Validation of locations in the field and establishment of a diversity
inventory baseline
After the identification of the focal areas, field work is necessary not only for data collection but also to verify the habitat type and specify the definition and criteria of each forest or habitat type. A thorough description of environmental factors such as topography and soil consistency and a description of forest stand variables such as mosaic patchiness, the uniformity of an old growth forest, the horizontal and vertical dimensions need to be performed.
4.2.1. Why is a baseline inventory important for biodiversity assessments?
A baseline inventory is an inventory of species present at the time of the data collection. It records flora and fauna and habitat elements as well as disturbances that pose a threat to the habitat and the species. The inventory enables comprehensive conservation planning and habitat management. The information obtained from the inventory will serve as a foundation for later management decisions, and will be the standard when analyzing the effectiveness of management processes (Salleh & Manokaran 1995). Resources of special interest such as threatened and endemic species, species with special habitat requirements and plant communities will be identified based on these data. Baseline inventories also establish a pre-disturbance data base. Especially in South Sumatra with annually occurring wildfires and semi-wildfires the knowledge of the pre-disturbance plant and animal species composition is vital for restoration management planning.
The main objectives of the inventory are to collect a representative sample of the species within a specific forest ecosystem or habitat type. A full inventory documenting every species of flora and fauna, even if limited to a certain area, is an unrealistic goal for a project of this scale (Salleh & Manokaran 1995). The design of the inventory will help to locate as many different species as possible. The baseline inventory will reveal species richness and the concepts of diversity interaction within and between ecosystems and habitats (Burley & Gauld 1995).
The baseline inventory based exclusively on field work will not be sufficient. A thorough analysis, literature review and in some cases a e pert’s evaluation is needed after the field work is completed.
4.2.2. External support for inventory data collection
26 methods are being applied in the field. The expert in a particular area of proficiency should be invited to pre-field focus group discussions and to the field to support the data collection. The expert will ensure the correct identification of species and will provide advice for data analysis and data interpretation. For fauna, many NGOs have expertise on specific species becomes overwhelming. Sometimes information about species-habitat relationships and ecosystem health will be lost or overlooked due to sheer species richness. Therefore, surrogate focal species such as indicator species, flagship species and umbrella species can help to make data collection more efficient. The three types of focal species overlap in many cases. Tigers and elephants, for example, are indicator species for anthropogenic pressure and loss of habitat. They are flagship species because they belong to the so called charismatic megafauna and they are umbrella species because protecting their large habitats will extend the benefit of protection to other species living inside this habitat (Primack 2014). Therefore, the following section will focus on the identification of indicator species because they are the most challenging type.
In order to choose indicators, the findings of the inventory must be carefully evaluated, most appropriately with the help of experts in various fields. Abundance and frequency data will allow the identification of species that are common, rare or specially affiliated with a specific habitat. In addition to results from the data analysis, experts can help to identify indicators with clear links to ecological changes, disturbances, ecosystem health, intact ecosystem processes and habitat requirements. The list of indicator-habitat relationships is endless. The challenge for choosing an indicator is to be fully aware of what the indicator is indicating. It is therefore necessary to base the choice for indicators on the project objectives (Pitman 2011). In case of the BIOCLIME project the objectives are to determine areas with high biodiversity value and priority conservation areas. The indicators to focus on, may in this case be (e.g.) species targeted by illegal activities and prone to anthropogenic disturbances, interior forest species, species requiring large habitat size and species with a slow lifecycle and slow regeneration ability. Indicators are habitat specific and must be chosen for each habitat type or ecosystem.
27 Primack (2014) and complemented by others, will present some aspects of ecological indicators that must be considered.
Indicators for inter-species dependencies and ecosystem stability
- Species specific habitat requirements: e.g. bird nesting behavior such as ground-nesting, burrow-ground-nesting, cavity-nesting will indicate the requirement of different habitat features,
- Seed dispersal (zoochory) and pollinators: bees, bats, bumblebees, moths, frugivorous primates, rodents and hummingbirds etc. are important pollinators. Their absence can be interpreted as an early warning system for impending ecosystem instability,
- Inter-species relationships such as predator/prey relationships, trophic levels, e.g. presence and abundance of small mammals as prey for tigers.
Disturbances, threats and vulnerability to extinction:
- Species with a narrow geographical rage, endemism, - Species with only one or a few populations,
- Species in which population size is small, - Species in which population size is declining, - Species that are harvested or hunted by people,
- Species that need a large home range: some animals might not be able to thrive in specific areas anymore because the habitat is not big enough to provide sufficient food or breeding opportunities; in that case it does not make sense to plan a species specific survey,
- Species that are not effective dispersers,
- Seasonal migrants: for seasonal migrants it is also essential to deliberately choose the time of the survey. Migrating species are also some fish species.
- Introduced species and non-native species known for their ability to suppress native species,
- Species with specialized niche requirements,
- Interior forest species or species intolerant or tolerant to forest edges and edge effects.
28 reproduction might be a better indicator community. Information from the inventory baseline will help to identify potential indicator communities.
Indicators can also come from other sources such as indicators for human disturbance based on evidence such as cut tree stumps or poachers’ traps; indicators for old growth dynamics and intact vertical forest structure (beneficial for arboreal locomotion): vines, epiphytes and lianas. This needs to be considered when designing the study and before any field work is done in order to not miss important ecological information later on.
4.4. Biodiversity measures
4.4.1. Alpha, Beta and Gamma diversity in South Sumatra
As the project covers a large area with various patches of the same habitat type in different areas of the province, the three diversity measures provide important information about the state of diversity in South Sumatra. Alpha diversity is the diversity within one sample unit (McCune et al. 2002). Reliable statements about variation in alpha diversity between samples can only be made if the sample size is equal due to the species-area-relationship. When comparing these diversity measures with each other attention must be paid as their results depend on scale and habitat types. The results must be carefully interpreted.
A well-functioning ecosystem that probably represents a high natural biodiversity is characterized by its mosaic patchiness, natural fragmentation or habitat heterogeneity (Morrison et al. 2006). Alpha diversity and beta-diversity, the difference in diversity between patches (species turnover) provide valuable information about the diversity of micro-mosaics within a habitat (Kent & Coker 1992). Habitat micro-mosaics and habitat heterogeneity result from variations in environmental conditions within one habitat. These variations of environmental conditions can be caused by changes in light, soil type, forest structure, stage of vegetation succession, topographic gradients, edges of water bodies and more. Habitat mosaics can be very important habitats for fauna (Koop et al. 1995). For example a mixture of dense forest vegetation and open gaps will enable small and shy mammals to seek food while being able to quickly retreat to cover when sensing danger.
In addition, species turnover provides informative results when comparing
interior forest areas vs. forest edges,
undisturbed forest edges vs. disturbed forest edges,
the comparison of conservation areas in different plantation concessions.
29 Interpretation of diversity with those diversity measures has the advantage that they provide clear information about spatial relationships and ecological gradients (Bennie et al. 2010) and the results support habitat heterogeneity as confirmation for conservation priority. With most biodiversity indices or importance measures using pooled data, the interpretation in connection with ecological aspects remains unsatisfying (Colwell 2009, McCune et al. 2002, Pielou 1995). For data interpretation and transparency it is therefore recommended to use biodiversity measures with clear spatial or ecological references such as frequency and abundance, richness, evenness, dominance or alpha-beta-gamma-diversity.
4.4.2. Additional information on biodiversity
There are several additional sources for information about biodiversity that do not directly relate to data analysis and statistics. This information is rather qualitative and informal.
1) In many areas, signs indicating the presence of wildlife can be found. This information has to be used very carefully as the information on the signs can be dubious. Often, the signs are outdated, and reliable, current survey data is insufficient or non-existent. The signs will not provide any information of the actual presence or numbers of a certain species.
30 2) Local guides are usually a good source of additional information. They can provide information about game animals (which will give some general idea about potential prey-predator presence), the occurrence of valuable timber species and non-timber forest products such as bee hives, medical plants, orchids, Rotan and so forth. Local guides will provide local names for species if those vernacular names are of interest.
3) Lianas and epiphytes can provide information about the health of the ecosystem. Some epiphytes are associated with specific plants or a specific age class of hosts (Ellis et al. 2015, Hietz 1998). Some epiphytes provide very distinctive habitats for certain amphibians, and lianas serve as connections among vertical forest structures which is important for many arboreal animals (Wells 2007, Putz et al. 2001).
RECOMMENDATIONS: species for subsequent and future management and monitoring effectiveness. Indicators vary according to ecosystem and habitat type.
Use expert advice for the baseline inventory and when choosing indicator species.
If there is o expertise for a pote tial i di ator spe ies availa le, do ’t hoose it.
Use indicator communities instead of single species.
Use biodiversity measures with clear spatial references and ecological context to ensure correct and easy data interpretation instead of pooled biodiversity indices. Decide on biodiversity measures at this stage for efficient and correct data
collection. Always keep in mind the project objectives.
Assemble a reliable and motivated field team for sustainable knowledge exchange and future use.
32
5.
How to measure
How to measure biodiversity depends on:
the project objectives,
the information derived from the baseline, the surrogate indicators that are chosen, what additional purpose the data should serve, financial resources and logistics,
and the scale of the project.
Methods for measuring biodiversity have been described in detail elsewhere (Maczulak 2010, Sutherland 2008, Morrison et al. 2006, McCune et al. 2002, Kent & Coker 1992). In this chapter we want to point out issues of special interest for the project of BIOCLIME.
5.1. Flora
5.1.1. Primary data
The most important factor when collecting primary vegetation data within this project is to make sure all plots are located within the assigned habitat type. Often even the best and latest areal imagery will provide insufficient accuracy to reliably set the plots where they are meant to be. The main source of error is that whoever is in charge of the aerial localization might not go with the team into the field. Consequently, the field team will follow the coordinates and once they arrive they will collect the data relying on the fact that a preselection was conducted. The project managers and experts who planned the design and chose the location from maps and imagery must accompany and lead the field team repeatedly until the field team has developed a routine and understands the full scope of the project. Joining in the field work also enables managers to work on improving the logistics, the design and the process or the team member assembly.
A systematic sampling design is recommended as long as the plots meet the habitat criteria. Systematic sampling allows for the investigation of diversity in interior forest patches, of edge forests and for the comparison of the resulting data. The sampling design should be carefully prepared in connection with project objectives and habitat conditions. It does not make sense to prepare a 5 km grid of systematic biodiversity sample plots if 90% of the habitat patches are merely 5 km² in area because hardly any plots would lie within the respective habitat type.
33 methods and procedures are different, there should be a consensus about the best practice of coordinating the two assessments. It is more likely that the monitoring is successful when it is practical, feasible and does not mean extra effort for those selected to do the monitoring in the future. As diversity measures are highly dependent on sample size and spatial scale the sample size must be determined carefully. Start with a minimum plot size of at least one hectare. The carbon assessment design requires plots of 0.1 ha, while the flora plots cover the same area with 10 replicates. A species-area-curve or collectors curve can help to refine sample size.
O ea h . ha plot all trees ≥ cm dbh should be measured and identified by species. Additionally, all trees with a dbh of 5-10 cm should be measured and identified on a subplot of 0.01 ha. Supplemental information such as evidence of wildlife (feces, tracks, and direct sightings) should be recorded. If no systematic sampling of epiphytes or vegetation other than tree species is conducted, structural elements such as arboreal epiphytes and lianas should at least be mentioned in an annotation section to make it possible to describe forest structure. (Appendix II).
The use of vernacular names for species identification is not recommended. Vernacular names vary significantly between provinces, regions and even between villages. It is tempting to ask local guides for help in identifying tree species, and then using the vernacular name. However, the scientific identification of a species based exclusively on a local name is unreliable. The scientific identification based on a local name is only an option if herbarium samples are collected followed by a meticulous identification process. Using only vernacular names without specimen proof, especially within a project at a provincial scale will lead to the underestimation of species numbers (Whitten et al. 2000).
In times of high resolution cameras, it is common practice to collect a digital herbarium. It is an advantage to take pictures on location as delicate flowers remain intact and leaves and branches do not have to be carried during the field work. All plant parts and details must be carefully documented to make sure later identification is successful. The data base has to be established accurately, and it must be possible to add information, for example when a field trip takes place in fruiting or flowering season making additional parts of a specimen available to be photographed. (Appendix III).
5.1.2. Secondary data
34 The use of existing herbariums for identifying the collected species is recommended, and a network of botanists working on the vegetation of Sumatra should be established.
5.2. Fauna
5.2.1. Primary data
Collecting data on fauna can be very time consuming. Therefore it is necessary to thoroughly analyze existing data and begin with the investigation of secondary data to define gaps and data collection needs.
For primary data collection it is important to consider the time the data was collected as spatial abundance of species varies over time. The abundance of birds will depend on bird migration and fish abundance varies with dry and wet seasons and fluctuations in water level. If seasonal aspects are not considered, the monitoring results will be misleading.
As important as the seasonal aspects is the location where to sample. Some birds might be edge specialists while others are specialists of forest interiors and not found in fragmented habitats where there is significant edge effect (Morrison et al. 2006). For species specific sampling it might therefore be necessary to include transects along a gradient such as inundation, forest density or disturbance. An unexpectedly high abundance of a species in a rather unsuitable habitat might be due to their being pushed out of suitable habitat as a result of disturbance.
If investigating indicator species the species habitat requirements must be set into a landscape level context. Especially for mammals with large home ranges seemingly unoccupied habitat patches might be important stepping stones to enable dispersal within the habitat matrix und thus these patches represent an important function. Therefore, the habitat requirements of species and the landscape must be considered when collecting faunal data. Consulting with an expert to clarify these aspects is advisable.
5.2.2. Secondary data
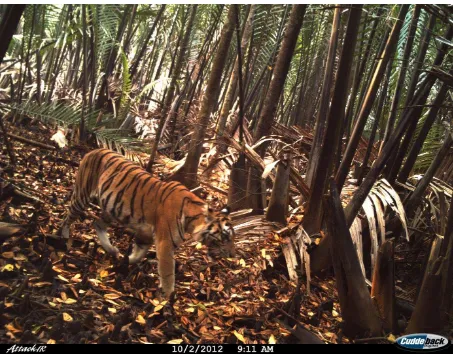
35 Fig 8 - Most conservation projects use camera traps for wildlife surveys providing valuable secondary information. Many species believed extinct have been rediscovered. (Photograph courtesy of Sembilang NP.)
However, people often hesitate to share data. The benefits of sharing needs to be clearly stated and rules of data use set by those who own the data must be followed. Stakeholders, partners and guests must have the opportunity to meet and discuss mutual benefits accrued from data sharing.
There is usually some risk involved when using existing data because of the uncertainty that exists around how thoroughly the data collection was conducted and how reliable the data is. Joint workshops allow methods and problems related to field work to be discussed and information about study areas to be shared.
Sometimes the available data is outdated. A maximum data age must be defined to rule out any risk of basing management decisions on suspect and outdated results. Secondary data should only be used if the collection process has been well documented and methods are well described. Moreover, it must be clear that no statements based on hearsay are being used. The evidence of a species, such as a tiger sighting, must be proven and documented.
A ordi g to IUCN a ta o is presu ed e ti t he e hausti e sur e s i k o a d/or
expected habitat, at appropriate ti es diur al, seaso al, a ual , … ha e failed to re ord
36 definition comprises all spatial scales of extinction including local extinction. The definition is general and needs species specific refinement because some species are easier to detect than others and extinction thresholds vary among species.
5.2.3. SMART conservation software
The SMART (Spatial monitoring and reporting tool) software has been widely used by many international organizations. It is most often used in connection with anti-poaching patrols, therefore, it is also known as anti-poaching software. Patrols use it on their monitoring routines to locate poaching hotspots and to support law enforcement and optimize patrol and management efficiency.
The software can also serve as a tool to identify areas with high levels of biodiversity and where to proactively focus conservation management in order to prevent illegal activities. The choice of species to monitor largely depends on the ecosystem and the management objectives. In the case of BIOCLIME, the species most likely to indicate high biodiversity and healthy ecosystems can be the basis for the consideration of an indicator species. Species to potentially monitor would be those species with large home ranges, species which are hunted, species involved in human-wildlife conflicts, species serving as prey for other species and species with special niche requirements indicating healthy ecosystems.
It is not advisable to rely solely on data collected for those umbrella species with large home ranges. The presence of tigers does not imply a healthy pangolin population just because the two species share the same habitat. The success of SMART as a monitoring tool to gather information about species diversity in a habitat depends on the monitoring effort, the variety of species to be monitored and the continuity of the monitoring. The software is most often used by patrols monitoring tigers, rhinos and elephants – species highly sought after by poachers. In Sumatra primates such as gibbons (Hylobates spp., Symphalangus spp.) are also targeted by poachers and the presence of gibbons is relatively easy to detect. Kijang (Muntiacus muntjak) and Rusa (Cervus unicolor) are important prey for tigers but are also hunted by local communities. Malayan sun bears (Helarctos malayanus) leave recognizable and permanent scratch marks on trees. However, these marks are only useful when they are very recent. In general, fresh animal tracks would be more convincing. Further indicators for potential monitoring patrols could be hornbills. Hornbills have lately become attractive for poaching and they indicate the presence of old growth trees used by hornbills for nesting purposes. Evidence of the presence of these species can be collected on a non-specified monitoring patrol. For some animals the patrol must be specifically designed or temporarily adapted to collect evidence at specific locations such as streams (e.g. otters) and at specific times and seasons.
37
5.3. Data storage
The BIOCLIME project has a limited runtime. The collected data needs to be stored in one place where the data is available to interested parties. This includes the digital data base as well as the physical data, such as the herbarium. Probably the best location is in a university with a focus on botany, ecosystem ecology, wildlife or conservation. Another suitable institution might be a central scientific agency such as L.I.P.I, Ristek, CIFOR or ICRAF. After the collected data is stored, it must be guaranteed that results from future monitoring efforts also can be added, analyzed and stored.
RECOMMENDATIONS:
Investigate the use of secondary data first before conducting primary data collection.
Make use of existing data such as HCV assessments.
Involve parties and share data and results with participants, project supporters and those who shared their own data.
Ensure that vegetation sampling plots are located in a specific habitat type. If the conditions in the field do not match the habitat type due to e.g. outdated maps or imagery, do not collect data at this place.
Make sure the first field collections are supervised by experts and scientific staff until the field team is ready to collect data themselves.
Use the first trips to the field to improve the design and processes.
Invite staff from institutions, authorities and members of local communities. Take time to explain the process and purpose of the survey.
Document all steps of the investigation. Store data and samples in one place where access for future use is ensured.
38
6.
Conclusions
Many protected areas in Indonesia have been assigned a conservation status because they were commercially unattractive or difficult to access. Today, those areas represent the last remaining undisturbed ecosystems, whereas all other areas have either been destroyed, seriously degraded or are about to be transformed into other land uses. By choosing protection areas not for their unique species composition, ecosystem services or biological diversity but rather for financial interests has had a devastating impact on biodiversity. Many endemic animals in Indonesia now face extinction because their habitat was located in areas that did not benefit from such prote tio de isio s. However, in the densely populated landscape of South Sumatra it is impossible to set aside protection areas retroactively to make up for these mistakes. It is now more important than ever to 1) establish management plans for biodiversity priority areas to conserve what is still left and 2) identify sustainable land uses that provide livelihoods for local communities. With this application guide we provide the guidance necessary to establish biodiversity priority areas for species conservation.
39
References
Albers, H.J. & Ferraro, P. (2006). The economics of terrestrial biodiversity conservation in developing nations. In: López, R. & Toman, M.A (eds.). Economic Development and Environmental Sustainability: New Policy Options. Oxford University Press.
ASEAN Peatland Forest Project (2011). Peatlands in Southeast Asia – A profile. ASEAN Secretariat and Global Environment Centre.
Bennie, J., Anderson, K., Wetherelt, A. (2010). Measuring biodiversity across scales in a raised bog using a novel paired-sample diversity index. Journal of Ecology, doi: 10.1111/j.1365-2745.2010.01762.x.
Berry, N.J., Phillips, O.L., Ong, R.C., Hamer, K.C. (2008). Impacts of selective logging on tree diversity across a rainforest landscape: The importance of spatial scale. Landscape Ecology, 23: 915-929. Burley, J. & Gauld, I. (1995). Measuring and monitoring forest biodiversity: a commentary. In: Boyle, T.J.B & Boontawee, B. (eds). Measuring and Monitoring Biodiversity in Tropical and Temperate Forests. Proceedings: IUFRO Symposium, Chiang Mai, Thailand 1994. Center for International Forestry Research, Malaysia.
Cafaro, P. & Primack, R.B. (2014). Species extinction is a great moral wrong. Biological Conservation 170: 1-2.
Cannon, C.H., Peart, D.R., Leighton, M., Kartawinata, K. (1994). The structure of lowland rainforest after selective logging in West Kalimantan, Indonesia. Forest Ecology and Management, 67: 49-68. Christophersen, T. & Stahl, J. (2011). REDD-plus and Biodiversity. Secretariat of the Convention on Biological Diversity, CBD technical series, No. 59.
Colwell, R.K. (2009). Biodiversity: Concepts, Patterns, and Measurement. In: Levin, S.A. (ed). The Princeton Guide to Ecology. Princeton University Press, NJ.
Costello, M.J. & Wieczorek, J. (2014). Best practice for biodiversity data management and publication. Biological Conservation 173: 68-73.
Ehrenfeld, D. (1988). Why put a value on biodiversity? In: Wilson, E.O. & Peter F.M. (eds.). Biodiversity. National Academy Press, Washington, D.C.
Ellis, C.J., Eaton, S., Theodoropoulos, M., Elliott, K. (2015). Epiphyte communities and indicator species. An ecological guide for Scotland´s woodlands. Royal Botanic Garden, Edinburgh.
Gaveau, D. (2012). Protected areas in Sumatra. ARD Learning Exchange 2012: Forests, Trees and Landscape – Synergy, Tradeoffs, Challenges.
Hietz, P. (1998). Diversity and conservation of epiphytes in a changing environment. International Union of Pure and Applied Chemistry (IUPAC). 1998. Volume 70 (11).
40 Johns, A.D. (1992). Vertebrate responses to selective logging: implications for the design of logging systems. Philosophical Transactions of the Royal Society: Biological Sciences, 334 (1275): 437-442. Kareiva, P. & Marvier, M. (2012). What is Conservation Science? BioScience 62 (11): 962-969.
Kent, M. & Coker, P. (1992). Vegetation Description and Analysis: A Practical Approach. Belhaven Press, London.
Koop, H., Rijksen, H., Wind, J. (1995). Tools to diagnose forest integrity: an appraisal method substantiated by SILW-STAR assessment of diversity and forest structure. In: Boyle, T.J.B & Boontawee, B. (eds). Measuring and Monitoring Biodiversity in Tropical and Temperate Forests. Proceedings: IUFRO Symposium, Chiang Mai, Thailand 1994. Center for International Forestry Research, Malaysia.
Latham, J.E., Trivedi, M., Amin, R., D´Arcy, L. (2014). A Sourcebook: Biodiversity Monitoring for REDD+. Zoological Society of London, United Kingdom.
Maczulak, A.E. (2010). Biodiversity: Conserving Endangered Species. Facts on File, Inc., Green Technology, New York.
Margules, C.R. & Kitching, I.J. (1995). Assessing Priority Areas for Biodiversity and Protected Areas Networks. In: Boyle, T.J.B & Boontawee, B. (eds). Measuring and Monitoring Biodiversity in Tropical and Temperate Forests. Proceedings: IUFRO Symposium, Chiang Mai, Thailand 1994. Center for International Forestry Research, Malaysia.
Margules (1986). Conservation evaluation in practice. In: Usher, M.B. (ed.) Wildlife Conservation. London: Chapman&Hall, pp.297-314.
Marvier, M. & Kareiva, P. (2014). Extinction is a moral wrong but conservation is complicated. Biological Conservation 176: 281-282.
Mason, D.J. & Putz, F.E. (2001). Reducing the impacts of tropical forestry on wildlife. In: Fimbel, R.A., Grajal, A., Robinson, J.G. (eds.) The cutting edge: conserving wildlife in logged tropical forests. Columbia University Press, New York.
McCune, B., Grace, J., Urban, D.L. (2002). Analysis of Ecological Communities. Gleneden Beach, MjM Software Design.
Morrison, M.L., Marcot, B.G.,Mannan, R.W. (2006). Wildlife-Habitat Relationships: Concepts and Applications. 3rd edition. Island Press.
Nijman V. (2009). An assessment of trade in gibbons and orang-utans in Sumatra, Indonesia. Technical Report. TRAFFIC Southeast Asia, Petaling Jaya, Selangor, Malaysia.
Noss, R., Nash, R., Paquet, P., Soulé, M. (2013). Humanity´s Domination of Nature is Part of the Problem; A Response to Kareiva and Marvier. BioScience 63(4):241-242.
41 Pielou, E.C. (1995). Biodiversity versus old-style diversity: measuring biodiversity for conservation. In: Boyle, T.J.B & Boontawee, B. (eds). Measuring and Monitoring Biodiversity in Tropical and Temperate Forests. Proceedings: IUFRO Symposium, Chiang Mai, Thailand 1994. Center for International Forestry Research, Malaysia.
Pitman, N. (2011). Social and Biodiversity Impact Assessment Manual for REDD+ Projects: Part 3 – Biodiversity Impact Assessment Toolbox. Forest Trends, Climate, Community & Biodiversity Alliance, Rainforest Alliance and Fauna & Flora International. Washington, DC.
Primack, R.B. (2014). Essentials of Conservation Biology. 6th edition. Sinauer Associates, Inc., Massachusetts, USA.
Putz, F.E., Sirot, L.K., Pinard, M.A. (2001). Tropical Forest Management and Wildlife: Silvicultural Effects on Forest Structure, Fruit Production, and Locomotion of Arboreal Animals. In: Fimbel, R.A., Grajal, A., Robinson, J.G. (eds.) The cutting edge: conserving wildlife in logged tropical forests. Columbia University Press, New York
Salleh, M.N. & Manokaran, N. (1995). Monitoring of forest biodiversity: policy and research issues. In: Boyle, T.J.B & Boontawee, B. (eds). Measuring and Monitoring Biodiversity in Tropical and Temperate Forests. Proceedings: IUFRO Symposium, Chiang Mai, Thailand 1994. Center for International Forestry Research, Malaysia.
Sutherland, W.J. (2008). Ecological Census Techniques: A Handbook. 2nd edition. Cambridge University Press, UK.
Sutherland, W.J. (2000). The Conservation Handbook: Research, Management and Policy. Blackwell Science Ltd, Oxford, UK.
Toolkit for Identification of High Conservation Values in Indonesia. (2008). Consortium to Revise the HCV Toolkit for Indonesia, Jakarta.
Venter, O., Laurance, W.F., Iwamura, T., Wilson, K.A,, Fuller, R.A., Possingham, H.P. (2009). Harnessing carbon payments to protect biodiversity. Science 326:1368.