Cloud modulation of surface solar irradiance at a pasture site in
southern Brazil
Lianhong Gu
a,∗, Jose D. Fuentes
a, Michael Garstang
a, Julio Tota da Silva
b,
Ryan Heitz
a, Jeff Sigler
a, Herman H. Shugart
aaDepartment of Environmental Sciences, University of Virginia, Charlottesville, Virginia 22903, USA
bCentro de Previsao de Tempo e Estudos Climaticos (CPTEC), Instituto Nacional de Pesquisas Espaciais (INPE), Rodovia Presidente Dutra
Km 40, Cachoeira Paulista, Sao Paulo, Brazil
Received 7 February 2000; received in revised form 1 August 2000; accepted 10 August 2000
Abstract
Broken cloud fields create mosaic radiative landscapes with interchanging cloud-shaded and sunlit areas. While clouds attenuate solar radiation incident on cloud-shaded areas, sunlit ground surfaces may actually receive more irradiance than under a clear sky due to light scattering and reflection from neighboring clouds. In this paper, we studied these two opposite but closely related aspects of cloud modulation of surface solar irradiance at a pasture site in southern Brazil. We analyzed a high-resolution time series of surface measurements obtained during the 1999 wet season. Surface solar irradiance frequently (more than 20% of the time) exceeded clear-sky levels and occasionally surpassed the extraterrestrial radiation. Clouds created a bimodal frequency distribution of surface solar irradiance, producing an average of approximately 50 and 14% for attenuation and enhancement, respectively, as compared to corresponding clear-sky level irradiance. The average duration of enhancement periods was about 1/3 of the average duration of attenuation periods. On the daily basis, cloud-induced enhancement contributed an average of 4% of the daily solar input to the surface and compensated for more than 10% of the attenuation due to the presence of clouds. Through spectral analysis, two temporal regimes were shown to modulate the surface irradiance by clouds. One was a convective/mesoscale of tens of minutes to hours and the other was a turbulent scale of
several minutes corresponding to the classical Kolmogorov f−5/3power law. © 2001 Elsevier Science B.V. All rights reserved.
Keywords: Solar irradiance; Cloud gap effect; Tropical clouds; Convective regime; Turbulence diffusion regime; Kolmogorov power law
1. Introduction
Large spatial heterogeneity in solar radiative forcing can be created when clouds do not continuously cover the underlying surface. Interchanging cloud-shaded
∗Corresponding author. Present address: Department of
Envi-ronmental Science, Policy and Management, Ecosystems Science Division, University of California, Berkeley, 151 Hilgard Hall, Berkeley, CA 94720-3110, USA.
E-mail address: [email protected] (L. Gu).
and sunlit areas form a mosaic landscape of surface solar irradiance. What makes this picture interesting is that sunlit ground surfaces may actually receive more irradiance than under a clear sky. This is possible be-cause sunlit ground surfaces, which are located at the end of the paths of solar beams passing through gaps formed by individual clouds in neighboring skies, receive the same amount of direct radiation as under the clear sky, while the diffuse radiation component is increased due to light scattering and reflection from neighboring clouds (Segal and Davis, 1992; Duchon
and O’Malley, 1999; Gu et al., 1999). This phe-nomenon has been termed ‘cumulus solar-irradiance reflection’ (Segal and Davis, 1992) and the ‘cloud gap effect’ (Gu et al., 1999). In this paper, we adopt the term ‘cloud gap effect’ to denote the cloud-induced enhancement of surface irradiance. We argue that cumulus clouds are not the only cloud type that can enhance surface solar irradiance. With proper solar elevation angles, any gaps in cloud cover can create areas on the ground surface where solar irradiance exceeds the clear-sky level because of the increased contribution from the diffuse radiation. However, we concur with earlier studies (Segal and Davis, 1992) that clouds with large vertical development such as cumulus and cumulonimbus are the most favorable ones due to their discontinuity in covering the under-lying surface and well-shaped walls for effective light reflection.
Direct analyses of a mosaic radiative landscape are difficult because the radiation field at this scale can-not be readily obtained. Alternatively the phenomenon can be studied in the time domain. For a fixed point on the ground, the surface may experience alternatively sunlit and shaded conditions due to the movement of the cloud field and changes in solar elevation angles. This leads to a time series of the received solar irra-diance that is characterized by alternative periods of reduced solar radiation and unusually high solar radi-ation. Such a feature is commonly observed in high time resolution pyranometer records (Segal and Davis, 1992).
Segal and Davis (1992) evaluated the magnitude of the cloud gap effect using measurements obtained along the Front Range of Colorado, USA. They re-ported that the cloud gap effect was able to cause increases of up to ∼250 Wm−2 in surface solar ir-radiance with periods lasting 15–30 min. Gu et al. (1999) analyzed data given in Duchon and O’Malley (1999) for Lamont, Oklahoma, USA and found that around noontime the cloud gap effect can increase ground surface irradiance by more than 20% over the clear-sky level. To our knowledge, no stud-ies have been conducted to evaluate the magnitude and dynamic characteristics of the cloud gap ef-fect in the tropics of prevailing cumuliform clouds where some of the most magnificent clouds in the world are often observed (Garstang and Fitzjarrald, 1999).
In this study, we report the results of a detailed study of a high-resolution time series of surface so-lar irradiance obtained from a pasture area in Brazil during the 1999 wet season. The main objectives of this study are: (1) to investigate the statistical char-acteristics (magnitude, duration and frequency) of the cloud gap effect as well as cloud irradiance at-tenuation and associated cloud types, (2) to ascertain the influence of the dual functions of clouds (radia-tion attenua(radia-tion and enhancement) on solar radiative forcing on a daily basis, and (3) to determine scal-ing properties of the temporal dynamics of surface solar irradiance modulated by clouds. The findings reported here have direct application to processes requiring solar energy. Examples include stomatal dynamics and associated plant carbon dioxide uptake and transpiration, emissions of phytogenic hydro-carbons, and photolysis of a plethora of airborne molecules.
2. Site description and measurements
3. Clear-sky irradiance model
A major step in our analyses was to determine the clear-sky solar irradiance on the ground surface so that a reference could be established for cloudy sky con-ditions. During the 2-month measurement period, we never observed a single completely clear day. There-fore, we applied the clear-sky solar irradiance model developed by Meyers and Dale (1983). We determined the model parameters by fitting measurements from those daily segments in which we observed no clouds directly over the site. For completeness, we outline the model here. Complete model details can be found elsewhere (e.g. Meyers and Dale, 1983; Ibqal, 1983; Duchon and O’Malley, 1999).
In the absence of clouds, the clear-sky surface irra-diance Ic is determined by the product of four
trans-mission coefficients characterizing Rayleigh scattering (tR), permanent gas absorption (tg), water vapor
ab-sorption (tw), and aerosol scattering (ta), respectively
Ic=I0tRtgtwta (1)
where I0 is the extraterrestrial solar irradiance at a
plane parallel to the Earth’s surface. I0is given by I0=Isc
where Iscdenotes the solar constant, D the day of the
year, and β is the solar elevation angle. We imple-mented an algorithm described in Michalsky (1988) to calculateβ. The product of tRand tgis predicted from
the surface pressure p (kPa) and the optical airmass number m at 101.3 kPa by (3)
The water vapor transmission coefficient tw is related
to the atmospheric column precipitable water u (cm) and m by (5):
tw=1−0.077(um)0.3, (5a) u=exp(0.1133−ln(λ+1)+0.0393Td) (5b)
where Tdis the dew point temperature (◦F) andλis an
empirical constant based on season and latitude. The aerosol transmission coefficient tais given by
ta=xm (6)
where x is an empirically determined coefficient. For the Northern Hemisphere, values forλand x can be found in the literature (e.g. Smith, 1966; Meyers and Dale, 1983; Duchon and O’Malley, 1999). For the Southern Hemisphere, however, we do not know their values. To determine λ and x for our site, we constructed a minimization function to be applied for those daily periods in which we observed no clouds
f (λ, x)= 1
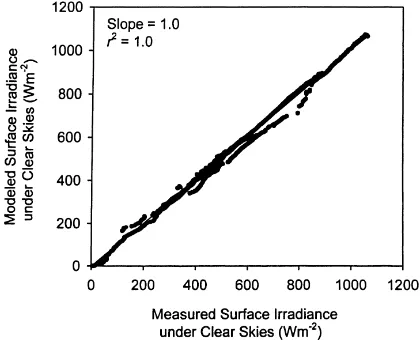
where Iis are solar irradiance measurements from those periods for which no clouds were observed directly over the site, n is the total number of mea-surements, and Icis are corresponding model results whenλ and x are given. We minimized the function f(λ, x) by using the conjugate gradient method (Press et al., 1992). The values we obtained areλ = 2.80, and x = 0.925. As shown in Fig. 1, fitted model results agree closely with measured clear-sky surface irradiance.
Obviously for the treatment employed here one can always ask the following question: how is the enhancement during the ‘between-clouds’ periods
avoided? With cloud fields located in the horizon (but not over the measurement site), there is always a pos-sibility of surface irradiance enhancement at the place, where the sensors are located. To minimize this uncer-tainty, we set the following standards for the periods used in the clear-sky irradiance model: (a) the periods must be longer than 2 h; (b) the surface irradiance must follow the trend of extraterrestrial radiation and change smoothly with time. This procedure does not completely eliminate the possibility of contaminated ‘between-clouds’ periods and it is possible that the modeled clear-sky irradiance may be slightly higher than the actual value. But it ensures that the enhance-ment effects of clouds will not be overestimated. To further assess this issue, we compared predicted clear-sky irradiance with measured values for those clear-sky periods that were longer than 1 h but shorter than 2 h and, therefore, not used in the parameter esti-mation. We found good agreement between predicted and measured results (r2 = 0.99, root mean square error = 29.1 Wm−2). This additional test indicates that the clear-sky irradiance contamination is unlikely a problem for our analyses. It also served as an in-dependent validation for the model and its parameter estimation because it used a different set of measure-ments. It is reassuring that our estimated values for
λ and x are comparable to those reported in the lit-erature for low latitudes in the northern hemisphere (Smith, 1966; Meyers and Dale, 1983).
4. Results
4.1. General features of temporal variations of surface irradiance
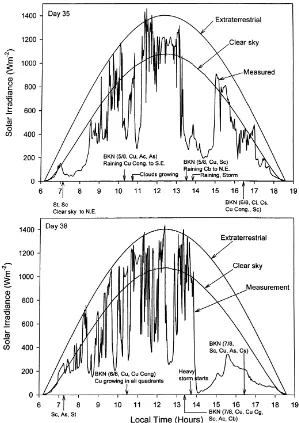
A striking feature in our measurements is that sur-face irradiance frequently surpassed the correspond-ing clear-sky irradiance level, and instantaneously exceeded the extraterrestrial solar radiation on many occasions. This phenomenon is confirmed by both duplicating pyranometers, which gave almost iden-tical measurements. The cloud-induced irradiance enhancement was observed almost every day during the 2-month measurement period except for a few completely overcast days. Fig. 2 gives two examples of daily temporal changes of surface irradiance under cloudy conditions (day 35 and 38). Observed weather
elements are marked on the time (x-) axis. Also shown in the figure are clear-sky and extraterrestrial solar ir-radiance. In general, large enhancement occurred with cloud cover around 4/8 to 6/8, which corresponds to partly (scattered) to mostly (broken) cloudy con-ditions. Under these circumstances, cumulus clouds were often found dominating the sky but other types of clouds such as altocumulus, stratocumulus and al-tostratus were often present in the sky as well. Other features worth noting include the following.
1. Enhancement of surface irradiance was generally associated with erratic fluctuations in the time se-ries. Extremely high irradiance values were often preceded and followed by large drops in surface irradiance, indicating the presence and movement of thick and broken clouds. Smoothly changing or slightly fluctuating measurements rarely showed ir-radiance enhancement. In the latter case, the mod-eled clear-sky irradiance curves served as the outer boundary of the small fluctuations.
2. The magnitude of the fluctuation, that is, the dif-ference between local minima and maxima of suc-cessive shaded and sunlit periods, can exceed the magnitude of the corresponding clear-sky surface irradiance.
3. The irradiance enhancement occurred not only around noontime but also in early morning or late afternoon. This is in contrast to what was reported by Segal and Davis (1992) for the Front Range of Colorado, USA where enhancement was observed only around noontime.
4. The erratic fluctuations and enhancement of sur-face irradiance can occur before and after a long period of reduced surface solar radiation, indicat-ing the presence of advancindicat-ing and departindicat-ing large optically thick clouds near times when enhanced irradiance was observed (e.g. during 13–14 h of day-35, Fig. 2).
4.2. Bimodality in relative changes of surface solar irradiance
We also studied the distribution of the relative changes of surface solar irradiance under the impacts of clouds. The relative change r is calculated by
Fig. 2. Examples of the temporal changes of surface solar irradiance under partly cloudy conditions. Also shown are calculated clear-sky surface solar irradiance and extraterrestrial solar irradiance. Observed sky conditions are marked on the x-axis. The abbreviations included in the figure are defined as follows: BKN broken (clouds); Cu cumulus clouds; Ac altocumulus; As altostratus; Sc stratocumulus; St stratus; Cb cumulus congestus; Ci cirrus; Cs cirrus stratus.
where I is the measured surface solar irradiance. To avoid the potential problems in sensor responses to low
β, in the analyses we excluded data withβ <5◦. We, then, calculated the probability density function p(r) for the distribution of r from the measurements ob-tained during the 2-month field campaign. The
prob-ability density p(r) is defined by
p(r)=nr→r+1r
N 1r (9)
where N is the total number of measurements and
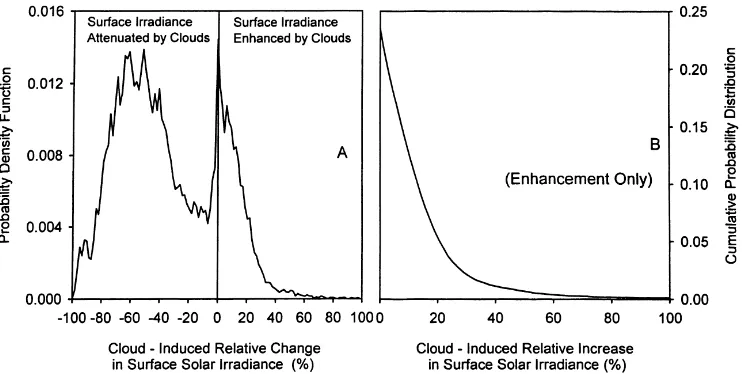
Fig. 3. Probability density function (A) and cumulative probability distribution (B) of cloud-induced changes in surface solar irradiance relative to the clear-sky level. Analyses used all measurements without regard to the time of day.
relative changes falling into the interval (r,r+1r). From Eq. (9), we defined the cumulative probability distribution F(r) as in Eq. (10):
F (r)=
Z +∞
r
p(z)dz (10)
F(r) represents the probability that the relative change in surface irradiance exceeds a given value r. For the F(r), we are only interested inr >0% (enhancement). Fig. 3 shows the results for the probability density function (Fig. 3(A)) and the cumulative probability distribution (Fig. 3(B)) derived from the measure-ments. A key feature of the probability density func-tion (Fig. 3(A)) is that it has a bimodal pattern. A broad peak is located at the negative side (reduced irradi-ance, negative scale on the x-axis) and centered atr∼ −60%, indicating that dominant clouds overhead the measurement point substantially attenuated light levels reaching the surface. A sharp peak is located around the clear-sky irradiance level (0%) but with a long tail in the enhancement side (positive scale on the x-axis). There is a steep drop in the magnitude of the probabil-ity densprobabil-ity function as r changes from positive to neg-ative. For convenience in expression, we shall call the peak at the negative side the shade peak and the peak around the clear-sky irradiance level the shine peak.
The cumulative probability distribution shows that the frequency of irradiance enhancement by clouds is
fairly high (Fig. 3(B)). More than 20% of our irradi-ance measurements are enhirradi-anced measurements. The average r for the enhancement is 14.3%. For compar-ison, the average r for the attenuation is−48.7% and the overall average for r (including both the enhance-ment and attenuation) is−35.2% (Table 1). Therefore the cloud gap effect represents a substantial compen-sation for the attenuation of sunlight by clouds. Be-cause of the abnormal distributions, these means are for illustrative purpose only and must be treated cau-tiously. For example, due to the bimodal pattern, the overall average of the relative change r, which falls be-tween the two peaks, is not a representative indication of effects of clouds on surface irradiance (Fig. 3(A)). To determine how the patterns, shown in Fig. 3, evolve with time during the day, we divide the daytime into seven periods of equal duration: early morning period, middle morning period, late morning period, noontime period, early afternoon period, middle after-noon period, and late afterafter-noon period. Each period
Table 1
Some statistics on cloud modulation of surface irradiance Enhancement
only
Attenuation only
Over all Mean relative change (%) 14.3 −48.7 −35.2
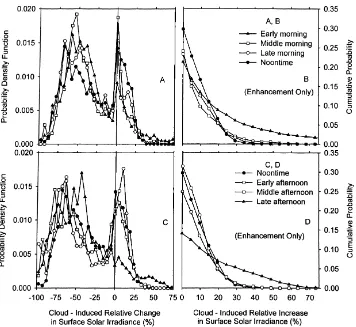
Fig. 4. Probability density functions ((A) and (C)) and cumulative probability distributions ((B) and (D)) of cloud-induced changes in surface solar irradiance relative to the clear-sky level for different periods of the day.
lasts for 1 h and 40 min. For each period, we deter-mine the probability density function and the cumu-lative probability distribution as in Eq. (9) and (10), respectively. The distributions obtained are shown in Fig. 4. The probability density function exhibits a bi-modal characteristic (Fig. 4(A) and (C)) for all periods of the day. However, the shine peak tends to dimin-ish at the low solar elevation angles, especially during the afternoon. The shade peak for the noontime period tends to be smaller than other periods. While the shine peaks for other time periods are centered around the clear-sky irradiance (r = 0%), the shine peaks cor-responding to the early and middle afternoon periods are located at the enhancement side (r >0%).
The cumulative probability distributions for differ-ent time periods of the day (Fig. 4(B) and (D)) show that noontime and early afternoon are the time when
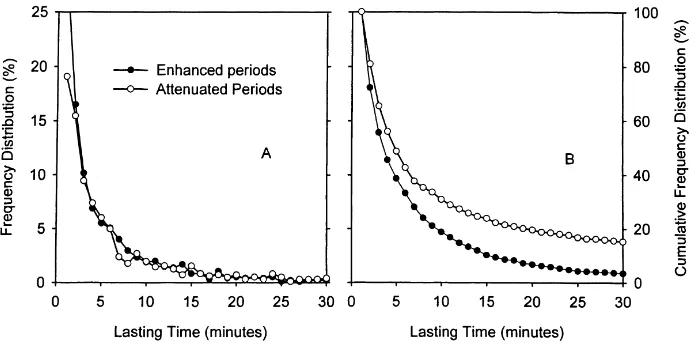
Fig. 5. Frequency distributions (A) and cumulative frequency distributions (B) of the duration of cloud-induced enhancement and attenuation of surface solar irradiance. All degrees of enhancement and attenuation are included.
4.3. Distributions of enhanced and attenuated periods
The periods of enhanced surface solar irradiance were generally short. However, occasionally long pe-riods with enhanced solar irradiance lasting for nearly 1 h were observed. We determined the duration of periods of enhanced and attenuated surface irradi-ance based on the time when the measured irradiirradi-ance curve crosses the modeled clear-sky irradiance curve. The distributions (histograms) of these periods were then studied. Fig. 5 shows the frequency distributions (Fig. 5(A)) and cumulative frequency distributions (Fig. 5(B)) of the duration of the enhanced and at-tenuated periods. For both the enhancement and attenuation, the frequency decreases as the duration increases (Fig. 5(A)). Both distributions exhibit typi-cal hyperbolic features. The initial decrease is fast but the trend becomes very flat after the period exceeds 10 min (Fig. 5(A)). A similar pattern is also shown in the cumulative frequency distributions (Fig. 5(B)). This hyperbolic feature results from the existence of some persistent long periods of surface irradiance enhancement and attenuation in the measurement. It also appears that the attenuation has higher probabil-ities to experience long duration than the enhance-ment. This is shown clearly in Fig. 5(B) in which the cumulative frequency distribution curve for the atten-uation is above the curve for the enhancement. The
average duration for the enhancement is 7 min while the average duration for the attenuation is 24 min (Table 1). These means, reported here and following, are for illustrative purposes only due to the hyperbolic distributions of involved variables.
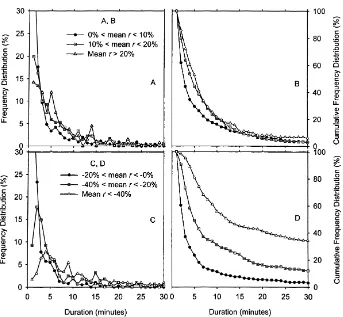
To learn, how the duration distributions change with the degrees of enhancement and attenuation, we used the mean relative irradiance changer¯in a given period as an index and separated the distributions into the fol-lowing categories:r >¯ 20%, 10%<r <¯ 20%, 0%< ¯
r < 10%,−20% <r <¯ 0%, −40% < r <¯ −20%, andr <¯ −40%. The ranges of these categories were determined based on considerations of including suffi-cient number of samples in each category. Fig. 6 shows the frequency distributions (histograms, Fig. 6(A) and (C)) and cumulative frequency distributions (Fig. 6(B) and (D)) for these categories. The mean times of du-ration are given in Table 2. It shows that the mean duration increases as the degree of enhancement or attenuation increases. The peak of the frequency dis-tributions for the attenuation tends to move towards longer duration as the degree of attenuation increases (mean r decreases, Fig. 6(C)).
4.4. Scaling (scale invariant) regimes of surface irradiance
Fig. 6. Frequency distributions ((A) and (C)) and cumulative frequency distributions ((B) and (D)) of the duration of cloud-induced enhancement ((A) and (B)) and attenuation ((C) and (D)) of surface solar irradiance for different degrees of enhancement or attenuation.
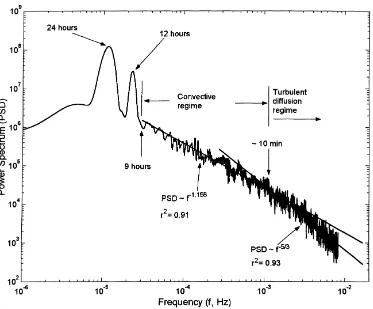
determine the characteristic time scales of the mod-ulation of the irradiance by clouds. Measurements of irradiance were continuous from 7 January to 28 February. The FFT was conducted for this period us-ing the Signal Processus-ing Toolbox of MATLAB with a 4-day Bartlett window for spectral averaging. The log–log power spectrum obtained is shown in Fig. 7.
A striking feature of the spectrum is the lack of characteristic time scales other than the two peaks rep-resenting harmonics for the diurnal cycle (Fig. 7). In particular, for cycles with periods less than about 9 h,
Table 2
Mean duration of periods for different degrees of enhancement and attenuation
Mean relative change (%) r >¯ 20 10<r <¯ 20 0<r <¯ 10 −20<r <¯ 0 −40<r <¯ −20 r <¯ −40
Mean duration (min) 9 7 6 6 13 57
the log–log spectrum is composed of two nearly linear sections with a smooth transition around 10 min. The linearity indicates a power law relationship between the power spectrum density (PSD) and frequency (f), which in turn reflects invariance of statistical prop-erties under a scale changing operation. For the time scale between 10 min to 9 h, PSD ∼ f−1.158 with
r2 = 0.91. For the time scale smaller than 10 min, the classical Kolmogorov f−5/3law applies withr2=
Fig. 7. Power spectrum of the 1 min values of surface solar irradiance from 7 January to 28 February, 1999.
temporal dynamics of surface irradiance. The section from 9 h to 10 min includes convective and mesoscale cloud processes. Small cumulus clouds and the grow-ing and decaygrow-ing towers within a large cumulus cloud have time scales in the order of 10 min. Ensembles of convective clouds in organized mesoscale systems have durations of tens of minutes to hours. We re-gard this section of the spectrum as characterizing the convective regime of the cloud systems encountered at the study location. The −5/3 slope, characteris-tic of turbulent processes, with a time scale<10 min is attributed to the atmospheric turbulence diffusion regime. This regime probably reflects internal inho-mogeneities within individual clouds (e.g. variations in liquid water content) and external inhomogeneities in fields composed of relatively small clouds. These internal and external small-scale inhomogeneities cre-ate high frequency fluctuations in surface irradiance. These two regimes are discussed in more detail below.
4.5. Influence on surface solar radiative forcing
On a daily basis, the total energy input of the cloud-induced enhancement to surface solar radiative forcing Eg(J m−2) can be determined by Eq. (11)
Eg=
Z sunset
sunrise
{max[I (t ), Ic(t )]−Ic(t )}dt (11)
The total solar energy attenuated by clouds during a day Eais determined from Eq. (12)
Ea =
Z sunset
sunrise
{Ic(t )−min[I (t ), Ic(t )]}dt (12)
Finally, the total daily surface solar radiative forcing Et is given by Eq. (13)
Et =
Z sunset
sunrise
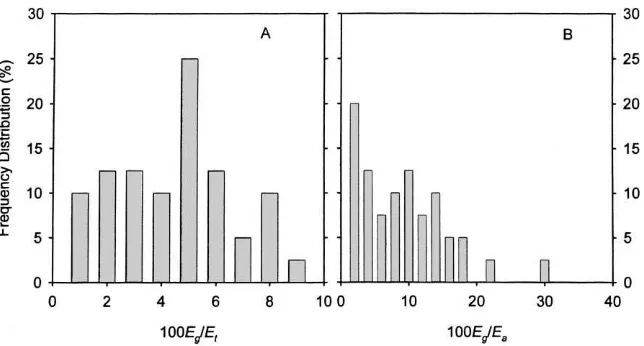
Fig. 8. Frequency distributions of the percentages of daily total solar energy contribution from cloud gap effect relative to daily total solar energy received by the ground surface (A) and the percentages of this energy contribution relative to daily total solar energy attenuated by clouds (B).
The magnitudes of Egrelative to Eaand Et(100Eg/Et
and 100Eg/Ea, respectively) are determined from
our measurements. Fig. 8 shows the histograms of these two percentages. The frequency distribution of 100Eg/Et has a peak around 5% (Fig. 8(A)).
Aver-aged over the 2-month period of our measurements, the cloud-induced surface irradiance enhancement contributed 4.0±0.4% of daily solar energy input onto the ground surface. The frequency distribution of 100Eg/Ea apparently has multiple peaks (Fig. 8(B)).
On a daily basis, the energy input to the ground surface due to the cloud-induced surface irradiance enhance-ment averaged over the 2-month period amounted to 11.7±2.7% of the solar energy attenuated by the clouds.
5. Summary and conclusions
Clouds modulate surface solar radiation in a com-plex manner with two seemingly contradictory as-pects. The commonsense aspect is that overhead clouds reduce surface irradiance. The peak distribu-tion of relative change r around−60% indicates that dominant clouds during our measurement periods were optically thick (Fig. 3(A) and Fig. 4(A) and (C)). Less obvious is that clouds, especially cumuli-form clouds, can enhance surface irradiance to such a
degree that the extraterrestrial irradiance is exceeded. The enhancement was a pervasive phenomenon in our observations. It covered almost a quarter of our daily irradiance measurements or equivalently a quarter of daily time (one datum represents 1 min, Fig. 3(B) and Fig. 4(B) and (D)). The energy contribution from the cloud gap effect to the solar radiative forcing at the surface was not trivial. It accounted for 4.0% of the daily solar radiative forcing at the surface and compensated for 11.7% of solar energy attenuation by clouds.
or attenuation. Another important factor is the diffu-sive nature of the part of the surface solar irradiance in excess of the clear-sky level. Plant canopies have higher photosynthetic use efficiencies for diffuse radi-ation than for direct beam radiradi-ation (Wang and Jarvis, 1990; Gu et al., 1999). The biophysical importance of cloud gap effect was already revealed in Gu et al. (1999). They found that cloud gap effect led to higher photosynthetic rate of two boreal deciduous forests.
Although data are unavailable to us for analyzing spatial heterogeneity in surface solar irradiance, the findings presented here cast some insights into the mosaic radiative landscape created by cloud fields. The magnitude of the fluctuation in the time series is a reflection of the magnitude of spatial variability. As shown in our time series, the differences between local minima and maxima of successive shaded and sunlit periods often exceeded the magnitude of the corresponding clear-sky surface irradiance. If the ir-radiance differences between sunlit and sun-shaded areas have this magnitude, large horizontal hetero-geneities in exchanges of carbon dioxide, sensible heat and water vapor can be created even for horizontally homogeneous ecosystems. If the heterogeneities in-duced by cloud fields fall within the footprints of flux towers, the interpretation of flux measurements can be complicated.
It appears that this study is the first to report that modulations of surface solar irradiance by clouds can be characterized by a convective regime and a turbu-lence diffusion regime (Fig. 7). The convective regime is responsible for fluctuations of relatively long time periods while the turbulence diffusion regime controls fluctuations of relatively short time periods. Fields of fair-weather cumulus, common from about 10 am to midday (local time), are comprised of clouds which are approximately cubic in dimensions with sides in the order of 1–2 km. Dominant radiative signals at 3 min suggest that such clouds are embedded in a velocity field of 5–10 m s−1. Cloud-free air spaces would then correspond to linear dimensions similar to the size of the clouds. Once development sets in and deeper convective clouds form, the vertical dimen-sions of the cumulus congestus and cumulonimbus are likely to exceed their horizontal dimensions reaching heights of 15–18 km. Cloud ensembles and mesoscale convective systems become organized and persist for numbers of hours.
It is well known that when a passive scalar is introduced into a turbulent fluid, the spectrum of its fluctuations is generically described by the Kolmogorov f−5/3law. The observed−5/3 power law in the spectrum of surface irradiance suggests that scattering from the vertical sides of the cumulus clouds is a function of the turbulent motions involved in the three dimensional mixing which takes place on these cloud walls.
Acknowledgements
We are grateful for the field infrastructure and fi-nancial support that NASA provided to achieve this study through TRMM-LBA project. We also thank our Brazilian colleagues Dr. Gilberto Fisch and Jorge Oliveira (Centro Técnico Aerospacial, São José dos Campos) for their assistance with the field measure-ments. Data analysis was supported by the NASA grants NAG5-6421 (Global Vegetation Dynamics) and NAG5-7956 (Land-Surface Characterization of South African Savannas). We greatly benefited from discus-sions with and comments of our colleague B. Hayden. Finally, we thank two journal anonymous reviewers for their comments to improve the manuscript.
References
Brasseur, G.P., Orlando, J.J., Tyndall, G.S., 1999. Atmospheric Chemistry and Global Change. Oxford University Press, New York, USA, p. 654.
Duchon, C.E., O’Malley, M.S., 1999. Estimating cloud type from pyranometer observations. J. Appl. Meteor. 38, 132–141. Garstang, M., Fitzjarrald, D., 1999. Observations of Surface to
Atmosphere Interactions in the Tropics. Oxford University Press, New York, USA, p. 405.
Gu, L., Fuentes, J.D., Shugart, H.H., Staebler, R.M., Black, T.A., 1999. Responses of net ecosystem exchanges of carbon dioxide to changes in cloudiness: results from two North American deciduous forests. J. Geophys. Res. 104, 31421–31434. Ibqal, M., 1983. An Introduction to Solar Radiation. Academic
Press, p. 390.
Mansfield, T.A., Heath, O.V.S., 1963. Studies in stomatal behaviour. X. An investigation of responses to low intensity illumination and temperature in Xanthium pennsylvanicum. J. Exp. Bot. 15, 114–124.
Meyers, T.P., Dale, R.F., 1983. Predicting daily insolation with hourly cloud heights and coverage. J. Climate Appl. Meteor. 22, 537–545.
Michalsky, J.J., 1988. The Astronomical Almanac’s algorithim for approximate solar position (1950–2050). Solar Energy 40, 227– 235.
Press, W.H., Teukolsky, S.A., Vetterling, W.T., Flannery, B.P., 1992. Numerical Recipes in FORTRAN — The Art of Scientific Computing, 2nd Edition. Cambridge University Press, New York, p. 963.
Segal, M., Davis, J., 1992. The impact of deep cumulus reflection on the ground-level global irradiance. J. Appl. Meteor. 31, 217– 222.
Smith, W.L., 1966. Note on the relationship between total precipitable water and surface dewpoint. J. Appl. Meteor. 5, 726–727.