www.elsevier.nlrlocateraqua-online
Glutathione-dependent defence system and
monooxygenase enzyme activities in Arctic charr
ž /
Sal
Õ
elinus alpinus L. exposed to ozone
Ossi Ritola
a,b,), Tapani Lyytikainen
¨
c,d, Paivi Pylkko
¨
¨
e,
Hannu Molsa
b, Pirjo Lindstrom-Seppa
a¨ ¨
¨
¨
a
Department of Physiology, UniÕersity of Kuopio, P.O. Box 1627, FIN-70211 Kuopio, Finland
b
Institute of Applied Biotechnology, UniÕersity of Kuopio, P.O. Box 1627, FIN-70211 Kuopio, Finland
c
Department of Biological and EnÕironmental Sciences, UniÕersity of JyÕaskyla, P.O. Box 35, FIN-40351¨ ¨
JyÕaskyla, Finland¨ ¨
d
Finnish Game and Fisheries Research Institute, Laukaa Fisheries Research and Aquaculture, FIN-41360 Valkola, Finland
e
National Veterinary and Food Research Institute, Kuopio Regional Laboratory, P.O. Box 92, FIN-70701 Kuopio, Finland
Accepted 9 November 1999
Abstract
One of the major obstacles of the increasing usage of ozone in aquaculture is the lack of relevant risk assessment in culture conditions. Before the apparent advantages of ozonation can be utilised efficiently, the safety margins and biological basis of ozone toxicity should be assessed. In
Ž Ž ..
this research, 1-year-old Arctic charr SalÕelinus alpinus L. were exposed to an ozone concentration high enough to inactivate Aeromonas sp. bacteria in freshwater, but too low to be directly lethal to the fish themselves. The effects of ozone exposure on the activity of glutathione-dependent antioxidant enzymes and monooxygenase reactions were studied in blood and in liver. The fish were acclimated for 2 months at 10.38C and 14.18C followed by an ozone exposure for 15 and 30 min. The fish were exposed to ozone at both temperatures giving a calculated O dose3
Ž .
of 0.34 and 0.69 mgrl min during the above sampling times. Oxidised glutathione GSSG and
Žw x .
oxidative stress index 2=GSSGrtotal glutathione=100 were significantly elevated in whole blood by ozone exposure at both temperatures indicative of oxidative stress. At the same time, no
Ž .
signs of oxidative stress were detected in liver. However, total glutathione tGSH concentrations
)Corresponding author. Institute of Applied Biotechnology, University of Kuopio, P.O. Box 1627,
FIN-70211 Kuopio, Finland. Tel.:q358-17-1631-43; fax:q358-17-1631-48.
Ž .
E-mail address: [email protected] O. Ritola .
0044-8486r00r$ - see front matterq2000 Elsevier Science B.V. All rights reserved.
Ž .
in liver were elevated at 148C indicating increased ability of liver tissue to defend against reactive
Ž . Ž .
oxygen species ROS . Glutathione S-transferase GST , GSSG and cytochrome P-450 catalytic
Ž .
activity ethoxyresorufin-O-deethylase, EROD in liver were not influenced by ozone exposure.
Ž .
Initially, both hepatic glutathione reductase GR and GSH were elevated at 108C, possibly indicating ability to compensate for temperature. This study demonstrates that even the lowest
Ž .
dose 0.34 mgrl min of ozone was high enough to cause oxidative stress in the blood of Arctic charr and the signs of oxidative stress occur throughout the exposure. Furthermore, a blood sample is a reliable source of information when assessing the status of the glutathione-dependent antioxidant system after a short-term ozone exposure.q2000 Elsevier Science B.V. All rights reserved.
Keywords: Ozone; Oxidative stress; Glutathione; EROD; Temperature; Arctic charr
1. Introduction
Ž . Ž .
Ozone O3 has been used for decades to disinfect drinking water Rice, 1985 and to
Ž .
treat sewage effluents Brink et al., 1991 . The ozonation techniques shown effective in handling large volumes of water in municipal water works are now being applied also in aquaculture. Ozonation is proven useful in promoting the removal of solid matter ŽRueter and Johnson, 1995 , stabilisation of water quality in recirculating systems Reid. Ž
.
and Arnold, 1994; Summerfelt et al., 1997 and is advantageous in disease control ŽLiltved et al., 1995 . This indicates that ozonation could find a place in the intensive. culture of Arctic charr, which is an endangered species, but also a potential candidate for
Ž .
commercial aquaculture Jobling et al., 1993 . However, in spite of the apparent advantages of ozone in aquaculture, its physiological effects on the fish are still largely
Ž unknown since unexpected deaths have occurred even at low O concentrations Bullock3
. et al., 1997 .
Decomposition of ozone in water can take place directly and involves reactions of Ž
molecular ozone in water with unsaturated aromatic and aliphatic compounds Bablon et .
al., 1991 . These types of reactions are predictable and can be controlled. On the other hand, indirect decomposition of ozone is rapid, unpredictable and produces harmful
Ž .
intermediates, the so-called reactive oxygen species ROS such as the superoxide
Ž Py. Ž . Ž P.
radical O2 , hydrogen peroxide H O , hydroperoxyl radical HO2 2 2 and ozonide Ž Py.
radical O3 . These intermediates might be detrimental to the fish, leading to a state called oxidative stress.
In oxidative stress, pro-oxidant forces overwhelm the antioxidant defence system of Ž
animals. This has been detected after certain xenobiotics or ozone exposure Mustafa,
. Ž .
1990 . According to Mustafa 1990 , ozone-induced ROS are capable of causing oxidative stress in mammals, which is reflected in peroxidation of lipids, loss of functional groups and enzyme activities and alteration in membrane permeability. Therefore, it is probable that similar processes could occur in fish as well. Aquatic organisms are protected against ROS by antioxidant enzymes and low molecular weight
Ž .
scavengers Winston and Di Giulio, 1991; Peters and Livingstone, 1996 . The most important scavengers are glutathione, vitamins E and C and total carotenoids, which
Ž .
Ž .
Cellular glutathione L-g-glutamyl-L-cysteinylglycine is a tripeptide that plays a crucial role in oxidative stress. It is produced intracellularly and is involved in free radical scavenging, detoxification of electrophiles, maintenance of thiol-disulfide status
Ž
and signal transduction Meister and Anderson, 1983; Deneke and Fanburg, 1989; Droge
¨
.
et al., 1994 . If potentially toxic H O2 2 is present in a tissue, GSH is oxidised by
Ž . Ž .
glutathione peroxidase GPX, EC 1.11.1.9 to glutathione disulfide GSSG . GSSG is
Ž .
reduced back to GSH by glutathione reductase GR, EC 1.6.4.2 . GSH is also able to
Ž .
protect cells directly by scavenging radicals Meister and Anderson, 1983 . If toxic xenobiotics were not conjugated to GSH, they could combine covalently, e.g., with DNA, RNA or cell proteins and thus cause serious cell damage. Several studies have shown that glutathione homeostasis can be used as a biomarker in a variety of fish
Ž
species being exposed to different xenobiotics Otto and Moon, 1996b; Hasspieler et al., .
1994 . However, little or nothing is known of the piscine glutathione defence system in response to ozone exposure.
Ž .
In xenobiotic exposure e.g., polychlorinated biphenyls, PCBs cellular GSH has a
Ž .
notable influence on metabolism by controlling the cytochrome P-450 CYP1A
path-Ž .
way in liver Otto et al., 1996a . Cytochrome P-450-dependent metabolism is a two step
Ž . Ž
process where xenobiotics are oxidised phase I reactions and further conjugated phase .
II reactions in order to facilitate their excretion or neutralise their bioreactivity. The first
Ž .
phase reactions are catalysed by cytochrome P-450 CYP -dependent enzymes, the monooxygenases. The catalytic activity of one of the main isoenzymes, CYP1A1, can be
Ž .
measured enzymatically by the ethoxyresorufin-O-deethylase EROD reaction. This activity has been widely found in aquatic organisms and used as a biomarker in
Ž .
environmental biomonitoring studies Lindstrom-Seppa et al., 1992; Tuvikene, 1995 .
¨
¨
Although, after the following second phase reactions xenobiotics are transformed to be
Ž .
more excretable by the action of, e.g., glutathione S-transferase GST, EC 2.5.1.18 , activation of more reactive metabolic products can occur. Production of electrophilic metabolites of the xenobiotic, free radicals or ROS can result in cytotoxic damage ŽLemaire and Livingstone, 1993 . During ozone exposure, both the glutathione-depen-. dent defence system and the P-450 pathway might be recruited to resist the challenge by ROS.
The current study was carried out to evaluate the effects of an ozone dose on the glutathione-dependent defence system and catalytic activity of cytochrome P-4501A in Arctic charr. Ozone exposures were carried out at two temperatures in order to evaluate if there was a thermal influence on glutathione metabolism. Samples were taken from the liver to determine its responses to ROS. Blood was also sampled to see if it could serve as a potential tissue for analysing the state of oxidative stress without necessitating the sacrifice of the fish.
2. Materials and methods
2.1. Animals
Fertilised eggs of Arctic charr of the Lake Inari strain were hatched and cultivated in
Ž X X
Finland. After reaching an initial weight of 40 g, the fish were transferred into two
Ž . Ž .
constant temperatures: 10.38C 95% CL, "0.38C and 14.18C "0.38C . Fish were acclimated 2 months prior to the experiment in round fibreglass tanks. Water flow to the tanks was maintained at 2 to 7.7 lrmin and the oxygen level was kept over 6 mgrl, measured in the tank outlets. The fish were fed on excess with commercial dry food ŽTess Nutra G 3.0 mm which was dispensed 8 h daily from 4 AM to 12 PM by. Ž . beltfeeders. Constant light rhythm 18L:6D was used during the experiment.
On the day of exposure, the fish were transferred in water to the ozone exposure tank using the same ambient temperature where they were acclimated. The Arctic charrs
Ž .
averaged 67.7 g in weight S.E. 11.8 g during the exposure.
2.2. Exposure system
Ozone dose was selected to be high enough to inactivate Aeromonas sp., which,
Ž .
according to Wedemeyer and Nelson 1977 , is 0.1 mg O3rl min, and according to
Ž .
Liltved et al. 1995 is 0.2 mg O3rl min, but not to cause lethal damage to Arctic charr with 30-min exposure. The Arctic charr were exposed to ozone in a recirculation system. The fish were kept for 15 or 30 min in the 50-l exposure tank covered with floating plastic. Excess water from the exposure tank was led to the collection tank and pumped
Ž .
up to the counter current contact column 1800 mm high, 12 l , where ozone gas was
Ž . Ž .
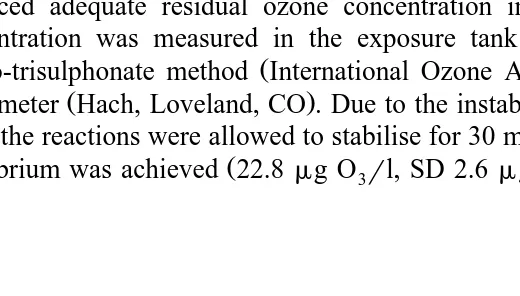
mixed with water Fig. 1 . Two ozone generators Red Sea Fish pHarming, Israel produced adequate residual ozone concentration in the system. The residual ozone concentration was measured in the exposure tank three times per exposure by the
Ž .
indigo-trisulphonate method International Ozone Association with a Hach DR 2000
Ž .
colorimeter Hach, Loveland, CO . Due to the instability of the ozone at low concentra-tions, the reactions were allowed to stabilise for 30 min prior to the exposures. When the
Ž .
equilibrium was achieved 22.8mg O3rl, SD 2.6 mg O3rl at both temperatures, 9 to
Fig. 1. Schematic illustration of water flow in the ozone exposure system used in the present study.
12 randomly selected fish were transferred to the exposure tank at the same time. Three to four fish were sampled before the exposure and three to four fish were taken after 15-and 30-min ozone exposure. The calculated ozone dose was 0.34 mgrl min after 15 min and 0.69 mgrl min after 30-min exposure. The procedure was repeated three times in both temperatures.
2.3. Sampling and sample preparation
Fish were stunned by a blow to the head and weighed. Blood samples were collected with Na-heparinized syringes from the caudal vein. Blood was acidified with 5% 5
Ž . Ž . Ž .
sulfosalicylic acid 1:2 for total glutathione tGSH and oxidised glutathione GSSG analysis. For hepatic glutathione and biotransformation enzyme analysis, the liver was removed and weighed. All the samples were frozen immediately in liquid nitrogen until analysis.
Ž Blood samples were thawed and centrifuged at 28C at 10,000=g for 5 min Sorvall
.
Instruments RC5C . GSSG and tGSH were analysed immediately from supernatants.
Ž . Ž .
Total glutathione tGSH is expressed as a sum of oxidised GSSG and reduced
Ž .
glutathione GSH in GSH equivalents. Oxidative stress index describes the ratio of
Ž .
GSSG to tGSH in Eq. 1 Boehme et al., 1992 . An increased value is considered as a sign of oxidative stress.
Oxidative stress indexs
Ž
Ž
2=GSSG.
rtGSH.
=100Ž .
1where GSSGsoxidised glutathione and tGSHstotal glutathione. The values of GSSG are multiplied by two since 2 nmol of GSH are necessary to form 1 nmol of GSSG.
For measurements of GSSG and tGSH, the liver samples were homogenized in
Ž .
ice-cold 5% 5 sulfosalicylic acid 1:4 and 1:5, respectively with a Potter-Elvehjem-type Ž
homogenizer and centrifuged at 10,000=g for 5 min at 28C Sorvall Instruments .
RC5C . Supernatants were stored aty808C until analysed.
Frozen liver samples for microsomal and cytosolic tissue fractions were weighed and
Ž .
homogenised in 0.25 M sucrose 1:4 with Potter-Elvehjem-type homogenizer. The
Ž .
homogenates were centrifuged Sorvall Instruments RC5C for 20 min at 10,000=g.
Ž Supernatant fractions were collected and centrifuged for 60 min at 105,000=g Kontron
.
TGA-65 . Microsomes were resuspended in 0.25 M sucrose containing 60 mM Tris, 5
Ž .
mM EDTA and 20% glycerol. Microsomes for 7-ethoxyresorufin EROD activity determination and supernatant fractions for GST, GPX and GR analysis were prepared at 48C and stored at 808C until analysis.
2.4. Biochemical analysis
Ž .
Total glutathione concentration was measured according the method of Tietze 1969
Ž . X
modified by Adams et al. 1983 , where the rate of reduction of 5,5
-dithiobis-2-nitro-Ž . Ž . Ž .
Ž . mM DTNB, 0.530 U GR and 0.18 mM NADPH. The method of Griffith’s 1980 was applied in determination of GSSG concentration. Final chemical concentrations were 70 mM KH PO 3.5 mM Na EDTA pH 7.5, 0.25 mM DTNB, 0.5 U GR and 0.22 mM2 4 2
NADPH. Both glutathione analyses were measured at 208C with double-beam
spectro-Ž .
photometer Perkin Elmer Lambda 2 UV , and the results were calculated using standard curves.
The catalytic properties of cytochrome P-4501A-dependent monooxygenases were detected as ethoxyresorufin-O-dependent monooxygenases were detected as EROD
Ž Ž .
activities Burke and Mayer 1974 with final concentration of 1mM ethoxyresorufin.
Ž .
GST was measured by the method of Habig et al. 1974 , where 1 mM 1 chloro
Ž .
dinitrobenzene CDNB and 1 mM GSH were used at pH 6.5. GPX was assayed using cumene hydroperoxide as a substrate with cuvette concentrations of 0.08 mgrml
Ž .
cumene, 0.25 mM GSH, pH 7.6 Floche and Gunzler, 1984 . GR was measured
Ž .
spectrophotometrically according to Carlberg and Mannervik 1985 with final concen-trations of 0.12 mM NADPH, 0.4 mM GSSG, pH 7.6. In all of the above analyses, protein contents were chosen to give linear changes in enzyme activities. The protein
Ž .
contents of the samples were determined by the method of Bradford 1976 using bovine
Ž .
serum albumin Sigma as the standard. All analyses were performed at 188C and the activities expressed as units per milligram protein. All chemicals were purchased from Sigma except 5-sulfosalicylic acid, which was obtained from Aldrich Chemicals.
2.5. Statistics
Ž
Data were analysed using the SPSS for Win 7.5 computer program SPSS, Chicago, .
USA . Homogeneity of variances in variables was tested with Levene test and normality of variables with Shapiro–Wilk test. When homogeneity and normality of variances prevailed, a parametric one-way analysis of variance test with a priori contrasts was used to test differences between groups. Non-parametric Kruskall–Wallis and Mann–Whit-ney U-tests with Bonferroni’s correction were used in other cases. The differences were regarded as statistically significant when p- 0.05.
3. Results
As seen in Fig. 2, the whole blood GSSG concentrations increased significantly with ozone dose at both temperatures. After 15 min of ozone exposure, the GSSG concentra-tions were 1.9 and 2.3 times elevated in the 108C and 148C groups compared to the
Ž
values prior to the exposure P- 0.001 and 0.038, respectively, Mann–Whitney .
U-test . After 30-min exposure, GSSG concentrations were 2.4 times higher at both
Ž .
temperature groups P- 0.001, for both groups, Mann–Whitney U-test in comparison to respective control groups. There were no differences between temperature groups during the exposure.
The oxidative stress index in blood increased significantly during ozone exposure at
Ž .
Ž . Ž .
Fig. 2. Oxidised glutathione GSSG concentrations mmolrl in whole blood of 1-year-old Arctic charr at 10.38C and 14.18C during ozone exposure. Ozone doses are 0.34 and 0.69 mgrl min after 15 and 30 min,
Ž .
respectively. Data are presented as means"SE ns9–12 ; a, aaa: significantly different compared to
Ž .
control group p-0.05, p-0.001, respectively by Mann–Whitney U-test with Bonferroni’s correction.
Ž .
exposure was 1.4 times higher P-0.031; Contrast and after the 30-min exposure, it
Ž .
was 1.7 times higher P-0.0014; Contrast than the initial values. In the 148C group, the oxidative stress index value after 30-min exposure was 2.5 times higher than the
Ž .
control value P-0.002; Contrast . The values of oxidative stress index in blood were at the same level between temperature groups during the exposure.
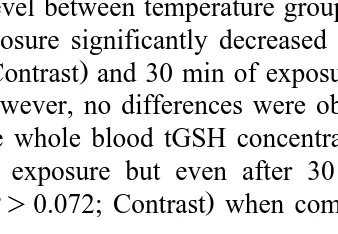
Ozone exposure significantly decreased GSH concentrations in blood after 15 min ŽP-0.003; Contrast and 30 min of exposure P. Ž -0.037; Contrast in the 14. 8C group ŽTable 1 . However, no differences were observed in the 10. 8C group caused by ozone exposure. The whole blood tGSH concentrations tended to increase in the 108C group during ozone exposure but even after 30 min of exposure the difference was not
Ž .
significant P)0.072; Contrast when compared to control group. In the 148C group,
Fig. 3. Oxidative stress index in whole blood of 1-year-old Arctic charr at 10.38C and 14.18C during ozone exposure. Ozone doses are 0.34 and 0.69 mgrl min after 15 and 30 min, respectively. Data are presented as
Ž . Ž
means"SE ns9–12 ; a, aa: significantly different compared to control group p-0.05, p-0.01,
.
Table 1
Ž . Ž .
Effects of ozone exposure on whole blood reduced GSH and total tGSH glutathione concentrations in Arctic charr at two temperatures
Data represent mean activity"SE; ns7–12; Contrast procedure.
Control Ozone exposure
Significantly different from 108C group, p-0.05, by one-way analysis of variance. UU
Significantly different from 108C group, p-0.01, by one-way analysis of variance.
a
Significantly different from control group, p-0.05, by one-way analysis of variance.
aa
Significantly different from control group, p-0.01, by one-way analysis of variance.
blood tGSH concentrations did not change during ozone exposure. In control groups, both GSH and tGSH concentrations, measured from whole blood samples, were significantly higher in 148C than in 108C control groups. GSH values in 148C group
Table 2
Ž . Ž . Ž .
Effects of ozone exposure on reduced GSH , oxidised GSSG and total tGSH glutathione concentrations and oxidative stress index in Arctic charr liver at two temperatures
Data represent mean concentrations"SE; ns7–12; Contrast procedure for GSSG and by Mann–Whitney
U-test with Bonferroni’s correction for the other variables.
Control Ozone exposure
tGSH mmol g wet tissue
10.38C 1.55"0.10 1.43"0.09 1.47"0.09
Significantly different from 108C group p-0.05 by one-way analysis of variance.
a
Ž .
Ž .
were 1.4 times elevated P-0.004; Contrast and tGSH values were 1.3 times higher ŽP-0.003; Contrast in comparison to 10. 8C.
Initially, hepatic GSH and tGSH concentrations were notably higher in the 108C
Ž .
groups than in the 148C groups P-0.026 for both; Mann–Whitney U-test . GSH tended to increase during the exposure in the 148C group, but the difference was not
Ž .
significant P)0.084; Mann–Whitney U-test due to the wide variability. At 108C, GSH levels were uniform during the exposure. The tGSH concentration stayed at the same level in the 108C group during ozone exposures, but showed an increasing trend in
Ž .
148C groups Table 2 . However, only the difference after 15-min exposure was
Ž .
statistically significant P-0.030; Mann–Whitney U-test when compared to control. As seen in Table 2, hepatic GSSG concentrations were initially at the same level. In the 108C group, GSSG concentrations tended to decrease during the exposure. However,
Ž .
only the decrease after 15-min exposure was significant P-0.046; Contrast in comparison to the control group. No significant changes in hepatic GSSG concentrations at 148C were observed. Similarly, there were no observable changes in the hepatic oxidative stress index in Arctic charr during ozone exposure.
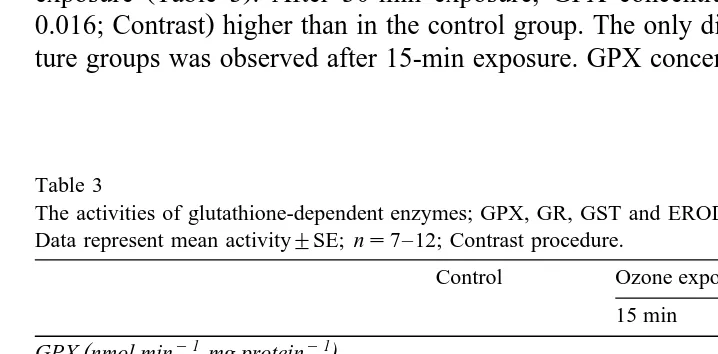
Hepatic GPX concentrations in the 108C groups tended to increase during the ozone
Ž . Ž
exposure Table 3 . After 30-min exposure, GPX concentrations were 1.3-fold P
-.
0.016; Contrast higher than in the control group. The only difference between tempera-ture groups was observed after 15-min exposure. GPX concentrations in the 148C group
Table 3
The activities of glutathione-dependent enzymes; GPX, GR, GST and EROD activity in liver Data represent mean activity"SE; ns7–12; Contrast procedure.
Control Ozone exposure
Significant difference between 15 min and 30 min groups p-0.05 by one-way analysis of variance. U
Significantly different from 108C group, p-0.01, by one-way analysis of variance. UU
Significantly different from 108C group, p-0.05, by one-way analysis of variance.
a
Significantly different from control group, p-0.05, by one-way analysis of variance.
aa
Ž .
were 1.4-fold higher P-0.008; Contrast compared to the 108C group. GR revealed slightly higher activities in liver at 108C than 148C during the ozone exposure but the
Ž .
difference was significant only after 30-min exposure P-0.002; Contrast . At the Ž
same time GR concentrations in the 148C group were significantly lower P- 0.015; .
Contrast in comparison to the 15-min exposure group at the same temperature. The hepatic GST concentration in the 148C group was significantly lower after
Ž .
15-min ozone exposure in comparison to the control group P-0.008; Contrast or the
Ž .
30-min exposure group P-0.034; Contrast . However, the GST concentrations
re-Ž .
mained unchanged at 108C during the exposure Table 3 . Ozone exposure did not evoke any changes in hepatic EROD activities. After 30-min exposure, the EROD activity in the 108C group was lower in comparison to the 148C group and the 15-min exposure group, but not in the control group.
4. Discussion
Ž .
In this study, as little as 15-min ozone exposure O dose: 0.34 mg3 rl min caused symptoms of oxidative stress in Arctic charr. Oxidative stress was detected in whole blood samples as increased oxidised glutathione concentrations as well as in elevated levels of oxidative stress index. Moreover, the basal levels of GSH did vary between liver and whole blood at different temperatures. This finding suggests the importance of temperature in GSH biosynthesis and emphasises the differences between blood and liver tissues in the glutathione-dependent defence system.
Blood and liver were chosen to represent target organs since they play a significant role in glutathione homeostasis. Liver is known to serve as a storage site for GSH in fish ŽYokoyama and Nakazoe, 1991 , and in mammals, it can protect tissues from damage by.
Ž .
ROS by secreting GSH into the bloodstream Sen et al., 1992 . Furthermore, fish erythrocytes are capable of producing GSH-dependent antioxidant enzymes and thus can
Ž
take part in the glutathione-dependent antioxidant defence system Fukunaga et al., .
1992b .
In this study, ozone exposure caused oxidative stress to Arctic charr after 15-min exposure at both temperatures. This was detected by markedly elevated whole blood GSSG concentration and the oxidative stress index. The high GSSG levels probably arose from the oxidation of blood GSH into GSSG, which can be considered as a sign of oxidative stress evoked by ROS. At the same time, oxidative stress index was elevated presumably because the rate of GSSG formation exceeded the capacity of the cell to regenerate GSH from GSSG. The signs of oxidative stress in blood might indicate that ozone exposure was so extensive that the first line of defence, the skin and gill epithelium cells, failed to provide complete protection to Arctic charr against ROS. Elevated levels of GSSG and the oxidative stress index in whole blood, also after 30 min, were indicative of continuous presence of ROS in circulation during ozone exposure. Further, GSSG in blood showed a partial ability to compensate for tempera-ture before the exposure as there were only slight differences in the concentrations.
glutathione-de-Ž
pendent defence system. Since detrimental damage e.g., DNA-fragmentation, lipid .
peroxidation, protein oxidation caused by ozone exposure was not analysed in the present study, it was not possible to assess the harmful dose of ozone, i.e., the point at which oxyradical generation poses a serious threat to the health of Arctic charr. However, in oxidative stress, the struggle at the cellular level against pro-oxidant forces has already started and the maintenance of the defence system and the repair of possible
Ž .
damage requires energy Bell and Cowey, 1990 , which must be withdrawn from the growth budget.
The literature reveals that ozone is highly toxic to teleost fish though there is Ž
considerable variation between different species and life stages Wedemeyer et al., 1979; .
Asbury and Coler, 1980; Paller and Heidinger, 1980; Fukunaga et al, 1992a . Nothing is
Ž .
known about ozone toxicity in Arctic charr. According to Wedemeyer et al. 1979 ,
Ž .
rainbow trout Oncorhynchus mykiss are vulnerable to ozone toxicity, since the LC5096
value for juvenile rainbow trout was 9.3mg O3rl, whereas the lethal threshold level was
Ž .
slightly lower 8 mg O3rl; calculated O3 dose: 46 mgrl min . On the other hand,
Ž .
Wedemeyer et al. 1979 have verified lethal histopathological changes in gill tissue
Ž .
after ozone exposure of 29 mg O3rl for 24 h calculated O dose: 41.8 mg3 rl min . Consequently, the toxicity of ozone in fish is a product of the concentration and
Ž .
exposure time cumulative O3 dose , which should be used in establishing dose–re-sponse-type relationships. At least in rainbow trout, it seems that there is a conservative
Ž .
margin between the lethal dose of ozone 41.8 mg O3rl min compared to that needed
Ž .
to kill pathogens 0.2 mg O3rl min and, therefore, O can be used in disease control. It3 is apparent, however, that the practical therapeutic safety margin is narrower than in the
Ž .
laboratory tests and should be elucidated on site Wedemeyer, 1996 . Hence, another concern related to toxicity testing might be the wide variability among individuals. In the present study, inter-individual variation was extensive, which could not be explained by prevailing conditions, culture history or measurement accuracy. One explanation could be genetic susceptibility to O , which has been observed in mammalian studies as3
Ž .
reviewed by Kleeberger 1995 .
Ozone exposure caused a rapid depletion of GSH in whole blood in the 148C group but not in the 108C group. The fact that the GSH concentration was unaltered and GSSG was enhanced in the 108C group caused by ozone exposure suggest that the decrease of GSH at 148C with a concomitant increase in GSSG concentration, was due to enhanced GSH utilisation rather than impaired GSH synthesis. The reason for the markedly higher initial GSH concentrations in blood at 148C in comparison to 108C remain unresolved in this study but one explanation might be linked to higher metabolic activity, since the
Ž
optimum growth temperature for Arctic charr is between 13.78C and 15.18C Lyytikainen
¨
.
et al., 1997 . The finding that initial GSH concentrations in blood and in liver were not equal in different temperature groups but tended to equalise during ozone exposure, raises the question of how temperature can influence the glutathione-dependent antioxi-dant defence system in Arctic charr. The changes in hepatic GSH in the 148C group, low initial levels vs. elevated levels during ozone exposure, are most probably related to temperature-dependent differences in basal concentrations of GSH and the role of liver as a backup GSH generator. In particular, high levels of GSH in tissues correspond to an
Ž .
Hepatic GSH and tGSH concentrations stayed at the same level in the 108C group during ozone exposure revealing no signs of oxidative stress in liver. However, the initial GSH and tGSH concentrations in liver were markedly lower at 148C group but increased to the same level as seen in the 108C group after 15-min ozone exposure. At that point, the increased GSH generation in the 148C group was verified by elevated total GPX activity in comparison to the 108C group. According to our results, it is probable that even 15-min ozone exposure was sufficient to alert liver cells to the environmental changes provoked by ozone. Most likely the information was transmitted
Ž .
in the circulation by H O or organic hydroperoxides ROOH and detected in liver as2 2 increased GPX activity. Total GPX is known to detoxify H O and ROOH produced in2 2
Ž .
lipid peroxidation in fish Peters and Livingstone, 1996 . Since hepatic GSSG was not increased at 108C or 148C concomitantly with GPX activity in ozone exposure and the level of GR was unaltered, it can be assumed that the capacity of glutathione synthesis was not overloaded.
The prevailing temperature might have an essential role on glutathione-dependent enzymes GPX and GR, since they performed different responses in the control groups. It is worth noting that in the current study the highest GR enzyme activities in liver did not
Ž . Ž
occur at the optimum temperature for growth 13.7–15.18C of Arctic charr Lyytikainen
¨
. Ž .
and Jobling, 1999; Lyytikainen et al., 1997 . According to Snegaroff and Bach 1990 ,
¨
the highest EROD activities were observed in rainbow trout at 118C whereas the
Ž .
optimum growth rate can be achieved at 178C Jobling, 1983 . Temperature compensa-tion in Arctic charr should be assessed in future to better understand xenobiotic processes in cold water species.
The effect of ozonation on hepatic GST activity was not consistent. If GST reactions were activated in ozone exposure, elevated levels of GST should be indicative of the activation of GST-dependent xenobiotic metabolism. The results of our study reveal that GST was not recruited in liver during 30-min ozone exposure. It is possible that the exposure time used in the present study was not long enough to elevate hepatic GST. On the other hand, GSH-dependent GST might not be needed to any great extent in the xenobiotic metabolism of ozone.
In the current study, the level of hepatic EROD activity was the same in both temperature groups and it did not show any elevation in response to ozonation. Presumably, protein synthesis in liver will require longer than 30 min since no increase in EROD activity could be detected. However, the basal levels of hepatic EROD activity found in the present study were consistent with the results obtained by Jørgensen et al. Ž1999 . They showed that fasting does not have any effect on hepatic EROD activities in. Arctic charr, but on the other hand, xenobiotics are able to cause considerable induction in CYPA1 activity.
5. Conclusions
during the 30-min exposure. Arctic charr responded to ozonation quickly by activating
Ž .
glutathione-dependent defence system in blood high GSSG level and apparently
Ž .
prepared to support the defence system in liver elevated tGSH and GPX . Interestingly, glutathione levels in blood and liver revealed differences between temperature groups suggesting that ambient temperature might have a notable role in glutathione-dependent antioxidant system. The whole blood GSSG and oxidative stress index were found to be sensitive indicators of oxidative stress evoked by ozone exposure. Future research should evaluate the effects of cumulative O doses on Arctic charr.3
Acknowledgements
This work was financed by the Finnish Graduate-Schools of ‘‘Integrated Aquatic Hazard Assessment’’ and ‘‘Fisheries and Fish Biology’’, Finnish Game and Fisheries
Ž .
Research Institute FGFRI and the Ministry of Agriculture and Forestry. The authors
Ž .
would like to thank Mr. Robert Brons Red Sea Fish pHarming for providing ozonators, Mrs. Tuula Tuhkanen, Mr. Lon Peters and Mr. Ewen McDonald for valuable comments and suggestions. Mrs. Eeva-Liisa Palkispaa and Mrs. Riitta Venalainen are gratefully
¨¨
¨ ¨
acknowledged for technical assistance during sample preparation and analysis.
References
Adams, J.D., Lauterburg, H., Mitchell, J.R., 1983. Plasma glutathione and glutathione disulfide in the rat: regulation and response to oxidative stress. J. Pharmacol. Exp. Ther. 227, 749–754.
Asbury, C., Coler, R., 1980. Toxicity of dissolved ozone to fish eggs and larvae. Journal WPCF 52, 1990–1996.
Bablon, G., Bellamy, W.D., Bourbigot, M.-M., Daniel, F.B., Dore, M., Erb, F., Gordon, G., Langlais, B.,´
Laplanche, A., Legube, Martin, G., Masschelein, W.J., Pacey, G., Reckhow, D.A., Ventresque, C., 1991.
Ž .
Fundamental aspects. In: Langlais, B., Reckhow, D.A., Brink, D.R. Eds. , Ozone in water treatment: application and engineering. Lewis Publishers, Chelsea, MI, pp. 11–132.
Bell, J.G., Cowey, C., 1990. Oxidation of glutathione during hydroperoxide metabolism in isolated
hepato-Ž . Ž .
cytes of rainbow trout Salmo gairdneri . Fish Physiol. Biochem. 8 1 , 11–17.
Boehme, D.S., Hotchkiss, J.A., Henderson, R.F., 1992. Glutathione and GSH-dependent enzymes in broncho-alveolar lavage fluid cells in response to ozone. Exp. Mol. Pathol. 56, 37–48.
Bradford, M.M., 1976. A rapid and sensitive method for the quantitation of microgram quantities of protein utilising the principle of protein–dye binding. Anal. Biochem. 72, 248–254.
Brink, D.R., Langlais, B., Reckhow, D.A., 1991. Introduction. In: Langlais, B., Reckhow, D.A., Brink, D.R.
ŽEds. , Ozone in Water Treatment: Application and Engineering. Lewis Publishers, Chelsea, MI, pp. 1–10..
Bullock, G.L., Summerfelt, S.T., Noble, A.C., Weber, A.L., Durant, M.D., Hankins, J.A., 1997. Ozonation of a recirculating rainbow trout culture system: I. Effects on bacterial gill disease and heterotrophic bacteria. Aquaculture 158, 43–55.
Burke, M.D., Mayer, R.T., 1974. Ethoxyresorufin: direct fluorometric assay of a microsomal O-dealkylation which is preferentially inducible by 3-methylcholanthrene. Drug Metab. Dispos. 2, 583–588.
Ž .
Carlberg, I., Mannervik, B., 1985. Glutathione reductase. In: Meister, A. Ed. , Methods in Enzymology 113 Academic Press, New York, pp. 484–490.
Droge, W., Schulze-Osthoff, K., Mihm, S., Galter, D., Schenk, H., Eck, H.-P., Roth, S., Gmunder, H., 1994.¨ ¨
Functions of glutathione and glutathione disulfide in immunology and immunopathology. FASEB J. 8, 1131–1138.
Ž .
Floche, L., Gunzler, W.A., 1984. Gluthione peroxidase. In: Packer, L. Ed. , Methods in Enzymology 105 Academic Press, New York, pp. 115–121.
Fukunaga, K., Suzuki, T., Arita, M., Suzuki, S., Hara, A., Yamauchi, K., Shinriki, N., Ishizaki, K., Takama, K., 1992a. Acute toxicity of ozone against morphology of gill and erythrocytes of Japanese charr
ŽSalÕelinus leucomaenis . Comp. Biochem. Physiol. 101C, 331–336..
Fukunaga, K., Suzuki, T., Hara, A., Takama, K., 1992b. Effect of ozone on the activites of reactive oxygen
Ž .
scavenging enzymes in RBC of ozone exposed Japanese charr SalÕelinus leucomaenis . Free Radical Res.
Ž .
Commun. 17 5 , 327–333.
Griffith, O.W., 1980. Determination of glutathione and glutathione disulfide using glutathione reductase and 2-vinylpyridine. Anal. Biochem. 106, 207–212.
Habig, W.H., Papst, M.J., Jakoby, W.B., 1974. Glutathione S-transferases. The first enzymatic step in mercapturic acid formation. J. Biol. Chem. 249, 7130–7139.
Hasspieler, B.M., Behar, J.V., Di Giulio, R., 1994. Glutathione dependent defence in channel catfish
ŽIctalurus punctatus and brown bullhead Ameriurus nebulosus . Ecotoxicol. Environ. Saf. 28, 82–90.. Ž .
Jobling, M., 1983. Influence of body weight and temperature on growth rates of Arctic charr, SalÕelinus
Ž .
alpinus L. . J. Fish Biol. 22, 471–475.
Jobling, M., Jørgensen, E.H., Arnesen, A.M., Ringø, E., 1993. Feeding, growth and environmental require-ments of Arctic charr: a review of aquaculture potential. Aquacult. Int. 1, 20–46.
Jørgensen, E.H., Bye, B.E., Jobling, M., 1999. Influence of nutritional status on biomarker responses to PCB
Ž .
in the Arctic Charr SalÕelinus alpinus . Aquat. Toxicol. 44, 233–244.
Kleeberger, S.R., 1995. Genetic susceptibility to ozone exposure. Toxicol. Lett. 82r83, 295–300.
Lemaire, P., Livingstone, D.R., 1993. Pro-oxidantrantioxidant processes and organic xenobiotic interactions in marine organisms, in particular the flounder Platichthys flesus and the mussel Mytilus edulis. Trends Comp. Biochem. Physiol. 1, 1119–1150.
Liltved, H., Hektoen, H., Eframisen, H., 1995. Inactivation of bacterial and viral fish pathogens by ozonation or UV irradiation in water of different salinity. Aquacult. Eng. 14, 107–122.
Lindstrom-Seppa, P., Huuskonen, S., Pesonen, M., Muona, P., Hanninen, O., 1992. Unbleached pulp mill¨ ¨ ¨
effluents affect cytochrome P-450 monooxygenase enzyme activities. Mar. Environ. Res. 34, 157–161. Lyytikainen, T., Jobling, M., 1999. The effect of temperature regime on energy and nitrogen budgets of an¨
Ž .
early juvenile Arctic charr, SalÕelinus alpinus, from lake Lake Inari. Environ. Biol. Fish. 54 2 , 219–227.
Lyytikainen, T., Koskela, J., Rissanen, I., 1997. The influence of temperature on growth and proximate body¨
Ž Ž ..
composition of underyearling Lake Inari arctic char SalÕelinus alpinus L. . J. Appl. Ichthyol. 13,
191–194.
Meister, A., Anderson, M.E., 1983. Glutathione. Annu. Rev. Biochem. 52, 711–760.
Mustafa, M.G., 1990. Biochemical basis of ozone toxicity. Free Radical Biol. Med. 9, 245–260.
Otto, D.M.E., Moon, T.W., 1996b. Endogenous antioxidant systems of two teleost fish, the rainbow trout and the black bullhead, and the effect of age. Fish Physiol. Biochem. 15, 349–358.
Otto, D.M.E., Sen, C.K., Casley, W.L., Moon, T.W., 1996a. Glutathione regulates 3,3X,4,4X-tetrachlorobiphenyl induced cytochrome P-450 metabolism: evidence for a cross-talk between the two major detoxication pathways. Biochem. Mol. Biol. Int. 38, 1127–1133.
Paller, M.H., Heidinger, R.C., 1980. Mechanisms of delayed ozone toxicity to bluegill Lepomis machrochirus
rafinesque. Environ. Pollut. A22, 229–239.
Peters, L.D., Livingstone, D.R., 1996. Antioxidant enzyme activities in embryologic and early larval stages of turbot. J. Fish Biol. 49, 986–997.
Reid, B., Arnold, C.R., 1994. Use of ozone for water treatment in recirculating-water raceway systems. Prog. Fish-Cult. 56, 47–50.
Rice, R.G., 1985. Safe Drinking Water. Lewis Publishers, 275 pp.
Rueter, J., Johnson, R., 1995. The use of ozone to improve solids removal during disinfection. Aquacult. Eng. 14, 123–141.
Snegaroff, J., Bach, J., 1990. The effects of temperature on the basal activity of cytochrome P-450 in rainbow
Ž .
Ž . w
SPSS 1997 , SPSS 7.5 for Windows, Statistics, SPSS, Chicago.
Summerfelt, S.T., Hankins, J.A., Weber, A.L., Durant, M.D., 1997. Ozonation of a recirculating rainbow trout culture system: II. Effects on microscreen filtration and water quality. Aquaculture 158, 57–67. Tietze, F., 1969. Enzymic method for quantitative determination of nanogram amounts of total and oxidised
glutathione: applications to the mammalian blood and other tissues. Anal. Biochem. 27, 502–522.
Ž .
Tuvikene, A., 1995. Responses of fish to polycyclic aromatic hydrocarbons PAHs . Ann. Zool. Fenn. 32, 295–309.
Wedemeyer, G.A., 1996. In: Physiology of Fish in Intensive Culture Systems. Chapman & Hall, New York, pp. 60–110.
Ž
Wedemeyer, G.A., Nelson, N.C., 1977. Survival of two bacterial fish pathogens Aeromonas salmonicida and
.
the Enteric Redmouth Bacterium in ozonated, chlorinated and untreated waters. J. Fish. Res. Board Can. 34, 429–432.
Wedemeyer, G.A., Nelson, N.C., Yasutake, W.T., 1979. Physiological and biochemical aspects of ozone
Ž .
toxicity to Rainbow trout Salmo gairdneri . J. Fish. Res. Board Can. 36, 605–614.
Winston, G.W., Di Giulio, R.T., 1991. Prooxidant and antioxidant mechanisms in aquatic orgnism. Aquat. Toxicol. 24, 143–152.