MULTIDIRECTIONAL BUILDING DETECTION IN AERIAL IMAGES WITHOUT
SHAPE TEMPLATES
Andrea Manno-Kovacsa,band Tamas Sziranyib
a
Pazmany Peter Catholic University, Prater 50/A, 1083, Budapest, Hungary bMTA SZTAKI, Kende 13-17, 1111, Budapest, Hungary
[email protected], [email protected]
KEY WORDS:Directional Classification, Building Detection, Feature Extraction, Aerial Image Detection
ABSTRACT:
The aim of this paper is to exploit orientation information of an urban area for extracting building contours without shape templates. Unlike using shape templates, these given contours describe more variability and reveal the fine details of the building outlines, resulting in a more accurate detection process, which is beneficial for many tasks, like map updating and city planning. According to our assumption, orientation of the closely located buildings is coherent, it is related to the road network, therefore adaptation of this information can lead to more efficient building detection results.
The introduced method first extracts feature points for representing the urban area. Orientation information in the feature point neigh-borhoods is analyzed to define main orientations. Based on orientation information, the urban area is classified into different directional clusters. The edges of the classified building groups are then emphasized with shearlet based edge detection method, which is able to detect edges only in the main directions, resulting in an efficient connectivity map. In the last step, with the fusion of the feature points and connectivity map, building contours are detected with a non-parametric active contour method.
1 INTRODUCTION
Automatic building detection is currently a relevant topic in aerial image analysis, as it can be an efficient tool for accelerating many applications, like urban development analysis, map updating and also means a great support in crisis situations for disaster manage-ment and helps municipalities in long-term residential area plan-ning. These continuously changing, large areas have to be mon-itored periodically to have up-to-date information, which means a big effort when administrated manually. Therefore, automatic processes are really welcomed to facilitate the analysis.
There is a wide range of publications in remote sensing topic for building detection, however we concentrated on the newer ones, which we also used for comparison in the experimental part. State-of-the-art methods can be divided into two main groups. The first group only localizes buildings without giving any shape information, like (Sirmac¸ek and ¨Unsalan, 2009) and (Sirmac¸ek and ¨Unsalan, 2011).
In (Sirmac¸ek and ¨Unsalan, 2009) a SIFT (Lowe, 2004) salient point based approach is introduced for urban area and building detection (denoted by SIFT-graph in the experimental part). This method uses two templates (a light and dark one) for detect-ing builddetect-ings. After extractdetect-ing feature points representdetect-ing build-ings, graph based techniques are used to detect urban area. The given templates help to divide the point set into separate building subsets, then the location is defined. However, in many cases, the buildings cannot be represented by such templates, moreover sometimes it is hard to distinguish them from the background based on the given features.
To compensate the drawbacks and represent the diverse char-acteristics of buildings, the same authors proposed a method in (Sirmac¸ek and ¨Unsalan, 2011) to detect building positions in aerial and satellite images based on Gabor filters (marked as Gabor fil-ters), where different local feature vectors are used to localize buildings with data and decision fusion techniques. Four differ-ent local feature vector extraction methods are proposed to be
used as observations for estimating the probability density func-tion of building locafunc-tions by handling them as joint random vari-ables. Data and decision fusion methods define the final building locations based on the probabilistic framework.
The second group also provides shape information beside loca-tion, but usually applies shape templates (e.g. rectangles), like (Benedek et al., 2012). However, this latter case still just gives an approximation of the real building shape.
A very novel building detection approach is introduced in (Benedek et al., 2012), using a global optimization process, considering ob-served data, prior knowledge and interactions between the neigh-boring building parts (marked later as bMBD). The method uses low-level (like gradient orientation, roof color, shadow, roof ho-mogeneity) features which are then integrated to have object-level features. After having object (building part) candidates, a config-uration energy is defined based on a data term (integrating the object-level features) and a prior term, handling the interactions of neighboring objects and penalizing the overlap between them. The optimization process is then performed by a bi-layer multiple birth and death optimization.
In our previous work (Kovacs and Sziranyi, 2012) we have in-troduced an orientation based method for building detection in unidirectional aerial images regardless of shape, and pointed out that orientation of the buildings is an important feature when de-tecting outlines and this information can help to increase detec-tion accuracy. Neighboring building segments or groups cannot be located arbitrarily, they are situated according to some bigger structure (e. g. the road network), therefore the main orientation of such area can be defined. We have also introduced Modified Harris for Edges and Corners (MHEC) point set in (Kovacs and Sziranyi, 2013) which is able to represent urban areas efficiently.
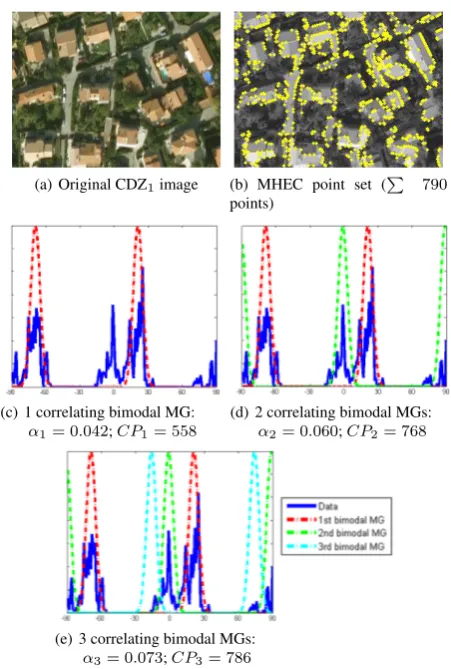
(a) Original CDZ1image (b) MHEC point set (P 790
points)
(c) 1 correlating bimodal MG:
α1= 0.042;CP1= 558
(d) 2 correlating bimodal MGs:
α2= 0.060;CP2= 768
(e) 3 correlating bimodal MGs:
α3= 0.073;CP3= 786
Figure 1: Correlating increasing number of bimodal Mixture of Gaussians (MGs) with theϑorientation density function (marked in blue). The measuredαq andCPq parameters are represented for each step. The third component is found to be insignificant, as it covers only18MHEC points. Therefore the estimated number of main orientations isq=2.
based on the fusion of feature points and connectivity informa-tion, by applying Chan-Vese active contour method (Chan and Vese, 2001).
2 ORIENTATION BASED CLASSIFICATION
MHEC feature point set for urban area detection (Kovacs and Szi-ranyi, 2013) is based on the Harris corner detector (Harris and Stephens, 1988), but adopts a modifiedRmod = max(λ1, λ2) characteristic function, whereλs denote the eigenvalues of the Harris matrix. The advantage of the improved detector is that it is automatic and it is able to recognize not just corners, but edges as well. Thus, it gives an efficient tool for characterizing contour-rich regions, such as urban areas. MHEC feature points are cal-culated as local maxima of theRmodfunction (see Fig.1(b)).
As the point set is showed to be efficient for representing urban areas, orientation information in the close proximity of the fea-ture points is extracted. To confirm the assumption about con-nected orientation feature of closely located buildings, specific images were used in our previous work (Kovacs and Sziranyi, 2012), presenting only small urban areas and having only one main direction. In the present work, we extended the introduced, unidirectional method, to be able to handle bigger urban areas with multiple directions.
(Benedek et al., 2012) used a low level feature, called local gradi-ent origradi-entation density, where the surroundings of a pixel was in-vestigated whether it has perpendicular edges or not. This method was adapted to extract the main orientation information charac-terizing the feature point, based on it’s surroundings. Let us de-note the gradient vector by∇giwithk∇gikmagnitude andϕ∇i orientation for theithpoint. By defining then×nneighborhood of the point withWn(i)(wherendepends on the resolution), the weighted density ofϕ∇
i is as follows:
Now, the main orientation for(ith)feature point is defined as:
ϕi= argmax ϕ∈[−90,+90]
{λi}. (2)
After calculating the direction for all theK feature points, the density functionϑof their orientation is defined:
ϑ(ϕ) = 1
In the unidirectional case, the density functionϑis expected to have two main peaks (because of the perpendicular edges of build-ings), which is measured by correlatingϑto a bimodal density function:
α(m) =
Z
ϑ(ϕ)η2(ϕ, m, dϑ)dϕ, (5)
whereη2(.)is a two-component Mixture of Gaussian (MG), with mandm+ 90mean values anddϑis the standard deviation for both components. The valueθof the maximal correlation can be obtained as:
θ= argmax m∈[−90,+90]
{α(m)}. (6)
And the corresponding orthogonal direction (the other peak):
θortho=
θ−90, ifθ≥0
θ+ 90, otherwise (7)
(a) (b)
(c) (d)
Figure 2: Orientation based classification forq = 2main orien-tations withk-NN algorithm for image 1(a): (a) shows the classi-fied MHEC point set, (b)–(d) is the classiclassi-fied image withk= 3, k = 7andk = 11parameter values. Different colors show the clusters belonging to the bimodal GMs in figure 1(d).
Based on these criteria, the value of theαqparameter and the to-tal number of the Correlated Points (CPq) are investigated when correlating the data toqbimodal MGs.
Figure 1 shows the steps of defining the number of main direc-tions (q). The calculated MHEC points for the image is in Figure 1(b), including altogether790points. The correlating bimodal MGs and the belonging parameters are in Fig. 1(c)-1(e). As one can see, theαqparameter is increasing continuously and theCPq parameter has reached the defined ratio (95%) in the second step (representing768/790≈97%of the point set). The third MG (Fig. 1(e)) is just added for illustrating the behavior of the corre-lation step: althoughαq is still increasing, the newly correlated point set is too small, containing onlyCP3−CP2 = 18points and supposed to be irrelevant. Therefore, the estimated number of main orientation isq= 2, with peaksθ1= 22(θ1,ortho=−68) andθ2= 0(θ2,ortho= 90).
The point set is then classified by K-means algorithm, where K is the number of main orientation peaks (2q) and the distance mea-sure is the difference between the orientation values. After the classification, the ’orthogonal’ clusters (2 peaks belonging to the same bimodal MG component) are merged, resulting inq clus-ters. The clustered point set is in Figure 2(a).
The orientation based classification is then extended to the whole image,k-NN clustering is performed to classify the image pixel-wisely. Classification has been tested with differentkvalues (3,7 and11), Figure 2(b)–(d) show the results respectively, different colors marks the clusters with different orientations. The same color is picked for the correlating bimodal MG-s in Figure 1(d) and for the area belonging to the corresponding cluster in Figure 2. The tests have proved that the classification results are not sensitive to thekparameter, therefore in the further evaluation, a medium value,k= 7was chosen.
The classification map defines the main orientation for each pixel of the image, therefore in the edge detection part, connectivity information in the given direction has to be extracted.
3 SHEARLET BASED CONNECTIVITY MAP EXTRACTION
Now, that the main direction is given for every pixel in the image, edges in the defined direction have to be strengthened. There are different approaches which uses directional information like Canny edge detection (Canny, 1986) using the gradient orienta-tion; or (Perona, 1998) which is based on anisotropic diffusion, but cannot handle the situation of multiple orientations (like cor-ners). Other single orientation methods exist, like (Mester, 2000) and (Bigun et al., 1991), but the main problem with these methods is that they calculate orientation in pixel-level and lose the scal-ing nature of orientation, therefore they cannot be used for edge detection. In the present case, edges constructed by joint pixels has to be enhanced, thus the applied edge detection method has to be able to handle orientation. Moreover, as searching for build-ing contours, the algorithm must handle corner points as well. Shearlet transform (Yi et al., 2009) has been lately introduced for efficient edge detection, as unlike wavelets, shearlets are theoreti-cally optimal in representing images with edges and, in particular, have the ability to fully capture directional and other geometrical features. Therefore, this method is able to emphasize edges only in the given directions (Fig.3(a)).
For an imageu, the shearlet transform is a mapping:
u→SHψu(a, s, x), (8)
providing a directional scale-space decomposition ofuwitha > 0is the scale,sis the orientation andxis the location:
SHψu(a, s, x) =
Z
u(y)ψas(x−y)dy=u∗ψas(x), (9)
whereψas are well localized waveforms at various scales and orientations. When working with a discrete transform, a discrete set of possible orientations is used, for examples = 1, . . . ,16. In the present case, the main orientation(s) of the image θ are calculated, therefore the aim is to strengthen the components in the given directions on different scales as only edges in the main orientations have to be detected. The first step is to define thes subband for image pixel(xi, yi)which includesθiandθi,ortho: weak edges (values) have been eliminated with a hard threshold and only the strong coefficients are amplified.
Finally, the shearlet transform is applied backward (see Eq.9) to get the reconstructed image, which will have strengthened edges in the main directions. The strengthened edges can be easily de-tected by Otsu thresholding (Otsu, 1979). The advantage of ap-plying shearlet method is while the pure Canny method detects the edges sometimes with discontinuities, the shearlet based edge strengthening helps to eliminate this problem and the given result represents connectivity relations efficiently.
We used theu∗
component of the CIEL∗ u∗
vadvised in (Muller and Zaum, 2005), which is also adapted in other state-of-the-art method (Benedek et al., 2012) for efficient building detection. As theu∗
(a) (b) (c)
Figure 3: Steps of multidirectional building detection: (a) is the connectivity map; (b) shows the detected building contours in red; (c): marks the estimated location (center of the outlined area) of the detected buildings, the falsely detected object is marked with a white circle, missed object is marked with a white rectangle.
values in the edge strengthened map (see Figure 3(a)), therefore the extracted map is better to be called as a connectivity map. In case of buildings with altering colour (as gray or brown), only the outlining edges are detected.
4 MULTIDIRECTIONAL BUILDING DETECTION
Initial building locations can be defined by fusing the feature points as vertices (V) and the shearlet based connectivity map as the basis of the edge network (E) of aG = (V, E)graph. To exploit building characteristics for the outline extraction, we have to determine point subsets belonging to the same building. Coherent point subsets are defined based on their connectivity, vi= (xi, yi)andvj= (xj, yj), theithandjthvertices of theV feature point set are connected inE, if they satisfy the following conditions:
1. S(xi,yi)= 1,
2. S(xj,yj)= 1,
3. ∃a finite path betweenviandvjinS.
The result after the connecting procedure is aGgraph composed of many separate subgraphs, where each subgraph indicates a building candidate. However, there might be some singular points and some smaller subgraphs (points and edges connecting them) indicating noise. To discard them, only subgraphs having points over a given threshold are selected.
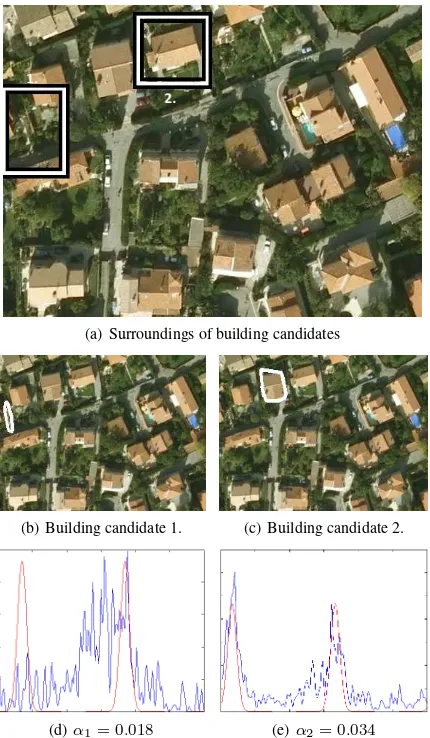
Main directional edge emphasis may also enhance road and vege-tation contours, moreover some feature points can also be located on these edges. To filter out false detections, the directional distri-bution of edges (λi(ϕ)in Eq. 1) is evaluated in the extracted area. False objects, like road parts or vegetation, have unidirectional or randomly oriented edges in the extracted area (see Fig. 4(b) and 4(d)), unlike buildings, which have orthogonal edges (Fig. 4(c) and 4(e)). Thus, the non-orthogonal hits are eliminated with a decision step.
Finally, contours of the subgraph-represented buildings are cal-culated by region-based Chan-Vese active contour method (Chan and Vese, 2001), where the initialization of the snake is given as the convex hull of the coherent point subset.
A typical detection result is shown in Figure 3(b) with the build-ing outlines in red. In the experimental part, the method was evaluated quantitatively and compared to other state-of-the-art processes. In this case the location of the detected buildings was used, which is estimated as the centroid of the given contours (see Figure 3(c)).
(a) Surroundings of building candidates
(b) Building candidate 1. (c) Building candidate 2.
(d)α1= 0.018 (e)α2= 0.034
Figure 4: Elimination of false detection based on directional dis-tribution of edges in the extracted area: 1. area is a false detection, 2. area is a building. (b)-(c): Extracted areas by the graph-based connection process. (d)-(e): The calculatedλi(ϕ)directional dis-tribution and the resultingαvalues of the area.
5 EXPERIMENTS
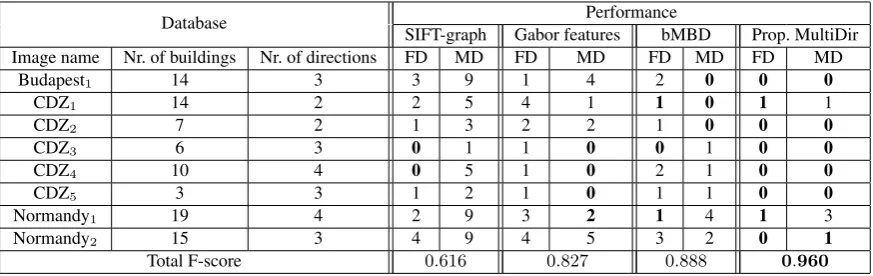
Database Performance
SIFT-graph Gabor features bMBD Prop. MultiDir
Image name Nr. of buildings Nr. of directions FD MD FD MD FD MD FD MD
Budapest1 14 3 3 9 1 4 2 0 0 0
Table 1: Quantitative results on different databases. The performance of SIFT-graph (Sirmac¸ek and ¨Unsalan, 2009), Gabor features (Sirmac¸ek and ¨Unsalan, 2011), bMBD (Benedek et al., 2012) and the proposed multidirectional (MultiDir) methods are compared. Nr. of buildings indicates the number of completely visible, whole buildings in the image. FD and MD denote the number of False and Missed Detections (false positives and false negatives).Bestresults in every row are marked in bold.
1, where the number of detected buildings were compared based on the estimated location (Fig. 3(c)). The overall performance of different techniques was measured by the F-measure:
P = TD
where TD, FD and MD denote the number of true detections (true positive), false detections (false positive) and missed detections (false negative) respectively.
Results showed that the proposed multidirectional method ob-tains the highest detection accuracy when evaluating the object level performance. Further tests are needed to compare the pixel level performance. By analyzing the results, we have pointed out, that the proposed method has difficulties when detecting build-ings with altering colors (like gray or brown roofs). However, orientation sensitive edge strengthening is able to partly compen-sate this drawback. Sometimes, the closely located buildings are contracted and treated as the same object (see Figure 3). The method may also suffer from the lack of contrast difference be-tween the building and the background and it is not able to detect the proper contours.
6 CONCLUSION
We have proposed a novel, orientation based approach for build-ing detection in aerial images without usbuild-ing any shape templates. The method first calculates feature points with the Modified Har-ris for Edges and Corners (MHEC) detector, introduced in our earlier work. Main orientation in the close proximity of the fea-ture points is extracted by analyzing the local gradient orienta-tion density. Orientaorienta-tion density funcorienta-tion is defined by process-ing the orientation information of all feature points, and the main peaks defining the prominent directions are determined by bi-modal Gaussian fitting. Based on the main orientations, the ur-ban area is classified into different directional clusters. Edges with the orientation of the classified urban area are emphasized with shearlet based edge detection method, resulting in an effi-cient connectivity map. The feature point set and the connectiv-ity map is fused in the last step, to get the initial allocation of the buildings and perform an iterative contour detection with a non-parametric active contour method.
The proposed model is able to enhance the detection accuracy on object level performance, however still suffering of typical chal-lenges (altering building colors and low contrasted outlines). In our further work, we will focus on the analysis of different color spaces, to represent altering building colors more efficiently and
enhance detection results by reducing the number of missed de-tections. Application of prior constraints (like edge parts running in the defined main orientations) may help in the detection of low contrasted building contours.
REFERENCES
Benedek, C., Descombes, X. and Zerubia, J., 2012. Building development monitoring in multitemporal remotely sensed image pairs with stochastic birth-death dynamics. IEEE Trans. Pattern Analysis and Machine Intelligence 34(1), pp. 33–50.
Bigun, J., Granlund, G. H. and Wiklund, J., 1991. Multidimen-sional orientation estimation with applications to texture analysis and optical flow. IEEE Trans. Pattern Analysis and Machine In-telligence 13(8), pp. 775–790.
Canny, J., 1986. A computational approach to edge detection. IEEE Trans. Pattern Analysis and Machine Intelligence 8(6), pp. 679–698.
Chan, T. F. and Vese, L. A., 2001. Active contours without edges. IEEE Trans. Image Processing 10(2), pp. 266–277.
Harris, C. and Stephens, M., 1988. A combined corner and edge detector. In: Proceedings of the 4th Alvey VisionConference, pp. 147–151.
Kovacs, A. and Sziranyi, T., 2012. Orientation based building outline extraction in aerial images. In: ISPRS Annals of Pho-togrammetry, Remote Sensing and the Spatial Information Sci-ences (Proc. ISPRS Congress), Vol. I-7, Melbourne, Australia, pp. 141–146.
Kovacs, A. and Sziranyi, T., 2013. Improved Harris feature point set for orientation sensitive urban area detection in aerial images. IEEE Geoscience and Remote Sensing Letters 10(4), pp. 796– 800.
Lowe, D. G., 2004. Distinctive image features from scale-invariant keypoints. International Journal of Computer Vision 60, pp. 91–110.
Mester, R., 2000. Orientation estimation: Conventional tech-niques and a new non-differential approach. In: Proc. 10th Euro-pean Signal Processing Conference.
Muller, S. and Zaum, D., 2005. Robust building detection in aerial images. In: CMRT, Vienna, Austria, pp. 143–148.
Perona, P., 1998. Orientation diffusion. IEEE Trans. Image Pro-cessing 7(3), pp. 457–467.
Sirmac¸ek, B. and ¨Unsalan, C., 2009. Urban-area and building detection using SIFT keypoints and graph theory. IEEE Trans. Geoscience and Remote Sensing 47(4), pp. 1156–1167.
Sirmac¸ek, B. and ¨Unsalan, C., 2011. A probabilistic framework to detect buildings in aerial and satellite images. IEEE Trans. Geoscience and Remote Sensing 49(1), pp. 211–221.