REVEALING THE SECRETS OF STONEHENGE THROUGH THE APPLICATION OF
LASER SCANNING, PHOTOGRAMMETRY AND VISUALISATION TECHNIQUES
P.G. Bryana *, M. Abbott b, A.J. Dodson c
a
English Heritage, 37 Tanner Row, York YO1 6WP, UK –
[email protected]
bArcHeritage, 54 Campo Lane, Sheffield, S1 2EG, UK -
[email protected]
c
Greenhatch Group Ltd, Duffield Road, Little Eaton, Derby, DE21 5DR, UK - a
[email protected]
*Corresponding author
Commission V, Working Group V/2
KEY WORDS: Laser Scanning, Photogrammetry, Surveying, Visualisation, Cultural Heritage, Archaeology
ABSTRACT:
Stonehenge is perhaps the most famous prehistoric monument in the world. Begun as a simple earthwork enclosure, it was built in several stages with the unique lintelled stone circle being erected in the Neolithic period in around 2,500 BC. Today Stonehenge, together with Avebury and other associated sites, form the heart of a World Heritage Site (WHS) with a unique and dense concentration of outstanding prehistoric monuments. In 2011 English Heritage (EH) embarked on a new survey of the monument. Undertaken by the Greenhatch Group, a commercial survey company based near Derby, a combination of laser scanning and photogrammetric approaches were used to generate the required scale and detailed level of output required by English Heritage. This paper will describe the background to this project and its context within previous survey activities at this World Heritage Site. It will explain the data acquisition technology and processes undertaken on site, the datasets derived from post-processing and their filtering and analysis within both subsequent research projects. Alongside a description of how the data is currently being exploited and proposed future applications within the conservation and management of the site, it will finish by considering the impact of developing geospatial imaging technologies.
1. INTRODUCTION
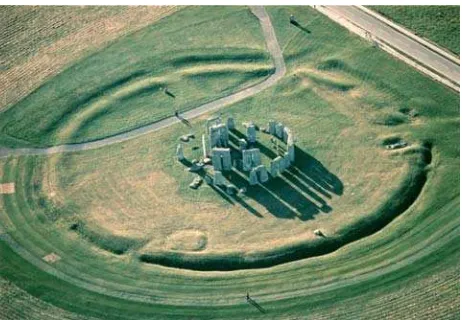
Stonehenge is perhaps the most famous prehistoric monument in the world (Figure 1).
Figure 1 The site of Stonehenge viewed from the air (Image by Damian Grady, 1504122 © English Heritage)
Begun as a simple earthwork enclosure, it was built in several stages with the unique lintelled stone circle being erected in the Neolithic period around 2,500 BC (Bryan, 2011). Inscribed as a World Heritage Site (WHS) in 1986 for its outstanding prehistoric monuments, the Stonehenge part of the WHS covers 2,600 hectares and is managed by several landowners including English Heritage (EH) and the National Trust.
1.1 Existing survey
A wide variety of survey material already exists for the site held within the English Heritage Archive (EHA), located 56 km north in Swindon. This includes aerial and terrestrial
photography, topographic and elevational survey all stored within the Historic Plans Room and accessible to both internal staff and the general public through EH’s Enquiry & Research Services team. The last detailed survey of the monument was undertaken using photogrammetry in 1993 by the York-based Photogrammetric Unit. Film-based stereo-photography captured on site, controlled by theodolite observations to multiple fixed targets, was processed using the Leica Helava Digital Photogrammetric Workstation to provide three dimensional surface models for each of the stones at a resolution of 2cm (Bryan et al, 1997). Laser scanning had only previously been applied on a trial basis at the site such as that undertaken by Wessex Archaeology and Archaeoptics in 2002/2003 (Goskar et al, 2003). Using a Minolta VI-900 structured light scanner, surface data to 0.5mm resolution was captured for three stones and, using a combination of visualisation techniques, new carving information revealed. Although only applied to a fraction of the monument this still highlighted the great potential of applying modern scanning systems across all the standing and fallen stones that comprise Stonehenge.
1.2 Stonehenge Landscape Survey
display and presentational opportunities. Therefore as both initiatives set to benefit substantially from more detailed information being collected, a new survey of Stonehenge was agreed. This would be funded and commissioned through the English Heritage National Heritage Protection Commissions Programme (NHPCP) and would need to compliment and overlap with the existing datasets, including aerial lidar and GPS landscape survey, already being used by each project team.
2. SPECIFICATION AND METHODOLOGY
Following consultation in 2010 with both the Stonehenge Landscape Survey and Visitor Centre project teams it was proposed to carry out a new, detailed survey during 2011 of both the stones that comprise the henge and the area of landscape immediately surrounding them known as ‘the Triangle’ (Figure 2).
Figure 2 Extent of survey within ‘The Triangle’ (Image supplied through Pan Government Agreement)
However as the landscape, stone circle and individual stone surfaces all posed different challenges to survey and each required different data resolutions capturing, this was further divided into three component areas:
Topographic landscape - 10cm resolution
Stone circle and surrounding ‘bank and ditch’ - 2cm for the landscape and 1mm for the stones
Individual stone surfaces - 0.5mm resolution
2.1 Specification
All the requirements of the survey, including the need for an initial archaeological assessment of the data, were collated into a survey brief based upon the English Heritage Metric Survey Specifications for Cultural Heritage (Andrews et al, 2009). Being performance-based, this concentrates on the accuracy and resolution of the required outputs rather than stipulating which methodology and survey technologies should be considered. However for this survey it was assumed a combination of terrestrial laser scanners and appropriate data processing techniques would be used. Following tendering by the NHPCP team and analysis of the received submissions, the survey was commissioned to Greenhatch Group Ltd, based near Derby, who proposed working in partnership with Atkins Geospatial Mapping & Analysis and Archaeo-Environment Ltd.
2.2 Methodology
Although the submission from Greenhatch was principally based on laser scanning it did propose a range of modern laser scanning systems, each with varying range and accuracy
specifications, that alongside complimentary technologies would satisfy the requirements of the specification.
Leica C10 ‘time-of-flight’ laser scanner – to be used to survey ‘the Triangle’ and ‘bank and ditch’ due to its capture range of 300m and point cloud data quality on landscape based features
Z+F 5006h ‘phase-based’ laser scanner equipped with Z+F M-Cam (motorised camera) - to be used to record the stone circle and automatically provide fully calibrated and colourised point cloud data
Nikon D3x 24.5mp DSLR equipped with calibrated 28mm & 50mm Nikon lenses – to provide complimentary high resolution colour digital imagery covering every stone face
Z+F Imager 5010 ‘phase-based’ laser scanner – to be used to record the individual stone surfaces.
At the time of the survey the Z+F 5010 was the very latest in terrestrial laser scanning technology having just been released to the market at Intergeo in Cologne during October 2010. Although this original version did not possess any internal imaging sensor the specified range noise over a 10m distance was less than 0.5 mm rms making it suitable for close-range scanning of the stones. However to ensure the required performance of data was generated Greenhatch proposed:
using the scanner over a range no greater than 7.5m from each stone surface
using a ‘stereo-scan’ approach to maximise the depth of field to each face (Dodson et al, 2011).
using a minimum of 4 registration targets per scan, co-ordinated using a 0.5 second Leica TS30 Total Station to achieve an overall survey accuracy over the 1.2km network in excess of 1in 1,600,000.
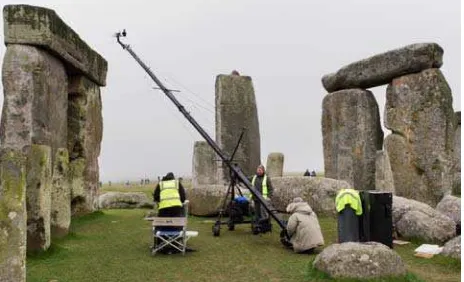
It was recognised that some sections of the monument, such as the upper faces of the trilithon lintels, would prove difficult to survey by laser scanning. Although scanners have been used on telescopic poles and hydraulic masts, they require significant bracing to eliminate movement of the scanning head when working at extended heights or within exposed locations, such as the open countryside around Stonehenge on Salisbury Plain.
Figure 3 Use of ‘Jimmy Jib’ to capture stereo-photography of upper surfaces (Image by James Davies © English Heritage)
would be processed using the automated pixel-correlation algorithms within Photomodeler Scanner to provide the required resolution surface data on each upper facing stone.
3. SITE SURVEY
The survey commenced on site on 22nd February 2011 and was due to take four weeks to complete (Figure 4).
Figure 4 – Laser scanning Stonehenge using the Leica C10 and Z+F 5010 (Images by James Davies © English Heritage)
However given Stonehenge is the most visited English Heritage property its immense popularity did provide additional logistical challenges for the surveyors. These included maintaining public access to the site and restricting survey within the stone circle to outside public opening hours alongside contending with the uncertainties of the British weather. Even with these problems to overcome, the Greenhatch team still managed to complete the site survey work on time and as per their agreed four week programme.
4. PROCESSING AND INITIAL ANALYSIS
Following capture of the scan data and accompanying imagery on site, the data was processed by the team from Greenhatch over a period of three months. Using a combination of Leica Geosystems Cyclone and Geomagic Studio the following deliverables were provided to English Heritage:
Raw and registered scan data provided in both proprietary ZFS and non-proprietary XYZ (ASCII) formats
Meshed 3D models provided in OBJ format (Figure 5) in both textured and untextured forms for:
o ‘the Triangle’ landscape at 10cm resolution o the bank and ditch landscape at 2cm resolution o the standing and fallen stones at 1mm resolution o individual stone surfaces at 0.5mm resolution
‘TruView’ versions of the scan data to enable viewing in Leica Geosystems web-enabled point cloud viewer that allows viewing, measuring and mark-up of laser scan data
4.1 Initial Archaeological Assessment
An initial archaeological assessment of the data was undertaken by Caroline Hardie from Archaeo-Environment Ltd. By importing each 3D model into Meshlab she was able to view and analyse each stone surface using a variety of texture colours, finishes and ‘virtual’ lighting conditions. Although file sizes for the higher resolution data limited their application on her standard desktop computer, this initial summary still
highlighted scope for increasing knowledge on the working and dressing of the stones as well as potential for revealing new carvings (Hardie, 2011).
Figure 5 - Meshed 3D models for stones 53 & 54 with the addition of colourised point cloud data overlay
5. DETAILED ANALYSIS OF DATA
Since receiving the complete dataset at the end of May 2011, English Heritage has commenced applying it across the conservation, presentation and management areas of Stonehenge World Heritage Site. It also recognised its immense research potential by commissioning two new research projects aimed at enhancing our knowledge of the monument.
5.1 Digital Filtering of lichen
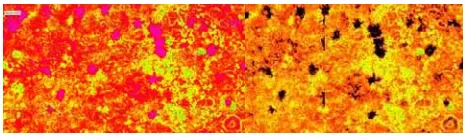
The stones at Stonehenge are extensively covered by numerous species of lichen (Bryan, 2012). During the last survey in 2003, 77 species were recorded which can be divided into three forms – fruticose (shrubby, plant-like structure), foliose (flatter, leaf-like appearance) and crustose (forming a flat ‘mosaic’ over the surface). Due to their typically dense nature all provide a natural barrier to viewing the surface hidden beneath. A research project was therefore developed that aimed to use the high resolution scan data acquired in 2011, that provided laser intensity and RGB values for the majority of captured 3D points, to digitally filter out the lichens from the existing scans.
Figure 6 Intensity values for the fruticose lichen on stone 29 (pink areas) digitally removed from the scan (black areas)
subtle distinction between intensities for both lichen and stone that introduced a delicate balance when user-selecting an appropriate range of values for testing. However both showed promise in helping to reveal hidden archaeological information so further work on both filters is needed alongside potential use of close-range and wave-form digitising scanning technology.
5.2 Detailed archaeological analysis
Following on from the initial archaeological assessment a second research project was developed that would look in greater detail at the datasets acquired in 2011 and report against four key research questions:
1. what methods were employed in building Stonehenge and how were the stones shaped?
2. what prehistoric carvings survive on the stones?
3. what later alterations and graffiti were added to the stones? 4. what was the architectural sequence at Stonehenge?
In addition a detailed stone ‘biography’, catalogue of graffiti/carvings and digital graphical record would be generated that would aid both current and future conservation, management and presentation work across the site. Once again the work was funded and formally tendered through NHPCP and subsequently awarded to ArcHeritage, the Sheffield based archaeological and heritage practice.
5.2.1 Visualisation and analysis of data
Following supply of the scan dataset in May 2012, the ArcHeritage team set about assessing it over the following four months using a range of visualisation and analysis methods.
Visualising the stones in a 3D environment – creation of visual template in Cinema 4D R13 and generation of five ortho-rectified, high definition views of each 1mm dataset
Analysing the 1mm mesh data - experimentation with textures, lighting and shadow decay values to define the best combination for surface feature identification.
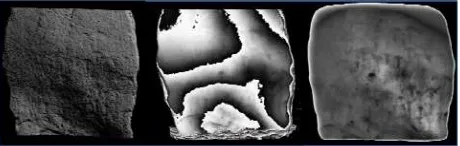
Analysing the 0.5mm mesh data – use of PTM and other Multi-Light Imaging techniques (Duffy et al, 2013) to analyse the interaction of light and shadow across each stone surface (Figure 7a)
Analysing the point cloud data – using the plane shading function in Bentley Pointools to apply greyscale values to XYZ data points to reveal changes in surface topography (Figure 7b)
Analysing luminance values of 0.5mm data – using custom shader tool developed by ArcHeritage to adjust luminance channel of material applied to each 3D mesh (Figure 7c).
Figure 7 a) PTM, b) Plane-shading and c) Luminance Lensing image highlighting the fine surface detailing on Stone 4
5.2.2 Results
The results of the detailed archaeological analysis of the laser scan data have exceeded all expectation and successfully ad-dressed all four key research questions. Significant differences have been revealed in how the stones were shaped and how
their surface dressing varied depending on their position within the monument. Stones along the solstitial axis received most care during construction to provide a more dramatic passage of sunlight through the stone circle on the midsummer and midwinter solstices. Although it has long been considered that most signs of dressing and prehistoric carvings had weathered beyond recognition, 71 new axe-heads have been revealed raising the total number from 44 to 115 and doubling the number of Early Bronze Age axe-head carvings known in Britain (Abbott et al, 2012).
6. APPLICATIONS FOR DATA
Following delivery in September 2012 of the detailed archaeological report and all related outputs (stone ‘biography’, graffiti/carvings catalogue and digital graphical record), English Heritage has set about exploiting the complete dataset, including scan data, across conservation and management activities at Stonehenge. As well as significantly expanding our historical knowledge of the monument, the survey provides a detailed record of current condition and lichen growth thereby providing the basis for long-term condition monitoring of the monument fabric. The scan dataset, including meshed 3D models, is currently being used within the development of new interpretive material, audio-visual content and CGI displays for the new Stonehenge visitor centre.
Figure 8 Proposed design for new Stonehenge visitor centre
Located at Airman's Corner, 2.5 km to the west of the stones, work is nearing completion to construct a new visitor centre by the end of 2013 equipped with interpretation and education space, galleries, café and a new car park. Alongside future development of a range of Stonehenge ‘apps’ and potential release of the laser scan data in 2014 for third party exploitation and research, it is hoped this major development of the site will provide a significantly enhanced visitor ‘experience’ for this world famous World Heritage Site.
7. ALTERNATIVE GEOSPATIAL IMAGING
TECHNOLOGIES
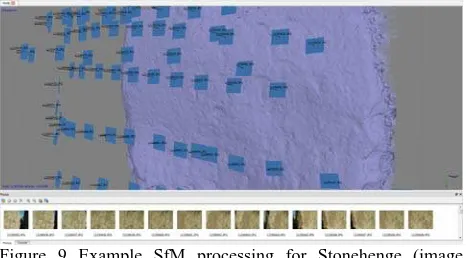
Figure 9 Example SfM processing for Stonehenge (image courtesy of Marcus Abbott, ArcHeritage)
Once imagery is captured low-cost (<€200) e.g Agisoft Photoscan and Autodesk ReCap or open-source software e.g Bundler, can be used to generate 3D point clouds and meshed surface models. Being reliant on surface texture appearing across all images they are not appropriate for all heritage subjects. However for sites like Stonehenge, where the stones display highly textured surfaces, they look extremely promising for extracting point cloud and mesh data at closer macro-scales, greater resolutions and cheaper costs than laser scanning (Figure 9).
8. CONCLUSIONS
This project has successfully demonstrated that current laser scanning technologies and appropriate methodologies can be used to record WHS monuments such as Stonehenge. Spanning three years, from initial project proposal through to completion, the range of datasets collected and post-processed outputs generated have all proved to have multiple applications beyond original project aims and objectives. It has also shown that the acquired datasets can contain additional digital information whose value may be ‘unlocked’ through the use of cutting-edge analytical and visualisation tools. However it is obvious that alongside developments in laser scanning, the resurgence of photogrammetry and the increased application of multi-image, Structure-from-Motion approaches are also worthy of consideration in similar future projects as they may generate comparable datasets to laser scanning at a much lower cost. Therefore although such projects take time to complete and significant funding allocating, incorporating modern technological advancements in survey within a sound research strategy can help towards justifying their commitment, expenditure and application.
9. ACKNOWEDLEGEMENTS
The laser scan survey of Stonehenge and both associated research projects were funded through the English Heritage National Heritage Protection Commissions Programme (NHPCP).
The authors would like to thank all EH staff involved in the development, commissioning and fulfilment of this project in particular David Field, Mark Bowden, Susan Greaney, David Batchelor, Barney Sloane, Tim Cromack and Paul Backhouse. Special thanks also go to the teams from Greenhatch Group, Atkins Mapping Solutions, Leica Geosystems, Z+F UK, Archaeo-Environment Ltd, CyArk and ArcHeritage for their invaluable contribution throughout the project.
10. REFERENCES
Bryan, P. G., Surveying Stonehenge Part One, Geomatics World. Issue No 1, Volume 20, November/December 2011
Bryan, P. G., Clowes, M., Surveying Stonehenge by Photogrammetry, Photogrammetric Record 15 (89), April 1997
Goskar, T et al, Stonehenge Laser Scans, An application of laser scanners in archaeology, www.stonehengelaserscan.org Field, D et al, Stonehenge World Heritage Site Landscape Project Archaeological Survey Report, Research Dept Report Series 109 (2010)
Andrews, D., Bryan, P., Blake, B., Bedford J., Metric Survey Specifications for Cultural Heritage, English Heritage, 2009
Dodson, A.J., Hope, C.D., 3D Laser Scan Survey Of Stonehenge, Wiltshire, ISPRS WGV/2 Conference, York 2011
Hardie, C, Archaeological Assessment of 3D Laser scanning of Stonehenge, Report for English Heritage, June 2011
Bryan, P. G., Analysing the Stones, Geomatics World. Issue No 1, Volume 21, November/December 2012
Barton, J., Lee, E., Stonehenge laser scan: filtering the data (project number 6456), End-of-Project Report for English Heritage, May 2012
Duffy, S. Bryan, P., Multi-Light Imaging Techniques for Heritage Application, English Heritage, 2013