1. INTRODUCTION
Soil moisture is the water that is held in the spaces between soil particles. Surface soil moisture is one of the key variables in controlling the exchange of water and heat energy between land surface and atmosphere through evaporation and plant transpiration (Betts et al., 1996; Clark and Arritt, 1995).It is widely recognised as a key parameter in numerous environmental studies, including meteorology, hydrology, agriculture and climate change(Walker, 1999). As a result of the heterogeneity of soil properties, topography, land cover, evapotranspiration and precipitation, soil moisture, however, is highly variable both spatially and temporally (Engman, 1991; Wood et al., 1992; Walker, 1999). Soil moisture plays an important role in the development of weather patterns and the production of precipitation (Fennessey and Shukla, 1999). Accurate and reliable soil moisture estimates have important implications for drought monitoring (Wang, 2007).Direct observations of soil moisture are currently restricted to discrete measurements at specific locations, and such point-based measurements do not reveal large-scale soil moisture and are therefore inadequate to carry out regional and global studies. Satellite remote sensing offers a means of measuring soil moisture across a wide area continuously over time (Engman,1990), while techniques in the microwave and optical/IR frequency regimes have attracted more attention (Chauhan, 2003).
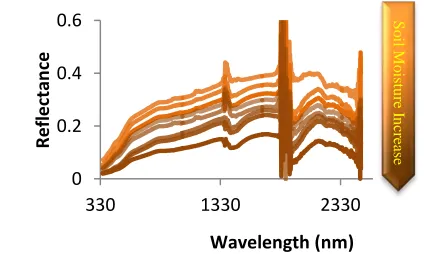
However, current microwave technology limits the spatial resolution of soil moisture data. Optical/IR techniques can provide fine spatial resolution for soil moisture estimation (Idso et al., 1975). Optical/IR techniques for estimating soil moisture based on the relationship between the optical reflectivity of the surface soil and moisture content in the wavelength between 0.4 to 2.5 microns. Figure 1 shows spectral measurements has been measured with ASD spectroradiometer that with increasing soil moisture, its Spectral Reflectance curve in the spectral range between 0.4 to 2.5 microns be reduced.
.
Fig. 1 Spectral Reflectance curve of Soil (that is measured with ASD spectroradiometer)
SOIL MOISTURE USING IN SITU SPECTRAL MEASURMENTS
Mohammad Reza Mobasheria, , Nabi Gholami Bidkhani b
a
Associated Professor of Remote Sensing, Dept. of Geomatic Engineering, KNToosi University of Technology,
Tehran, Iran - Email: [email protected]
b
PhD Student of Remote Sensing, Dept. of Geomatic Engineering, KNToosi University of Technology, Tehran, Iran - Email: [email protected]
KEY WORDS:Spectroradiometry, Soil Moisture, Angle Index, Correlation analysis
ABSTRACT:
Near-surface soil moisture is one of the crucial variables in hydrological processes, which influences the exchange of water and energy fluxes at the land surface/atmosphere interface. Accurate estimate of the spatial and temporal variations of soil moisture is critical for numerous environmental studies. On the other hand, information of distributed soil moisture at large scale with reasonable spatial and temporal resolution is required for improving climatic and hydrologic modeling and prediction. The advent of hyperspectral imagery has allowed examination of continuous spectra not possible with isolated bands in multispectral imagery. In addition to high spectral resolution for individual band analyses, the contiguous narrow bands show characteristics of related absorption features, such as effects of strong absorptions on the band depths of adjacent absorptions. Our objective in this study was to develop a new spectral angle index to estimate soil moisture based on spectral region (350 and 2500 nm).In this paper, using spectral observations made by ASD Spectroradiometer for predicting soil moisture content, two soil indices were also investigated involving the Perpendicular Drought Index (PDI), NMDI (Normalized Multi-band Drought Index) indices. Correlation and regression analysis showed a high relationship between PDI and the soil moisture percent (R2 = 0.9537) and NMDI (R2 = 0.9335). Furthermore, we also simulated these data according to the spectral range of some sensors such as MODIS, ASTER, ALI and ETM+. Indices relevant these sensors have high correlation with soil moisture data. Finally, we proposed a new angle index which shows significant relationship between new angle index and the soil moisture percentages (R2 = 0.9432).angle index relevant bands 3,4,5,6,7 MODIS also showing high accuracy in estimation of soil moisture (R2 = 0.719).
1.1 SOIL INDICES
In this study, two common soil indices, NMDI and PDI, were used to estimate soil moisture.
1.1.1 NMDI (Normalized Drought Multi-band Index)
The normalized multi-band drought index (NMDI), has been proposed recently by Wang (2007) for remote sensing of both soil and vegetation water content from space.. Based on the soil and vegetation spectral signatures, the Normalized Multi-band Drought Index (NMDI) is proposed by using three wavelengths, one in the NIR centered approximately at 860 nm, and two in the SWIR centered at 1640 nm and 2130 nm, respectively. NMDI is defined as:
(1)
where R860nm, R1640nm and R2130nm are the apparent reflectances observed by a satellite sensor in the 860 nm, 1640 nm and 2130 nm bands, respectively. this index uses the channel centered at 860 nm, which is insensitive to leaf water content changes as the reference; however, instead of using a single liquid water absorption band, it uses the difference (slope) between two liquid water absorption bands (1640 nm and 2130 nm), as the soil and vegetation water sensitive band. Strong differences between two water absorption bands in response to soil and leaf water content give this combination potential to estimate water content for both soil and vegetations.
For the dry bare soil, the difference between bands 1640nm and 2130nm is relatively small, which gives high NMDI values, while for the wet bare soil the difference becomes large, giving low NMDI values(Wang, 2007).
Fig. 2 shows that, the slope between bands 1640 nm and 2130 nm increases with increasing soil moisture. This slope changes gives useful information about soil moisture contents.
Fig. 2 Spectral Reflectance curve of Soil (slope variation between bands 1640 nm and 2130 nm)
1.1.2 PDI (Perpendicular Drought Index)
Perpendicular Drought Index (PDI) was proposed by Gulam et al for soil moisture monitoring in 2007.In the Red to NIR spectral domain, the reflectance of bare soil is high, but increases slowly. However, due to the strong absorption characteristics of water, bare soil reflectance decreases noticeably with increasing soil moisture, especially in the NIR region.
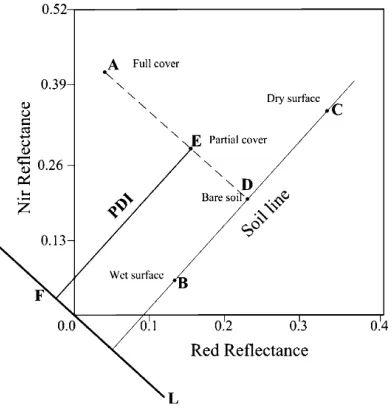
For a specific soil type, the soil line can be regarded as the plot that characterizes the spectral behavior of nonvegetated pixels and whose moisture content varies noticeably. It is not difficult to see from Fig. 3 that the drought severity gradually rises from B to C and reaches its climax at C. Here, BC represents the soil line of the research area. A line L, which dissects the coordinate origin and is vertical to the soil line, may serve as a reference to determine how dry the pixel is. For a bare soil, the distance from any point in the NIR-Red spectral space to line L represents the drought severity of a non-vegetated surface. With the increasing amount of vegetation, the plots shift upward along the direction vertical to the soil line, while they do the same along the direction parallel to the soil line and orthogonal to normal line L with decreasing soil moisture. For a vegetated surface, the distance from L to any point in the NIR-Red spectral space may indicate the drought severity of a mixed pixel. That is, the farther the distance, the stronger the drought and the lower the soil moisture or vice versa. Therefore, for a random, mixed pixel E (RRed, RNIR) in the NIR-Red spectral space, the vertical distance from E (RRed, RNIR) to line L (PDI) can be written as the following:
(2)
Here, RRed and RNIR refer to the atmospherically corrected reflectance of the Red and NIR bands, respectively, while M refers the slope of the soil line.
Fig. 3 Sketch map of PDI (Gulam et al, 2007)
2. METHODS
content (%) and collected Spectral measurements. The spectral measurements have been carried out using an ASD Spectroradiometer at clear sky condition. After observations, the soil samples was dried in the oven and weighted moisture (%) equivalent the samples was calculated. Fig. 4 shows water vapor absorption bands were removed. The soil line as shown in Figure (5) was drawn in the RED – NIR spectral space which is used for PDI index calculation.
Fig. 4 Spectral reflectance curve (removal of water vapor absorption bands)
Fig. 5 Soil line
Spectral reflectance data were imported into MATLAB 7 software. PDI, NMDI indexes and a new Angle index were calculated. In addition to, these data were simulated according to the spectral range of conventional multispectral sensors such as MODIS, ASTER, ETM+ and ALI. PDI and NMDI indexes also were calculated for these sensors. Finally, regression and correlation analyseswere performed at the Excel2010 software.
2.1 Calculation of PDI and NMDI indexes
In this study, PDI and NMDI indexes were calculated at first and relationship between these indexes and soil moisture was modeled. Among the 45 samples, 30 samples have been used for modeling and 15 samples for the validation of the model. Fig. 6 shows relationship between each index and soil moisture (%). Both indexes show a high correlation with soil moisture content. NMDI has high correlation coefficient (96%) and PDI (97%). Fig. 7 shows RMSE and R2 value for both indexes for soil moisture estimation. Results show that both PDI and NMDI index have the lowest RMSE (PDI about 3% and NMDI about 2%).
On the other hand, these two indexes have higher efficiency to estimate soil moisture especially for bare soil or weakly vegetated area and can be used with high confidence in the linear model of soil moisture estimation.
Fig. 6 Soil moisture modeling with NMDI and PDI
( b ) ( a )
Fig. 7 Relationship between Estimated soil moisture with PDI (a) and NMDI(b) and Observed soil moisture(test samples)
2.2 PDI and NMDI indexes based on conventional sensors
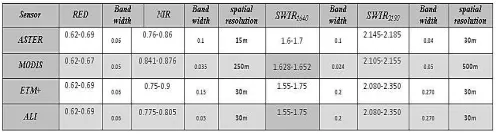
If there is the possibility of more accurate atmospheric correction modeling; from the theoretical point of view it can be argued that the spectrum recorded by the sensor is the result of applying a weighted averaging equivalent to the spectral response curve of each band in the continuous spectrum of surface objects. In this case, each sensor based on the its spectral range (spectral resolution), takes different samples from the spectrum. Thus, calculated soil moisture indexes from different sensors will be achieved from different spectral averaging. Assuming that different soils have relatively similar spectral reflectance. In this section, we evaluate the relationship between these two indexes (that have estimated from simulated spectrum equivalent to FWHM1 of bands of conventional multispectral sensors) with soil moisture content (%). Table (1), shows FWHM of red, near-infrared and two short wave near-infrared (1640 and 2130 nm) bands for conventional sensors with their spatial resolution.
Table1. FWHM of RED, NIR, SWIR1640and SWIR2130 bands for
conventional sensors with their spatial resolution.
1
Fig. 8, 9 show relationship between soil moisture indexes (that calculated for MODIS, ASTER, ALI and ETM+) and moisture content (%). These two indices have high correlation with moisture content for each four sensors. Table 2 also shows RMSE and R2 value for soil moisture estimation. These two indices (NMDI and PDI) for MODIS (that is used bands 1, 2, 6 and 7) have high accuracy for soil moisture estimation.
Fig. 8 Relationship between estimated soil moisture content with NMDI for MODIS, ASTER, ALI and ETM+ sensors
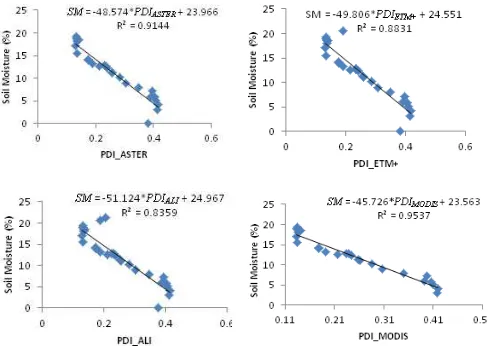
Fig. 9 Relationship between estimated soil moisture content with PDI for MODIS, ASTER, ALI and ETM+ sensors
Table2. RMSE for evaluation of estimated NMDI and PDI for MODIS, ASTER, ALI, ETM+ for soil moisture estimation
3. New spectral Angle Index
As regards, with increasing soil moisture reduces Reflectance in the IR spectral region, Using Scalar product of vectors consisting of dried soil reflectance vector and soil samples with different moisture percentages, we can calculate angle between dried soil reflectance vector and other samples as the following:
(3)
Here, RDry soil and RWet soil refer to the dried soil reflectance and wet soil reflectance samples, respectively, while i refer the number of soil samples.
At first, this new index was modeled with all data in the spectral range between 0.4 to 2.5 microns. Figure (10) shows that there is a significant relationship with a high correlation between this angle index and soil moisture (%).
Fig. 11 Relationship between angle index in the SWIR region (2150nm to 2155nm) and soil moisture
Furthermore, Angle index was calculated for spectral reflectance equivalent to bands 3, 4,5,6,7 MODIS Which has a spatial resolution of 500m (Fig.12).
Fig. 12 Relationship between angle index bands 3, 4,5,6,7 MODIS and soil moisture
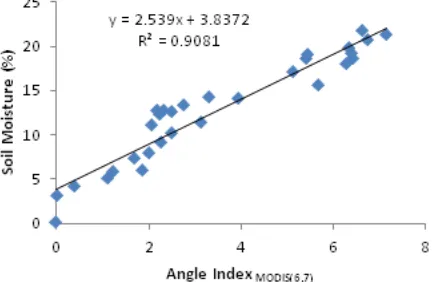
Finally, new spectral angle index was calculated only for bands 6 (1640nm) and 7(2130nm) MODIS. Fig. 13 shows that there is a good relationship between MODIS angle index and soil moisture (%).
Fig. 13 Relationship between angle index bands 6 and 7 MODIS and soil moisture
With the increase of soil moisture, slope between the two absorption bands (1640 and 2130 nm) increases. Figure 14 shows that this angle index has a good accuracy (about 3%) in soil moisture estimation.
Fig. 14 Relationship between estimated soil moisture with MODIS Angle index (6,7) and observed soil moisture
4. CONCLUSION
The general objective of this research was to present the potential of satellite optical/IR measurements as a diagnostic tool to assess soil moisture. The basis of the optical technique for soil moisture estimation rests on the connection between soil surface reflectance and moisture contents.
At first, the study has investigated the relationship between two soil moisture indices (NMDI and PDI) and soil moisture content (%) based on in situ spectral measurements. these two indices have higher efficiency to estimate soil moisture especially for bare soil or weakly vegetated area and can be used with high confidence in the linear model of soil moisture estimation. In addition to, these two indices were calculated according to the spectral range of conventional multispectral sensors such as MODIS, ASTER, ETM+ and ALI. These two indices have high correlation with moisture content for each four sensors. Finally we proposed a new spectral angle index based on Scalar product of vectors. The results show that there is a significant relationship with a high correlation between this angle index and soil moisture (%).
References
Betts, A. K., Ball, J. H., Beljaars, A. C. M., Miller, M. J. and Viterbo, P., 1996. The land-surface-atmosphere interaction: A review based on observational and global modeling perspectives. J. Geophys. Rev., 7209-7225.
Clark, C. A. and Arritt, R. W., 1995. Numerical simulations of the effect of soil moisture and vegetation cover on the development of deep convection. J. Appl. Meteorol.,34, 2029-2045.
Engman, E. T., 1991. Application of Microwave Remote Sensing of Soil Moisture forWater Resources and Agriculture. Rem. Sens. Environ., 35, 213-226.
Fennessey, M. J., and Shukla, J., 1999. Impact of initial soil wetness on seasonalatmospheric prediction. J. Climate, 12: 3167-3180.
Ghulam A, Qiming Qin, Zhiming Zhan 2007 Designing of the perpendicular drought index. Environ Geol (2007) 52:1045–1052 Idso, S. B., Jackson, R. D., Reginato, R. J., Kimball, B. A. and Nakayama, F. S., 1975. The Dependence of Bare Soil Albedo on Soil Water Content. Journal of AppliedMeteorology, 14, 109-113. Lingli Wang1 and John J. Qu1 2007 . NMDI: A normalized multi-band drought index for monitoring soil and vegetation moisture with satellite remote sensing. Geophysical Research Letters, VOL. 34, L20405, doi:10.1029/2007GL031021
Walker, J., 1999. Estimating Soil Moisture Profile Dynamics from Near-Surface Soil Moisture Measurements and Standard Meteorological Data. Ph.D. dissertation, The University of Newcastle, Australia.
Wood, E. F., Lettenmaier, D. P. and Zartarian, V. G., 1992. A Land-Surface Hydrology Parameterization With Subgrid Variability for General Circulation Models. J. Geophys. Res., 97(D3), 2717-2728.