AUTOMATIC EXTRACTION OF ROCK JOINTS FROM LASER SCANNED DATA
BY MOVING LEAST SQUARES METHOD AND FUZZY K-MEANS CLUSTERING
S. Oh a, H. D. Park a*, Y. D. Jo b
a Dept. of Energy Systems Engineering, Seoul National University, Seoul, 151-744, Korea – (ohchan22, hpark)@snu.ac.kr
b Exploration Geophysics and Mining Engineering Dept., Korea Institute of Geosciences and Mineral Resources, Daejeon, Korea – [email protected]
KEY WORDS: terrestrial laser scanning, rock joint, orientation, moving least squares, fuzzy K-means clustering
ABSTRACT:
Recent development of laser scanning device increased the capability of representing rock outcrop in a very high resolution. Accurate 3D point cloud model with rock joint information can help geologist to estimate stability of rock slope on-site or off-site. An automatic plane extraction method was developed by computing normal directions and grouping them in similar direction. Point normal was calculated by moving least squares (MLS) method considering every point within a given distance to minimize error to the fitting plane. Normal directions were classified into a number of dominating clusters by fuzzy K-means clustering. Region growing approach was exploited to discriminate joints in a point cloud. Overall procedure was applied to point cloud with about 120,000 points, and successfully extracted joints with joint information. The extraction procedure was implemented to minimize number of input parameters and to construct plane information into the existing point cloud for less redundancy and high usability of the point cloud itself.
* Corresponding author.
1. INTRODUCTION
Joint in a rockmass significantly reduces stability of the entire rock structure, for which thorough observation on rock exposure is essential in engineering site investigation. Traditionally, directional component of the rock joint has been measured by manual survey with clinometers, but this method introduces many errors and data exclusion in entire rock mass. An accurate and statistically-unbiased result can increase the reliability of investigation which is the main motivation of recent studies on the use of laser scanned data into the geological field.
Light detection and ranging (LiDAR) technology has been rapidly developed with improving resolution and accuracy, and various plane detection techniques are being widely applied. In geological field, on the other hand, a few algorithms were implemented, but they were insufficient to be developed in an automated manner. Those algorithms required many parameters, demanded user to select points in joints, or used triangulated mesh which is unfavourable for data handling.
In this study, a simple automatic plane extraction was introduced with less parameters and user interaction. Suggested model has minimized number of parameters which facilitates user to decide parameters clearly. Also, normal direction and classification result are stored with point cloud itself that can be utilized for query as well as visualization.
2. RELATED WORK
Extraction and visualization of rock joints from point cloud has been a primal issue in engineering geology. Slob et al. (2002) and Kemeny et al. (2006) presented intuitive method to extract
planar patches from triangulated network. Patches were generated if an angle of two adjacent triangle facets was less than a threshold, e.g. 10 degree. This method was advantageous for clearness of merging process but had to use additional extravagant mesh structure, which was redundant to represent point set surface. Triangle facets unassigned to the patches were even more unnecessary that increases the redundancy.
A research was performed by Roncella and Forlani (2005) on the extraction of planar patches using random sample consensus (RANSAC). The research employed RANSAC algorithm to extract plane surface at every level of digital surface model (DSM) pyramid. This algorithm randomly samples three points as a minimal subset of a plane. The suitability as a representative plane in point cloud was scored by the number of points whose distance from the selected plane is less than threshold. This approach can automatically detect numerous plane pieces followed by clustering those using K-means. However, determining some parameters required visual inspection of the result which is needed to be self-tuned.
3. DATA AQUISITION
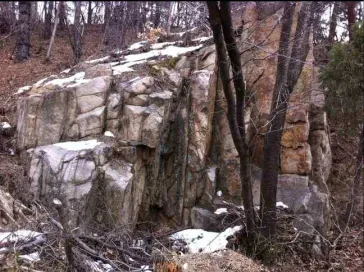
The device (scanstation C10, Leica; wavelength: 532nm) used in this study is able to acquire 50,000 points per second, with a centimetre accuracy (6mm at 100m). One scan was performed in order to cover the study area though shading caused by vegetation close to the target could not be avoided (Fig. 1, Fig. 2). Point spacing was selected to be 5mm at 5m to sufficiently resample the jointed rock surface. The limiting factors, such as non-reflective surface and humid or foggy atmospheric condition had little effect on the quality of the obtained point cloud. The raw dataset consists of 120,714 x, y, z coordinate was exported after removing the vegetation.
International Archives of the Photogrammetry, Remote Sensing and Spatial Information Sciences, Volume XXXVIII-5/W12, 2011 ISPRS Calgary 2011 Workshop, 29-31 August 2011, Calgary, Canada
Figure 2. Point cloud of target area.
4. ESTIMATING POINT NORMAL
Point normal was defined by the direction of vector perpendicular to the best fit plane of nearby point set. This direction was calculated by moving least squares (MLS) method which optimizes error function (Alexa et al., 2003), defined as:
å
Where n = estimate of normal direction of fitting plane pi= points within user-defined distance
q = projection of r onto local reference plane D = distance from origin to fitting plane
Squared term in this function is the error to the approximate plane and remaining is weight function which reduces the fractional part of distant error.
The weight function is commonly suggested in a Gaussian form.
2
where h is smoothing parameter, however, a smooth polynomial function modified from Alexa et al(2003) was employed as an alternative to increase the efficiency of the process. Points in the range of h effectively contribute error to Eq. 1 if it is closer to the original point.
( ) 2 3 3 ÷2+1
As an iterative optimization process, moving least square estimate initial normal as Eigenvector that corresponds to the smallest Eigenvalue of weighted covariance vector which was followed by iterative nonlinear minimization (Alexa et al, 2003). Because rock joint is mostly delineated as a plane in engineering applications, least squares was minimized by computing the coefficient of first degree polynomials, as:
N
[
]
i information to the existing point cloud.5. ASSIGNING POINT TO A JOINT
5.1 Fuzzy K-means clustering
Joint set is a group of sub-parallel joints in a geological formation. Normal directions of point cloud were separated into K subgroups minimizing fuzzy objective function (Hammah and Curran, 1998): For the dissimilarity norm,
2( , ) 1 ( )2 joint set instead of using Euclidean distance of the two vectors (Hammah and Curran, 1998). The minimizing process of this fuzzy objective function repeated while degree of membership oscillates greater than 0.001. This approach evaluates degree of membership between point and every joint set which makes possible to decide the most suitable joint set of point with the largest degree of membership.
Figure 1. Target area for laser scanning.
International Archives of the Photogrammetry, Remote Sensing and Spatial Information Sciences, Volume XXXVIII-5/W12, 2011 ISPRS Calgary 2011 Workshop, 29-31 August 2011, Calgary, Canada
5.2 Region growing
The x, y, z coordinate with joint set enables assigning points to individual joint by merging nearest neighbors. Firstly, eight nearest neighbor points from original point are searched. Eight points can be sufficient for candidate of region growing because point cloud on the flat area, on which point cloud is located, distribute in a latticed pattern. Secondly, neighbor points belonging to the same joint set are merged into a point set representing a joint in a rock exposure (Fig. 3). A step-by-step merging of process enlarges point set until they are surrounded by other joint set.
Set A Set B
Set A
Joint 1 Joint 2
Joint 3
Figure 3. Region growing approach to discriminate joints in point cloud
6. EXPERIMENT AND RESULT
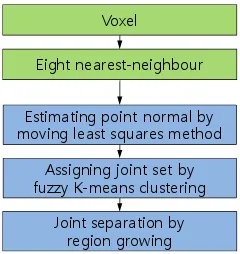
Once the point cloud data of the rock exposure was obtained, 3D voxel structure was constructed to support the searching nearby points within a distance, h. Voxel structure of unit length 2h stores points inside the cube and allowed the search points to be found within nearest eight voxels. Points were sorted by the distance from center point, and the first eight points were stored as eight nearest neighbor points.
By the searching technique, normal direction of every point were calculated by moving least squares method, after that, all normal vectors were grouped into the joint set by fuzzy K-means clustering. Individual joint was discriminated by region growing. Figure 4 summarizes the flowchart of the processing steps.
Voxel
Eight nearest-neighbour
Estimating point normal by moving least squares method
Assigning joint set by fuzzy K-means clustering
Joint separation by region growing
Normal direction and plane information were calculated and stored with point cloud in a tabular format: x, y, z coordinate, point normal, degree of membership and joint index. These data could visualize spatial distribution of joint and joint set on a rock surface. Overall approach was applied to the point cloud data with different search distance h.
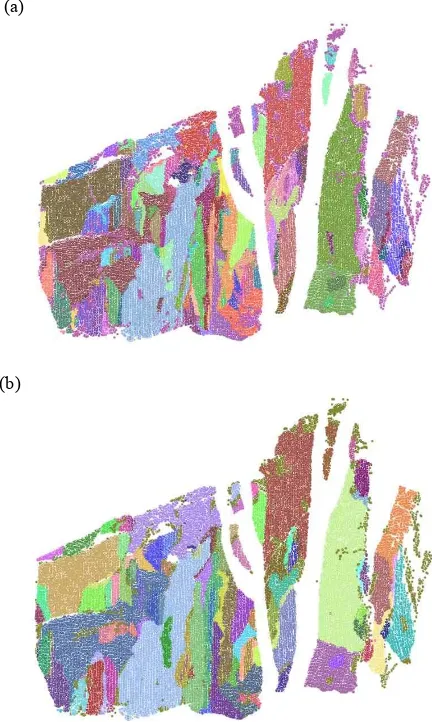
Result of joint set classification is shown in Fig. 5 with search radius is 50mm and 100mm, which is ten and 20 times the resolution of scanned data, respectively, and the number of joint sets was four. Result of joint classification is shown in Fig. 6 with same parameters. Total number of planes were 252, 224 when search radius was 50mm and 100mm. Although minor differences were found in the result, smoothing effect was moderately larger when search radius was 100 mm.
a)
b)
Figure 5. Result of joint set classification (a) h = 50 mm (b) h = 100 mm
Figure 4. Procedure for processing point cloud
International Archives of the Photogrammetry, Remote Sensing and Spatial Information Sciences, Volume XXXVIII-5/W12, 2011 ISPRS Calgary 2011 Workshop, 29-31 August 2011, Calgary, Canada
(a)
(b)
Figure 6. Result of joint classification (a) h = 50 mm (b) h = 100 mm
7. CONCLUSION
In this study, an automated joint extraction procedure was developed to minimize the number of parameters using point cloud. Search radius and number of joint set were the two input parameters that have to be decided. If those two parameters were defined, point normal, joint set, and joint of every point could be calculated by moving least squares, fuzzy K-means clustering, and region growing method without any user interaction. A value of tenth to 20th ofresolution was chosen for search radius, and the number of joint sets were four by which joint was extracted. Though the number of joint set depended upon the decision of investigator, the acceptable number of joint set could be chosen from field work.
The data derived in the process of plane detection were stored with point cloud. Joint set and joint index were used to visualize point cloud which was simple and easy-to-handle.
ACKNOWLEDGEMENTS
This research is supported by Korea Institute of Energy Technology Evaluation and Planning (KETEP). (Project ID: 2008-R-RD11-P-03-3-010)
REFERENCES
Hammah, R.E. and Curran, J.H., 1998. Fuzzy cluster algorithm for the automatic identification of joint sets. Int J. Rock Mech. Min Sci., 35(7), pp. 889-905.
Kemeny, J., Turner, K. and Norton, B., 2006, LIDAR for rock mass cahracterization: hardware, software, accuracy and best-practices, Laser and Photogrammetric Method for Rock Face Characterization: Exploring New Opportunities, Golden, CO. Roncella, R. and Forlani, G., 2005. Extraction of planar patches from point clouds to retrieve dip and dip direction of rock discontinuities. In: ISPRS Workshop, Laser Scanning 2005, Enschede, the Netherlands. pp. 162-167.
Slob, S., Hack, R., and Turner, A.K., 2002. An approach to automate discontinuity measurements of rock faces using laser scanning techniques. In : ISRM International Symposium on Rock Engineering for Mountainous Regions-Eurock 2002, Funchal, Portugal, pp. 87-94.
International Archives of the Photogrammetry, Remote Sensing and Spatial Information Sciences, Volume XXXVIII-5/W12, 2011 ISPRS Calgary 2011 Workshop, 29-31 August 2011, Calgary, Canada