A MULTIDISCIPLINARY APPROACH TO THE COASTAL PROTECTION OF TWO
ARCHAEOLOGICAL SITES IN LYBIA
I. D’Urso a , M. Ombrelli a, P. Telaroli a, W. Calesso b, C. Badin c , M. Senigaglia c , C. Urrutia d, L. Sterponi d *
a Thetis S.p.a., Castello 2737/f, 30122 Venezia, Italia – [email protected] b Marco Polo Storica Ltd, 25° Kirkgate Dunfermline, Fife, KY12 7NA – [email protected]
c Ril.Mar. s.r.l., V.le Ancona 19, 30172 Mestre Venezia, Italia – [email protected] d Spacedat s.r.l., via Duca degli Abruzzi 57, 73100 Lecce, Italia – [email protected]
Commission V
KEY WORDS: Leptis Magna, Sabratha, bathymetric survey, interferometric swath, DEM generation, satellite images
ABSTRACT:
The present study is part of the preliminary investigation to design a coastal protection for the archaeological sites of Sabratha and Leptis Magna and the hydraulic re-arrangement of the final stretch of the Wadi Lebda which runs across the archaeological area of Leptis Magna. This study is a part of the project “Safeguarding the Sabratha and Leptis Magna archaeological sites. Preventing flooding of Leptis Magna from the Wadi Lebda”, started in 2009 and commissioned by MARCO POLO STORICA LTD - Scotland. The planning of interventions has required an accurate morphological reconstruction of the interested areas. In this regard, given the wide investigation area, the aerial and land survey operations logistic difficulties and tight timeframe, the use of multi-beam technology and satellite images was particularly useful.
The Digital Terrain Model has been coupled with detailed bathymetric surveys of the coastal area, undertaken mostly by multi-beam techniques, and by investigations of the ground characteristics, which were integrated in the information system prepared as design support.
* Corresponding author
1. INTRODUCTION
The coast lines of the UNESCO archaeological sites of Sabratha and Leptis Magna in Libya are subjected to severe erosional phenomena, with consequent damage and deterioration effects of the historical items.
The site of Sabratha is located near the coast, approximately 67 km to the west of Tripoli and the archaeological site has a seafront of approximately 400 m. The coast is characterized by a sandstone terrace, composed of sands, clays and calcarenites that over time have undergone erosion from the action of the waves (Vita-Finzi, 1969).
The critical state of the coast is evident: as a consequence of the sandstone coast erosion, the sea has reached the Roman buildings and damaged.
The site of Leptis Magna is a coastal area, approximately 100 km to the east of Tripoli, the archaeological site seafront extends approximately 2.6 km and is characterized by alternating beaches and rocky capes (Vita-Finzi, 1969). The remains of a roman port lighthouse are located on the cape (Bartoccini, 1958); this lighthouse was damaged by the wave attack, the upper part of the construction has fallen down and part of the stones are now underwater.
The coastline retreat over time is evidenced by the proximity of the ruins to the foreshore, therefore the sea has reached some of the buildings.
Even though the sea floor closest to the shore has rocky outcrops, intervention is required to prevent the action of the wave motions from eventually reaching the artefacts.
The city of Leptis Magna was built by Phoenicians at the mouth of the Wadi Lebda, which afforded a good anchorage for ships under the protection of an outlying reef on the west: the problem of protecting the area from flooding by the wadi and to prevent the silting up of the harbour has been faced by inhabitants since the antiquity and several interventions have been done to re-arrange the wadi.
The problem to protect Leptis Magna against flooding when the Wadi Lebda bursts its banks is not yet solved. The site suffered devastating flooding in 1945 and again in 1987 and 1988. In the occasion UNESCO provided emergency equipment to clear the site from debris, the effort took several years.
Actually, since a modern dam has been built and an artificial reservoir exists, urgent interventions are required to re-arrange the five kilometres end part of the wadi, from the dam to the mouth.
A plan for the protection and rehabilitation of the two Libyan coastal archaeological sites and to ensure the regular discharge of the river’s waters was mandatory. To project the interventions, an accurate reconstruction of the current topographical and bathymetric characteristics of the two archaeological sites’ coastal areas and the morphology of the Wadi Lebda basin have been necessary.
2. COASTAL PROTECTION OF SABRATHA
The seafront of the Sabratha archaeological site is characterized by the presence of islands and shallow waters, remains of an ancient coastline. The Ancient Sabratha was built on a low cliff of calcareous sandstone, which is not greatly resistant to the action of the wave motions and will therefore inevitably be eroded over time, the result is a significant damage for the cultural heritage. A coastal protection is therefore needed.
The subject surveys were designed to determine the current topographical, bathymetric and morphological characteristics of the entire coastal area of Sabratha archaeological site. As a whole, the work undertaken will provide an overview of the topography, bathymetry and morphology of the subject coastal area and sea bed suitable for planning additional detailed studies and designing any future coastal protection interventions.
With respect to the subject studies, topographic and bathymetric surveying of the coastal area of Sabratha archaeological site were conducted between the end of March and the beginning of April, 2009, as follow (Istituto Idrografico della Marina, 2009): • definition of the geodetic settings and establishment of planimetric-altimetric reference points (benchmarks) in the area being studied;
• detailed planimetric-altimetric survey of the coastline adjacent to the archaeological site and the accessible reefs;
• bathymetric survey of the sea along the entire perimeter of the archaeological site, up to a bathymetry of 25 m bsl.
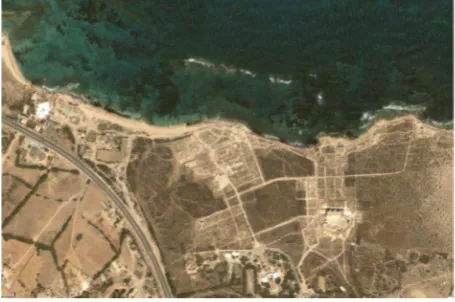
Figure 1. View of the coast of Sabratha
2.1 Definition of the geodetic settings
Due to lack of planimetric reference data, the survey has been referred to the “U.T.M.-WGS84” projection map, using an existing point (benchmark) that was found after a reconnaissance of the archaeological site and was established by placing an iron stake in a concrete base, denoted as “ST2”. In addition, another benchmark was established with a cross marked on a stone base, denominated as “ST2 bis”.
The locations of points “ST2" and “ST2 bis” were identified using GPS instrumentation in static mode, determining the geographic position and the ellipsoid height of the points in WGS84 coordinates and defining their planimetric position in planar coordinates in the U.T.M. F. 33 mapping system projection; to determine the coordinates, the EUREF permanent GPS stations in Noto and Milo Erice in Sicily were used as reference benchmarks, calculating baselines longer than 500 km
and obtaining an error on the determination of the benchmarks’ coordinates less than 2 cm.
Figure 2. Benchmark “ST2”
The government agency responsible for the Sabratha archaeological site provided a monograph for an elevation point denominated “0703”. The point was therefore identified and, using double frequency GPS in RTK mode, the elevations of stations “ST2” and “ST2 bis” were determined, referencing these to the elevation reported in the monograph for point “0703”.
2.2 Detailed planimetric-altimetric survey
The planimetric-altimetric survey was conducted using a topographic GPS instrument in RTK mode.
“RTK” surveying entails the use of two pieces of equipment: a Master (fixed) and a Rover (mobile). The first is positioned on a known point, while the second is used to survey unknown points.
Specifically, the survey was conducted by measuring a series of points aligned along survey lines that were as perpendicular as possible to the coastline and spaced about 20 m apart to ensure coverage of the entire subject coastal area; additional points were used in zones containing abrupt variations. Various walls, landings and paths were also surveyed as the subject area included archaeological ruins. Using the same methodology, the accessible reefs were also surveyed.
The survey covered an area having a length of approximately 1500 m and a width varying between 40 and 60 m; for each point surveyed, the characteristics of the site were recorded. These characteristics, conveniently classified by elevation and type, permitted the exact orological-morphological conformation to be shown on the resulting planimetric and graphic figures.
2.3 Bathymetric survey
The bathymetric survey was conducted using two different methods. The first method has employed the use of a “single-beam” bathymetry system to survey the shallow and very shallow waters adjacent to the coast, while the second has been carried out using an "interferometric swath" system to survey the deeper waters and areas farther offshore.
2.3.1 Single-beam survey
A global system employed to Collecting / Processing / Reporting data was composed of:
• a precision hydrographical echosounder with a 1 cm resolution, an acoustic operating frequency of 200 kHz and a transducer with an acoustic cone of 3 degrees;
• a sensor to correct the wave motion; • a GPS RTK OTF receiver.
All of the above were interfaced with a data collection system that digitally recorded the bathymetric data and georeferenced them.
To perform the single-beam bathymetric survey of the interested area, a series of parallel lines perpendicular to the coast was surveyed, as described below:
• 76 parallel lines with a N-S orientation, spaced 20 m apart; • 34 lines in addition to the above, run in the zones near the reefs and along the coast;
for a total of 110 lines, covering an area of approximately 578 m2.
Specifically, after plotting the courses, the survey was conducted by a team composed of two operators and a boat pilot, using a boat measuring 6 m long and 2 m wide that was fitted with equipment for bathymetric surveying.
All the survey lines (courses) were run at constant speeds of no greater than 4-5 knots and followed continuous lines; a monitor was constantly observed in real time to verify that the survey lines always followed the predetermined course.
The boat's course and position were monitored by using the RTK OTF differential/kinematic method, which employs a pair of GPS receivers – one receiver (master) was positioned ashore, at the "ST2 bis" benchmark, while the other (rover), with a position update rate of 5 Hz, was placed aboard with the antenna mounted on the vertical of the transducers – and by using a monitor to observe in real time the boat’s course, speed, deviations from the predetermined course, the WGS84 and local coordinates, the depth and the line surveyed.
Calibrations and adjustments for the echosounder were performed at the beginning and end of each surveying session by performing a “Bar-Check” (measuring the depth of a bar or metal disc lowered below the transducer and suspended from a measuring line or chain marked in centimetres).
While the bathymetric survey was being performed, the tide values necessary for reporting the bathymetric data were measured by means of an ultrasonic tide gauge featuring a continually recording internal data logger.
2.3.2 Interferometric Swath Survey
A multi-beam interferometric system with optional side-scan was used. This system is based on the phase discrimination technique (interferometric method), which permits to record data for sections of considerable width, with high spatial resolution. The acoustic frequency of the system used was 250 kHz, which was selected after a careful study, conducted to obtain an optimal balance between high definition and a good range, even in turbid waters. The maximum width of the swath is approximately 300 metres, which in shallow waters can reach up to 15 times the depth of the water. More than 2000 measurements can be taken with each swath, with a maximum of 15 swaths per second. Therefore it was possible to attain 100% coverage of the surveyed area in both shallow and deep waters.
To collect the bathymetric data, the system uses a combination of phase and amplitude and the margin of error is 1.5 cm. The system is composed of a pair of transducers mounted on a V bracket and a control unit containing all of the instrument’s electronic components.
The motion reference unit (MRU) and a sound velocity sensor were also mounted on the V bracket. A direction sensor (GPS compass) and a sound velocity profiler formed an integral part
of the system; auxiliary equipment included a GPS RTK OTF as navigation positioning system.
The assembly of equipment, including the sensors, was connected to a control unit and managed with system software, which generated the DTM (Digital Terrain Model) and the side-scan image of the area being studied.
Once all of the instruments (sonar, sensors, compass and GPS) were mounted aboard the equipped boat, accurate measurements of the positions and elevations of the sonar and all the sensors installed were taken, as well as the position of the GPS antenna; this data was entered into the system’s control unit.
Verifying the installation parameters, particulary the positions and relative angles of the transducers, the sensor to correct for wave motion, the direction sensor (GPS compass), the sound velocity sensor and the GPS antenna are essential for obtaining precise, high-quality data.
Therefore, calibration was performed using a field test to determine the latency (delay) of the sensors and the residual biases of the boat (roll, pitch and heading) by running 4 lines: • 3 lines in opposite directions, to obtain the corrections for the residual biases;
• 1 line overlapping the central of the three lines described above, run in the same direction but at a different speed, to determine the latency.
In addition, the horizontal swath width for a single pass that was needed to obtain complete coverage of the area surveyed, as well as a minimum 20% data overlap with adjacent areas, was determined for both deep waters and shallower waters.
The distance between adjacent lines was 40 m in areas with depths greater than 15 m, and 20 m where depths were greater than 10 m, with a 40% overlap.
Once the tests were completed, the recorded data had been processed to determine the various corrections (calibration parameters) to apply to all the sensors installed on the boat and these were then entered into the control unit.
To perform the multi-beam bathymetric survey of the interested area, the following were surveyed:
• 24 parallel lines, having a NW-SE orientation, spaced 40 m apart for depths greater than 15 m, and 20 m apart for depths less than 10 m;
• 10 parallel lines with a N-S orientation, spaced 30 m apart; for a total of 34 lines, covering an area of approximately 1063 m2.
Specifically, after plotting the courses, performing the calibration tests and verifying coverage, the survey was conducted by a team composed of two operators and a boat pilot, on a motor boat that was fitted with equipment for this specific purpose, as described in the section 2.3.1 “Single-beam Survey”.
All of the survey lines (courses) were run at constant speeds of no greater than 2-3 m/s, equivalent to approximately 4-5 knots, and followed continuous lines; a monitor was continually observed in real time to verify that the collected data for the scanned area included an overlap of at least 30% of the width of the adjacent area studied.
The boat’s course and position were obtained by using a pair of GPS receivers, employing the RTK OTF differential/kinematic method. One of these receivers (master) was positioned ashore, at the "ST2 bis" benchmark, while the other (rover), with a position update rate of 10 Hz, was placed aboard with the antenna mounted on the vertical of the transducers.
During each survey session, several sound velocity profiles of the sea were taken, being these data necessary for the system; in addition, while the survey was being performed, the tide values necessary for generating the bathymetric data were measured by means of an ultrasonic tide gauge featuring a continually recording internal data logger.
During the post-processing phase, all data were reprocessed to verify their correspondence to the data used during the survey and the necessary corrections were applied when required. In addition, the position of each point surveyed was recalculated, for both the topographic survey and the bathymetric survey, to verify their reliability.
For every line measured in the bathymetric surveys, geometric-statistical filtering criteria were applied and any acoustic return peaks were filtered.
Figure 3. Results of the survey, showing contour curves
The contour lines (figure 3.) in some of the offshore areas and along the shore lines show an irregular pattern which indicates rocky seabed. The contour lines in some of the deeper area with water greater than 6 m run parallel to shoreline indicating a sandy seabed. This pattern of o rocky shoreline with local sandy beaches and deeper sea areas with sandy seabed is very often seen along the North coast of Libya and along the NW coast of Egypt. This indicate that there is a transport of sand along in the coast, but that is taking place away from the coastline at deeper water.
White areas on map define areas of uncertainty that the instrument was not able to detect due to their morphology. These zones identify natural reef (and its openings) recorded during the visual site inspections.
3. COASTAL PROTECTION OF LEPTIS MAGNA AND HYDRAULIC RE-ARRANGEMENT OF WADI LEBDA
Since the town of Leptis Magna beginnings, the Wadi Lebda has had a significant impact on the development of the city and its port. Over the centuries, there had been many interventions to regulate the river’s flow.
At the mouth of the Wadi Lebda, near the ancient Port of Leptis Magna, there are currently sandbars of significant size that obstruct the outflow of the waters during flood events, thereby causing flooding upstream.
The objectives of the study is to suggest a coastal protection scheme for the town of Leptis Magna and an intervention to ensure the regular discharge of the river’s waters when it is in full, thereby avoiding the threat to human life and preventing
damage to the archaeological heritage at Leptis Magna, as well as nearby infrastructure.
The subject surveys were designed to determine the current topographical, bathymetric and morphological characteristics of the entire coastal area of the Leptis Magna archaeological site and of the Wadi Lebda basin.
Figure 4. View of the coast of Leptis Magna
As a whole, the work undertaken will provide an overview of the topography, bathymetry and morphology of the subject coastal area and sea bed suitable for planning additional detailed studies and designing any future coastal protection interventions and hydrographic modifications.
With reference to the subject study, the topographic surveying of the Wadi Lebda basin was conducted in July-August 2009 in the following order (Istituto Idrografico della Marina, 2009): • definition of the geodetic settings and establishment of planimetric-altimetric reference points (benchmarks) in the area being studied;
• detailed planimetric-altimetric survey of the coastline adjacent to the archaeological site, of the Wadi Lebda basin and its diversion;
• bathymetric survey of the sea adjacent to the archaeological site;
• creation of a 10 x 10 km2 planimetric-altimetric reference network to calibrate the satellite photos in the area of Khums Leptis Magna;
• generation of a DEM (Digital Elevation Model) of Wadi Lebda basin and Leptis Magna archaeological area.
3.1 Definition of the geodetic settings
Similary to the case of Sabratha, due to lack of existing planimetric reference data, it was decided that the survey should be referenced to the “U.T.M.-WGS84” projection map; a benchmark was established on the Wadi-Lebda dam by means of a survey nail fixed to the road at the top of the dam itself and adjacent to the control tower; it was denoted as “BM Dam”. The location of benchmark “BM Dam” was identified using GPS instrumentation in static mode, determining the geographic position and the ellipsoid height of the point in WGS84 coordinates and defining its planimetric position in planar coordinates in the U.T.M. F. 33 mapping system projection; the following permanent EUREF GPS stations were used as reference benchmarks to determine the coordinates: Lampedusa, Noto and Milo Erice in Sicily calculating baselines longer than The International Archives of the Photogrammetry, Remote Sensing and Spatial Information Sciences, Volume XL-5/W5, 2015
600 km and obtaining an error on the determination of the benchmarks’ coordinates less than 3 cm.
In addition, five other points employed as GPS stations were established that were referenced to “BM Dam” and located in the areas subject to the survey. These points were denoted as follows:
• “ST Monticelli”: iron stake in a concrete base, placed at the top of the embankment upstream of the Roman dam located along the Wadi Lebda;
• “ST Bridge”: survey nail fixed to the concrete sidewalk near the western side of the bridge (second from the dam towards the sea) over the Wadi Lebda;
• “ST Coast”: survey nail fixed to the reinforced concrete slab at the guard station on the southeastern side of the archaeological site of Leptis Magna;
• “ST lighthouse”: survey screw with washer, fixed to the foundation of the ruins of the lighthouse north of Leptis Magna; • “ST Branch”: survey nail fixed to the top of the existing bank along the Wadi Lebda diversion located to the southwest of Leptis Magna.
Unlike the case of Sabratha, there were no existing altimetric reference data available and so, as a continuation of the agreement of the topographic and bathymetric surveys, it was decided that all the survey heights would have been referred to a single altimetric reference – the local average sea level. Variations in the sea level were therefore measured in the port of Khums. An ultrasonic tide gauge was used to measure the surface level of the water every 10 seconds, 24 hours a day, for the entire duration of the surveying (approximately 25 days); the "zero" value was determined by taking the average of the daily tide gauge variations. This “zero" value was employed as the local average sea level and was used to determine a value for the average wave motion, which thereby has enabled the orthometric heights of all the points surveyed to be obtained. The accuracy of the resulting orthometric height data was evaluated by comparing the values obtained from the planimetric-altimetric survey of the instantaneous sea level (zero line or surface of the water) with those of the tide.
Figure 5. Tide observations
3.2 Detailed planimetric-altimetric survey
The planimetric-altimetric survey was conducted using topographic GPS instruments in RTK mode.
Specifically, the survey of the coastline was conducted by measuring a series of points aligned along survey lines spaced
each other approximately 20 m, as perpendicular as possible to the coastline and continuing the bathymetric lines so as to cover the entire relevant coastal area.
The water surface contour was measured and additional survey points were measured when unexpected variations were detected.
As the survey included the existing ruins, the archaeological and non-archaeological structures located in the area were measured.
The survey covered an area of approximately 3500 m in length and between 20 and 60 m in width; for each point surveyed, the characteristics of the site were recorded. These characteristics, conveniently classified by height and type, permitted the exact orological-morphological conformation to be shown on the planimetric and graphic figures for the area.
The survey of the river started with the Wadi Lebda dam, measuring all of its fundamental features (length, width, height, outlets, etc.), including the reservoir upstream of the dam. The course of the Wadi Lebda (from the bottom outlet of the dam to the mouth of the river, at the Port of Leptis Magna, with a length of approximately 5100 m) and its diversion (which begins at the ruins of the ancient Roman dam, runs alongside the present day city of Khums, and finally empties into the sea approximately 2 km to the west of the Port of Leptis Magna, with a total length of approximately 2950 m) were then surveyed.
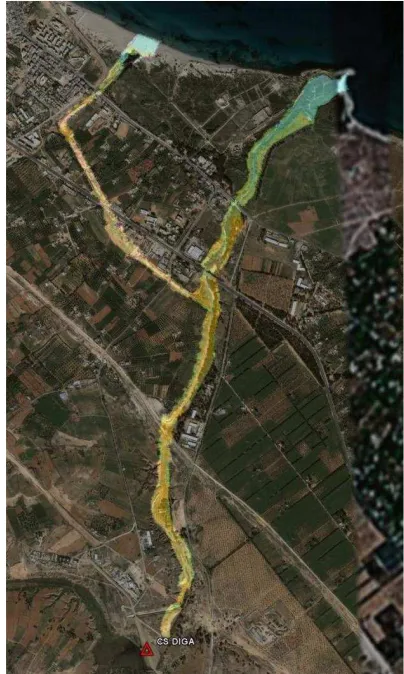
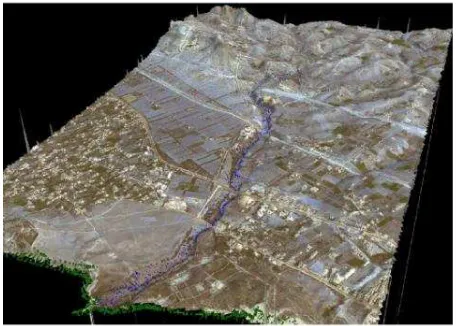
Figure 6. Satellite image of Wadi Lebda modelled on the DTM
A series of points aligned along transverse sections, spaced approximately 50 m apart were measured. These sections had a width of approximately 100 m and always extended at least to The International Archives of the Photogrammetry, Remote Sensing and Spatial Information Sciences, Volume XL-5/W5, 2015
the top of the banks, in areas where banks were present; in areas without banks, the survey was extended at least 50-80 m onto the land adjacent to the river to obtain an accurate representation of the section’s altimetric profile.
Specifically, all discontinuities and singularities such as changes in slope, variations in the terrain’s features and changes in vegetation were surveyed; in addition, more points were surveyed in areas containing buildings, infrastructure and hydraulic structures and the perimeters of these structures were measured when possible.
3.3 Bathymetric survey
The bathymetric survey of the sea adjacent to the archaeological site, covering 1500 m of coastline and an area of approximately 10500 m2, was conducted using two different methods: • “single-beam” bathymetry system for the shallow and very shallow waters adjacent to the coast,
• “interferometric swath” bathymetry system for the deeper waters and areas farther offshore.
The boat was rented locally and equipped as required to perform the subject bathymetric surveys.
3.3.1 Single-beam survey
A global system employed to Collecting / Processing / Reporting data was was composed of:
• a precision hydrographic echosounder with a 1 cm resolution, an acoustic operating frequency of 200 kHz and a transducer with an acoustic cone of 3 degrees;
• a sensor to correct the wave motion; • a GPS RTK OTF receiver.
To perform the single-beam bathymetric survey of the interested area, a series of parallel lines perpendicular to the coast were surveyed, as described below:
• 169 parallel lines with a NE-SW orientation, spaced 20 m apart and having an average length of 550 m; at each approximately 200 m interval, an individual line was extended to a total length of 2000 m from the coast;
• 11 parallel lines, having an E-W orientation, in the zone of the Port of Leptis Magna (Wadi Lepda mouth);
for a total of 180 lines, covering an area of approximately 6200 m2.
The boat's course and position were monitored by using the RTK OTF differential/kinematic method. Master receiver was positioned at the "ST Lighthouse" and "ST Coast" GPS stations. Calibrations and adjustments for the echosounder were performed at the beginning and end of each surveying session by performing a "Bar-Check".
While the bathymetric survey was being performed, the tide values necessary for reporting the bathymetric data were measured by means of the ultrasonic tide gauge featuring a continually recording internal data logger.
3.3.2 Interferometric Swath Survey
A multi-beam interferometric system with optional side-scan was used. Installation and calibration of the instruments similar to section 2.3.2.
To perform the multi-beam bathymetric survey of the interested area, the following were surveyed:
• 38 parallel lines, having a NW-SE orientation, with a length of approximately 3500 m, spaced 60 m apart for depths greater than 14 m, 40 m apart for depths greater than 8 m, and 20 m apart for depths less than 7 m;
• 19 parallel lines having a NE-SW orientation, spaced 30 m apart, as calibration lines;
for a total of 34 lines, covering an area of approximately 4314 m2.
Specifically, after plotting the courses, performing the calibration tests and verifying coverage, the survey was conducted by a team composed of two operators and a boat pilot, on a motor boat that was fitted with equipment for this specific purpose, as described in section 3.3.1
All of the survey lines (courses) were performed at constant speed no greater than 2-3 m/s, with an overlap of at least 30% of the width of the adjacent area being studied.
The boat’s course and position were obtained by using GPS RTK method and master receiver was positioned at the "ST Coast" GPS station.
During each survey session, several sound velocity profiles of the sea were taken, being these data necessary for the system; in addition, while the survey was being performed, the tide values necessary for generating the bathymetric data were measured by means of an ultrasonic tide gauge featuring a continually recording internal data logger.
During the post-processing phase, all data were reprocessed to verify their correspondence to the data used during the survey, and the necessary corrections were applied when required. For each line surveyed in the bathymetric surveys, geometric-statistical filtering criteria were applied and any acoustic return peaks were filtered.
In addition, the position of each point surveyed was recalculated, for both the topographic and the bathymetric survey, to verify its reliability.
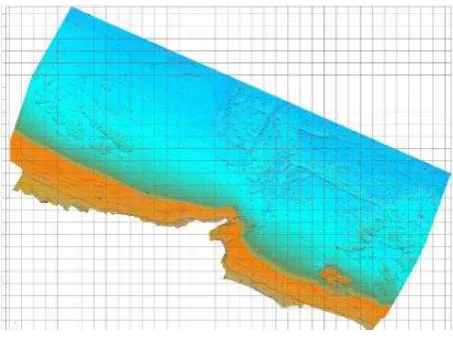
Figure 7. Results of bathymetric survey
3.4 Creation of a reference network
To orientate the series of photogrammetric images covering a 10 x 10 km2 area, including the Wadi Lebda basin and the archaeological area of Leptis Magna, 16 points were selected as support points (SP) in the area of interest.
The lines connecting the abovementioned points were surveyed with GPS in rapid static mode, with 15-20 minute observation sessions for each point and a 5 second sampling rate, and were connected with the benchmark "BM Dam".
The determination of the planimetric position, in planar coordinates, of the network points was performed using the method discussed in paragraph 3.1.
Figure 8. Support points for satellite images calibration
3.5 DEM generation
The main task of this part of the project was the generation of a DEM (Digital Elevation Model) of the Wadi Lebda basin, using high resolution satellite images from GeoEye-1 (Fraser and Ravanbakhsh, 2009).
A 3D model has been developed following this sequence: • selection and acquisition of the satellite data GeoEye-1 Geo Stereo;
• processing of satellite images; • TIN generation;
• accuracy control;
• optimization and validation of the TIN; • DEM Generation.
3.5.1 Selection and acquisition of the satellite images
A preliminary analysis has been conducted in order to decide which high resolution commercial satellite data should be used for the creation of the DEM. The analysis was focused on the technical characteristics of the satellite sensors and mainly considering the spatial, spectral and the stereo capability. The requirement to generate a DEM at a very high spatial resolution with a reduced height error has privileged the use of the GeoEye-1 satellite in GeoStereo mode with a spatial resolution of 50 centimetres.
High-resolution stereo pairs are collected in the same orbital pass, minimizing changes in lighting or scene content. GeoEye provides the stereo imagery pairs with a rational polynomial coefficient (RPC) camera model file. The RPC file provides camera model data suitable for use with “Photomod” software package for block adjustment, photogrammetric extraction of three-dimensional feature coordinates and creation of the digital elevation models (DEM).
Stereo pairs comprise two images taken on the same orbital pass, both images above 60° elevation with 30°-45° convergence.
The 11- bit satellite images used had a spatial resolution of 50 centimetres in the panchromatic and 2 metres in the multispectral. The map projection was the Universal Transverse Mercator 33 N with a WGS84 Datum (“U.T.M.-WGS84”), radiometrically corrected and rectified.
In order to comply with the project schedule, the satellite was programmed using a priority tasking with a window frame ranging from the 15th. of June to the 20th. of August 2009. The
acquisition of the satellite data was achieved on the 4th. of July 2009.
3.5.2 Processing of satellite images
The first steps in the processing of the satellite data are focused on the stereo orientation. The processing was applied to the panchromatic band in order to take advantage of the high spatial resolution accuracy.
The procedure described required the use of the software PHOTOMOD 4.4. to create a catalog of the Ground Control Points (GCP’s) provided by the topographic survey (section 3.4).
The 16 GCP’s where identified using photointerpretation over the image GeoEye 350565_rgb_0000000 and subsequently transfered over the image GeoEye 350565_rgb_0010000. In order to correct the image deformations and reduce the shift between the images, 43 TIE points were added on both images to perform a “Block adjustment”.
Once measured and verified the 59 points, the “Block adjustment” procedure was implemented.
The heights being considered are those referring to the ellipsoid in the reference system WGS84.
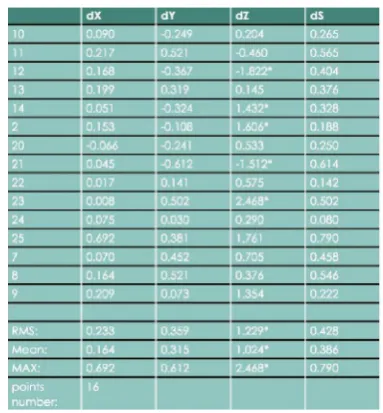
Table 1. Stereopair po_350565 pan 0000000 po 350565 pan 0010000 and residuals with GCPs.
The methods used for the “block adjustment” was a polinomial model using the geometry of the sensor (RPC). This model uses the coefficients delivered by the data supplier along with images and was applied using the typology “refinement” in auto mode. This procedure detects automatically the typology of refinement to apply to the RPC using the number of ground control points and TIE points.
The report with the results (Table 1.) shows the precise positioning of the stereopair with regards to the GCP’s.
3.5.3 TIN generation
The digital elevation model (DEM) has been generated using a Triangulated Irregular Network (TIN). For the creation of the TIN an 8 meter grid was used for generating the “Pickets” using an “adaptive model”. The adaptive model calculates the TIN nodes coordinates (in the grid nodes) automatically by the correlator.
The software calculates 3D coordinates using the most distinctive point of image in neighbourhood of each inner grid The International Archives of the Photogrammetry, Remote Sensing and Spatial Information Sciences, Volume XL-5/W5, 2015
node (the area size is 1/3 from grid step). In nodes of grid boundaries the points are calculated exactly in node location. If it is impossible to calculate 3D coordinates for some node, it is skipped, in this case such nodes are marked as “uncertain” and their height is calculated by interpolation of adjacent vertices. The final TIN is triangulated from grid nodes by modified Delaunay algorithm.
3.5.4 Accuracy control
To verify the validity of the Tin generated using the procedure, an accuracy control was applied obtaining a very high accuracy (RMS = 0.910).
3.5.5 Optimization and validation of the TIN
Different methodologies have been integrated in order to improve the model. Some of these methodologies include fotointerpretation, insertion of break lines and the use of Geographic Information System (GIS) to eliminate peaks and valleys.
• Insertion of break lines
The in-situ GPS measurements were used to improve the accuracy of the TIN, in particular over the coast line and along the Wadi. The table containing the GPS measurements has been formatted in a way to provide it as input for the software “Photomod” in order to integrate it in the TIN as breaklines. • GIS elaboration
The pickets from which the TIN was generated were exported from the software Photomod and imported into a GIS project using the software ArcMap 9.3. The main objective was to analyse the distribution of the points according to their height in order to find anomalies that could be eliminated or modified. In addition the software ET Geotools was used for the individuation of possible peaks or valleys. The results of these analysis were manually verified using fotointerpretation over the satellite image. After the pickets were controlled and modified, they were imported in Photomod to generate and optimized TIN.
• Elimination of peaks and valleys
Once the peaks were imported into the software the TIN was generated and the procedure repeated to eliminate peak and valleys. The TIN generated at the end of the procedure was optimized and validated using an accuracy control.
Figure 9. Satellite modelled on the DTM
3.5.6 DEM generation
The Digital Elevation Model (DEM) was generated from the TIN. The DEM contains, as in the case of a raster image, a bidemensional field with a certain number of rows and columns
which contains the geographic information (coordinates x,y) and a third coordinate (z) corresponding to the height.
The high spatial resolution of the satellite image has enhanced the quality of the DEM making it possible to identify a number of detailed features with great precision, for example roads and houses in the urban areas.
In order to maintain a uniform representation of the territory, a “smoothing” technique has been applied, consisting in creating Regular Pickets from the TIN and from the Pickets obtained a new TIN and DEM.
The final result was compared with the previous DEM created and based on the omegenuos representation of the entire image, the later was selected.
4. CONCLUSIONS
The topographic and bathymetric surveys of Sabratha and Leptis Magna archaeological areas allowed an accurate knowledge of the morphological characteristics of the sites and the discovery of previously unknown old submerged structures, of great interest from an archaeological point of view.
For both sites the final product of the work was a three-dimensional model of the seabed morphology, characterized by a high level of detail, with a 10 cm step, needed for the design of the coastal defences.
According to design requirements and due to the expanse of the investigated area, the DTM of the Wadi Lebda basin from satellite images achieved a satisfactory accuracy of +/-1 m, while more accurate methods were used for the areas that required a more detailed investigation, as the river bed and mouth, where the achieved accuracy was the order of +/-1 cm. Very detailed surveys carried out in so morphologically complex areas, together with their high archaeological delicacy, flight limitations and logistic difficulties, required the adoption of a multidisciplinary approach, tuned up on the experience gained by the surveying team in many years of activity carried out in the works for safeguarding the Venice Lagoon, one of the most complex and fragile ecosystems in the world.
The results that have been achieved demonstrated the usefulness of the application of such an approach in complex sites and difficult conditions everywhere in the world, making it a feasible alternative or complement, in terms of time, logistic and costs, to the LIDAR or drone aerial surveys.
ACKNOWLEDGEMENTS
Special thanks to Eng. Andrea Bondì, Thetis project manager at that time, for his important contribution in the realization of this project.
REFERENCES
Bartoccini, R., 1958. Il Porto Romano di Leptis Magna, Roma, Italy.
Fraser, C. S., Ravanbakhsh, M., 2009. Georeferencing Accuracy of GeoEye-1 Imagery, Cooperative Research Centre for Spatial Information, Department of Geomatics, University of Melbourne, Australia
Istituto Idrografico della Marina, 2009. Disciplinare tecnico per la realizzazione dei rilievi idrografici, Genova, Italy.
Vita-Finzi, C., 1969. The Mediterranean valleys: geological changes in historical times. Cambridge University Press. Revised March 2015