DIURNAL DIFFERENCE VEGETATION WATER CONTENT (ddVWC) OF ADVANCE MICROWAVE
SCANNING RADIOMETER-EARTH OBSERVING SYSTEM (AMSR-E) FOR ASSESSMENT OF CROP
WATER STRESS AT REGIONAL LEVEL
Abhishek Chakraborty*, M V R Sesha Sai
Agricultural Sciences & Applications Group, RS & GIS – Applications Area National Remote Sensing Centre, Indian Space Research Organization, Hyderabad, India KEY WORDS: AMSR-E, Vegetation water content, Diurnal Difference, Crop water stress
Abstract
Advance Microwave Scanning Radiometer – Earth Observing System (AMSR-E) derived Vegetation Water Content (VWC) at predawn (01:30 LST, descending pass) and afternoon (13:30 LST; ascending pass) were used to assess crop water stress condition over the selected meteorological subdivisions of India. The temporal profile of Normalized Difference Vegetation Index (NDVI) was used to study the progression of crop growth. The Diurnal Difference Vegetation Water Content (ddVWC) was found to be sensitive to rainfall patterns (wet/dry spell) particularly in moderate to full crop cover condition (NDVI>0.4). The ddVWC was found to be significantly (p = 0.05) correlated with the rainfall over the rainfed regions. The ddVWC was further characterized to represent different categories of crop water stress considering irrigated flooded rice crop as a benchmark. Inter year comparative analysis of temporal variations of the ddVWC revealed its capability to differentiate normal (2005) and sub-normal years (2008 and 2009) in term of intensity and persistence of crop water stress. Spatio-temporal patterns of ddVWC could capture regional progression of crop water stress at high temporal resolution in near real time.
1. Introduction
Vegetation water content (VWC) at any point of time is controlled by the dynamic interrelationship between the rate of water uptake and water loss (Cowan, 1965). Thus, the VWC is a dynamic property and it changes with the variations in the evaporative demand of the atmosphere and with the availability of moisture in the soil. In the daytime, there is an increase in water loss because of relatively higher saturation deficit of the air and opening of stomata in response to light. Under unlimited soil water availability, roots could extract water from soil at the same rate as that of the water loss, keeping the VWC unchanged. In case of limited soil moisture condition, plants, cannot replenish water adequately in daytime and VWC decreases. At night time, water loss (evapotranspiration) ceases to exist but plants continue to uptake water from soil and VWC increases. Thus diurnal difference VWC reflects the limitation of water supply and has the potential to serve as an indicator to water stress.
Experimentally measured difference in the fruit and the tree bole diameters during day and night time due to change in the plant water potential was reported by Kozlowski 1968. Diurnal hysteresis was observed between the leaf water potential and the vapour pressure deficit / radiant energy flux (Jarvis, 1976). On sunny days, when the stomatal conductance would be at its maximum, leading to high transpiration, the diurnal variations in leaf water potential fell down to as low as -2 Mpa at solar noon (Marigo and Peltier, 1996). Garcia-Orellana et al. 2013 reported that difference in day and night time water potential of plants decreases in response to water deficit and acts as sufficiently good indicator of plant water stress.
The passive microwave region of the electromagnetic spectrum responds to the changes in the dielectric properties of the soil and vegetation, which vary with the moisture content. Although passive microwave measurements have large footprint, they are less affected by aerosols/clouds and available frequently. Using these advantages, passive microwave remote sensing has been effectively used to measure land surface parameters since late 1970s. Considering the attenuation of passive microwave signal by above ground vegetation, Njoku and Entekhabi (1996)
concluded that accurate soil moisture measurements using passive microwave are limited to regions that have either bare soil or low to moderate amounts of vegetation cover. But above ground vegetation water content can also be considered as a source of information of root zone soil moisture rather than a barrier in retrieval of soil moisture. Friesen et al., 2012 found statistically significant difference in backscattering coefficient between the morning and the evening passes of the ERS 1/2 (C band; vertically polarized) wind scatterometer in vegetated areas in periods of water stress. A numerical sensitivity study using the Michigan microwave canopy scattering model (MIMICS) suggested that combining the morning and the evening passes of the SMAP radar observations would provide valuable information of water stress in areas otherwise considered too densely vegetated for traditional soil moisture retrieval (Steele-Dunne et al.,2012).
In the present study, diurnal and seasonal patterns of AMSR-E VWC of afternoon (13:30 LST) and predawn (01:30 LST) passes were studied during the kharif season (June to October) over India. The responses of diurnal difference VWC (ddVWC) of AMSR-E to rainfall at meteorological subdivision level over different time steps were evaluated. Inter year comparison of temporal dynamics of ddVWC was done to evaluate its sensitivity to differentiate between the normal and drought year. Spatio-temporal patterns of ddVWC were analysed towards the assessment of crop water stress at regional level.
2. Methodology
2.1 Study area
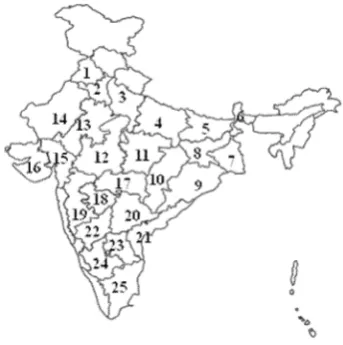
Fig. 1 Study area; 1. Punjab; 2. Haryana, Chandigarh and Delhi Daman (Gujarat);16. Saurashtra & Kutch, Diu (Saurashtra); 17. Vidarbha; 18. Marathwada; 19. Madhya Maharashtra; 20. Telangana; 21. Coastal Andhra Pradesh; 22. North Interior Karnataka; 23. Rayalaseema; 24. South Interior Karnataka ; 25. Tamil Nadu & Pondicherry (Tamil Nadu)
2.2 Processing of AMSR-E data
The AMSR-E gridded Level-3 land surface products (AE Land3.2) were downloaded from National Snow and Ice Data Centre, Distributed Active Archive Centre, University of Colorado for our study regions and the time period of interest.(http://n4eil01u.ecs.nasa.gov:22000/WebAccess/drill?at trib=esdt&esdt=AELand3.2&group=AMSA). AE Land3.2 product provided twice daily (ascending and descending pass) observations of VWC along with soil moisture content, land surface temperature, brightness temperatures at six different dual polarized bands. The ancillary data consisted of time, geo-location and quality control flags. It was provided in global cylindrical equal area projection at nominal grid spacing of 25 km × 25 km (true at 30◦N and S), with 1383 columns and 586 rows. The daily AE Land3.2 products were imported along with its geo-location information and multiplied with the scale factor to convert the digital number to VWC. Separate processing streams were used for the ascending (13:30 LST = afternoon) and descending (01:30 LST = pre-dawn) passes. Three days moving window technique was used to fill the swath gaps and then a seven days moving window average was applied to reduce compositing noise. Thus, two separate daily time series of VWC were generated and hence onward would be called as VWC at afternoon (VWCa) and VWC at predawn (VWCp). The diurnal difference VWC (ddVWC) was calculated by subtracting VWCa from VWCp i.e. ddVWC = VWCp – VWCa. 2.3 Smoothening of temporal profile of NDVI
The Global Inventory Modeling and Mapping Studies bimonthly (GIMMS) bimonthly NDVI dataset of 8 km spatial resolution (Tucker et al. 2004) were used for the selected time period of interest to assess the temporal progression of crop growth and phenology. NDVI was calculated as the normalized difference between near-infrared and red bands, and quantifies
the photosynthetic capacity of plant canopies, thus, indicating the amount of vegetation present in one place. The TIMESAT software was used to generate smooth time series of NDVI using Savitzky-Golay filter. The details of the smoothening technique over the diverse agricultural area across India are available in Chakraborty and Seshasai (2014).
2.4 IMD daily gridded rainfall data
Daily rainfall data for 35 years (1971–2005) generated by the India Meteorological Department (IMD) at a grid size of 0.5° latitude × 0.5° longitude were used in the present study for the selected time period of interest. The dataset was developed using quality controlled rainfall data from more than 3000 rain gauge stations over India. Details of the gridded rainfall data generation are available in Rajeevan and Bhate (2009). 2.5 Extraction of statistics
Fig. 2 Response of Vegetation Water Content (afternoon and pre-dawn), diel difference Vegetation Water Content (ddVWC) and NDVI towards rainfall over the crop growing season vegetation stage, NDVI>0.4). The VWCa was found to be higher than the VWCp for some period of time in September particularly after heavy rainfall events. During the active growth period of the vegetation, the transpiration pull was at its peak and the plant could gather extra water under unlimited soil moisture condition.
3.2 Response of diurnal difference vegetation water content (ddVWC) to rainfall
The VWC has not been subjected to extensive validation efforts, so it would be erroneous to take the absolute values of the VWC to assess the crop water stress. But the sensor was sufficiently stable and the relative changes in the VWC had the potential to be used to study the crop condition. Thus ddVWC i.e. VWCp – VWCa was introduced to assess the crop water stress. It is also important to mention here that the background effect in term of the fractional vegetation, type of crop, soil back ground etc were also normalized by taking the diurnal difference of vegetation water content. The ddVWC values were found to be nearly 0.6 kg/m2 over dry bare soil condition (First week of June and November). The wet spell started in the first week of July and ddVWC values sharply decreased in response to rainfall during this time period. Small intermittent rainfall events in July months were also found to be associated with the decrease in the value of the ddVWC. The dry spell in August resulted in increase of ddVWC values from 0.2 kg/m2 to 0.6 kg/m2. Two major rainfall events September were associated with two distinct dips in ddVWC values. Even ddVWC values were found to be negative during September showing very active growth of the crop (NDVI 0.5). October month was found be devoid of rainfall and the ddVWC values again increased subsequently from -0.6 kg/m2 to 0.6 kg/m2. Thus, ddVWC was found to be near to zero or even negative when the crop was not under stress (wet spell), and high positive values during dry spell indicating high crop stress.
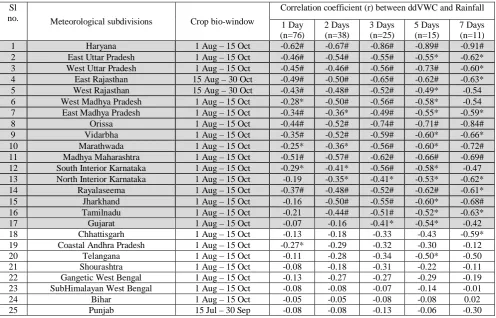
Table: 1 Correlation coefficients between ddVWC and rainfall over different meteorological subdivisions at different time steps (* significant at p=0.05, # significant at p=0.01, n= no. of sample)
Sl
no. Meteorological subdivisions Crop bio-window
Correlation coefficient (r) between ddVWC and Rainfall 1 Day
(n=76)
2 Days (n=38)
3 Days (n=25)
5 Days (n=15)
7 Days (n=11)
1 Haryana 1 Aug – 15 Oct -0.62# -0.67# -0.86# -0.89# -0.91#
2 East Uttar Pradesh 1 Aug – 15 Oct -0.46# -0.54# -0.55# -0.55* -0.62*
3 West Uttar Pradesh 1 Aug – 15 Oct -0.45# -0.46# -0.56# -0.73# -0.60*
4 East Rajasthan 15 Aug – 30 Oct -0.49# -0.50# -0.65# -0.62# -0.63*
5 West Rajasthan 15 Aug – 30 Oct -0.43# -0.48# -0.52# -0.49* -0.54
6 West Madhya Pradesh 1 Aug – 15 Oct -0.28* -0.50# -0.56# -0.58* -0.54
7 East Madhya Pradesh 1 Aug – 15 Oct -0.34# -0.36* -0.49# -0.55* -0.59*
8 Orissa 1 Aug – 15 Oct -0.44# -0.52# -0.74# -0.71# -0.84#
9 Vidarbha 1 Aug – 15 Oct -0.35# -0.52# -0.59# -0.60* -0.66*
10 Marathwada 1 Aug – 15 Oct -0.25* -0.36* -0.56# -0.60* -0.72#
11 Madhya Maharashtra 1 Aug – 15 Oct -0.51# -0.57# -0.62# -0.66# -0.69#
12 South Interior Karnataka 1 Aug – 15 Oct -0.29* -0.41* -0.56# -0.58* -0.47
13 North Interior Karnataka 1 Aug – 15 Oct -0.19 -0.35* -0.41* -0.53* -0.62*
14 Rayalaseema 1 Aug – 15 Oct -0.37# -0.48# -0.52# -0.62# -0.61*
15 Jharkhand 1 Aug – 15 Oct -0.16 -0.50# -0.55# -0.60* -0.68#
16 Tamilnadu 1 Aug – 15 Oct -0.21 -0.44# -0.51# -0.52* -0.63*
17 Gujarat 1 Aug – 15 Oct -0.07 -0.16 -0.41* -0.54* -0.42
18 Chhattisgarh 1 Aug – 15 Oct -0.13 -0.18 -0.33 -0.43 -0.59*
19 Coastal Andhra Pradesh 1 Aug – 15 Oct -0.27* -0.29 -0.32 -0.30 -0.12
20 Telangana 1 Aug – 15 Oct -0.11 -0.28 -0.34 -0.50* -0.50
21 Shourashtra 1 Aug – 15 Oct -0.08 -0.18 -0.31 -0.22 -0.11
22 Gangetic West Bengal 1 Aug – 15 Oct -0.13 -0.27 -0.27 -0.29 -0.19
23 SubHimalayan West Bengal 1 Aug – 15 Oct -0.08 -0.08 -0.07 -0.14 -0.01
24 Bihar 1 Aug – 15 Oct -0.05 -0.05 -0.08 -0.08 0.02
The AMSR-E soil moisture has limited use to assess crop condition during August – October due to attenuation of signal by the above ground vegetation (Chakraborty et al., 2012 and 2013). AMSR-E ddVWC showed good response to rainfall in full vegetation cover condition (NDVI > 0.4) and can provide supplementary information towards assessment of crop water stress. Thus, the strength of the relationship between ddVWC and rainfall was assessed at meteorological subdivision level under full vegetation cover condition for different time steps i.e. daily, 2, 3, 5 and 7 days. Based on the NDVI temporal profile, crop growing period (crop bio-window) was selected for each meteorological subdivision in such a way that the crop fully covered the ground so that soil contribution towards passive microwave signal was minimal. In majority of the meteorological subdivisions the crop bio-window was found to be between 1st August to 15th October (Table 1). But in case of Punjab it was 15th July to 30th September because of assured irrigation facility. As monsoon comes late in Rajasthan, the crop bio-window of East and West Rajasthan was found to be 15th August to 30th October. The ddVWC was linearly regressed with rainfall at daily, 2 days, 3 days, 5 days and 7 days time steps (block cumulative) within the crop bio-window over the meteorological subdivision under the study. The correlation coefficients between the ddVWC and rainfall over the different meteorological subdivisions were presented in Table 1. The majority of the areas comprising of northern India (Haryana, East Uttar Pradesh, West Uttar Pradesh), western India (West Rajasthan, East Rajasthan, Gujarat region), central India (West and East Madhya Pradesh, Vidarbha, Marathwada, Madhya Maharashtra), southern India (South and North Interior Karnataka, Rayalaseema, Tamilnadu), eastern India (Orissa, Jharkhand) were found to have significant correlation (p = 0.05) between ddVWC and rainfall. These meteorological subdivisions grossly cover the rainfed agricultural areas with limited irrigation support and crop water stress is governed by the amount and distribution of monsoon rainfall. Further, the correlation coefficient was comparatively low over daily time step and substantially improved over 3 days time step. Marginal increase in correlation was found with further increase in time window irrespective of the meteorological subdivisions. The meteorological subdivisions with full irrigation support such as Punjab, Coastal Andhra Pradesh or high rainfall zone like Gangetic West Bengal, Sub Himalayan West Bengal, Bihar, Chhattisgarh showed poor correlation. The meteorological subdivisions consist of large coastal zones like Coastal Andhra Pradesh, Shourastra & Kutch also showed poor correlation between ddVWC and rainfall. Particularly along the coastal line, due to coarser resolution of AMSR-E, part of its footprint falls into the ocean and significantly affects the AMSR-E brightness temperature.
3.3 Use of ddVWC as an indicator of crop water stress
In the present study, the dynamic range of ddVWC was found -0.8 to 1 kg/m2. This range of ddVWC required characterization to represent different levels of crop water stress. Towards this effort, an area of interest was drawn over a purely flooded rice crop region with full irrigation support and the temporal variation of ddVWC over that area was presented in Fig. 3. An assumption was made that in case of flooded rice condition with full irrigation support there was no crop water stress. It was observed that the positive values of ddVWC were restricted to 0.2 kg/m2. Taking it forward, it was decided that if ddVWC 0.2 kg/m2 the crop was not having any water stress.
Further, different categories of crop water stress were linearly extrapolated as follows:
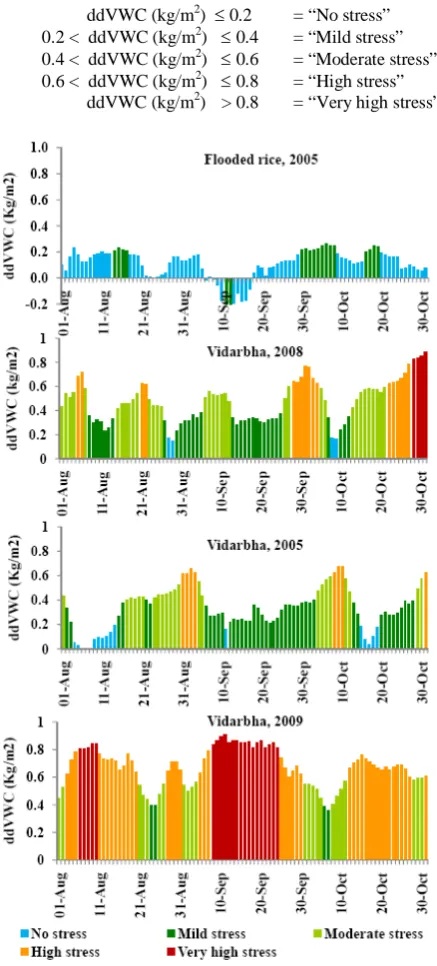
ddVWC (kg/m2) 0.2 = “No stress” 0.2 < ddVWC (kg/m2) 0.4 = “Mild stress” 0.4 < ddVWC (kg/m2) 0.6 = “Moderate stress” 0.6 < ddVWC (kg/m2) 0.8 = “High stress” ddVWC (kg/m2) > 0.8 = “Very high stress”
Fig. 3 Temporal dynamics of diurnal difference vegetation water content (ddVWC) over flooded rice and Vidarbha meteorological subdivision
conditions predominated over Vidarbha during 2008. Severe drought condition of Vidarbha in 2009 was well depicted by high frequency of moderate & high stress condition. The August month showed 11 “No stress” days and 6 “Mild stress” in 2005; 10 “Mild stress” days and 15 “Moderate stress” days in 2008; 17 “High stress” days in 2009. The September month gave rise 24 “Mild stress” days in 2005; 18 “Mild stress” days and 9 “Moderate stress” days in 2008; 9 “high stress” days and 17 “Very high stress” days in 2009 over Vidarbha. It was observed that October month consisted of 14 “Mild stress” days and 8 “Moderate stress” days in 2005; 11“Moderate stress” days, 10 “high stress” days in 2008; 12 “Moderate stress” and 17 “high stress” days in 2009. Thus, the temporal dynamics of ddVWC could differentiate the three contrasting year in term of their dryness pattern.
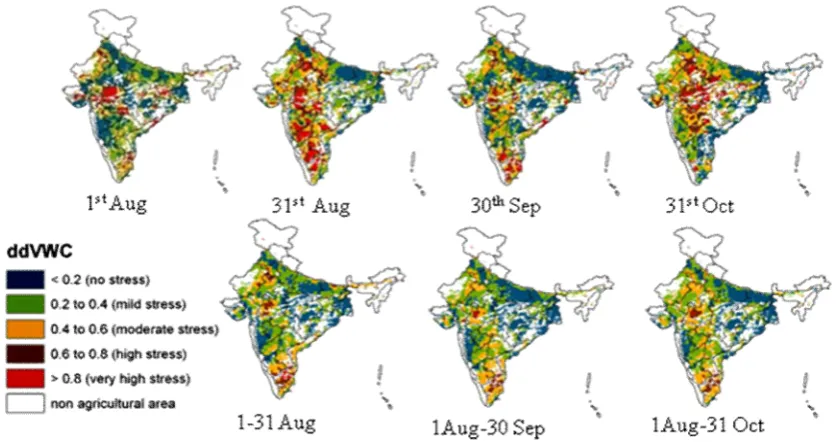
Spatio-temporal dynamics of the ddVWC over the selected meteorological subdivisions of India during August – October 2005 were presented in Fig. 4. Most of the areas over India were found to have mild and no stress condition in 1st August except in the Rajasthan and West Madhya Pradesh. High to very high stress conditions were observed over central deccan plateau and west part of India in 31st August. This was recovered in the subsequent months and further high stress condition was observed in the late October as the crops became dry. The mean composite ddVWC showed normal condition over majority of the meteorological subdivisions of India. The West Madhya Pradesh consistently showed high stress condition throughout the time. Tamilnadu also showed moderate to high stress condition as south-west monsoon (June to September) caused little rainfall over there.
4. Conclusions
The present study utilized the AMSR-E derived vegetation water content data to assess the crop water stress at regional level. The Vegetation water content at predawn and afternoon were found to be different and related to the rainfall/ wet spell. The Diurnal Difference Vegetation Water Content (ddVWC) was found to be significantly related to rainfall particularly over the rainfed regions of India. The ddVWC values were characterized to represent different stress level using flooded rice condition as a benchmark. Inter year comparisons of temporal variations of ddVWC could clearly differentiate the normal and sub-normal years in terms of the intensity and persistence of dryness. The spatial progression of crop water stress was also mapped over India using ddVWC. Such geospatial information on crop water stress condition has potential to contribute significantly for better monitoring and assessment of mid season drought condition over the large geographical area. Due to its high temporal resolution, the information can also be helpful to capture short and intermittent dry spells and can contribute significantly in drought forewarning/preparedness. It is apt to mention here that due to technical snag, AMSR-E stopped providing data from 3 October 2011. But the methodology proposed in the present study can also be adapted for any other satellite derived vegetation water content data such as AMSR2, SMOS, SMAP etc. with suitable modification. Hence, the findings of the present study remain relevant in absence of AMSR-E data.
Fig. 4 Spatio-temporal dynamics of diurnal difference Vegetation Water Content (ddVWC) over India during August – October 2005
ACKNOWLEDGEMENTS:
Authors are thankful to Dr V.K. Dadhwal, Director, National Remote Sensing Centre, ISRO, Hyderabad for his inspiring guidance and encouragement. Authors are grateful to NSIDC for providing Aqua AMSR-E soil moisture data. IMD is duly acknowledged for providing gridded rainfall data. The
TIMESAT software is available online in
http://www.nateko.lu.se/personal/Lags.Eklundh/TIMESAT/tim
esat. Tucker et al. 2004 is duly acknowledged for providing GIMMS NDVI dataset.
REFERENCES
International Journal of Applied Earth Observations and Geoinformations 18, pp. 537-547.
Chakraborty, A., Seshasai, M.V.R., Dadhwal, V.K., 2014. Geo-spatial analysis of the temporal trends of kharif crop phenology metrics over India and its relationships with
rainfall parameters. Environmental Monitoring and
Assessment. DOI 10.1007/s10661-014-3717-6
Chakraborty, A., Seshasai, M.V.R., Murthy, C.S., Rao S.V.C.K., 2013. Assessing early season drought condition using AMSR-E soil moisture product. Geomatics, Natural Hazards and Risk, 4(2), pp. 164-186.
Cowan, I. R. 1965. Transport of water in the soil plant atmosphere system. Journal of Applied Ecology 2, pp. 221-239.
Friesen J., Steele-Dunne, S.C., van de Giesen, N., 2012. Diurnal difference in global ERS scatterometer backscatter observations of the land surface. IEEE Transactions on Geoscience and Remote Sensing, 50 (7), pp. 2595-2602. Garcia-Orellana, Y., Ortuno, M. F., Conejero, W.,
Ruiz-Sanchez, M. C., 2013. Diurnal variations in water relations of deficit irrigated lemon trees during fruit growth period. Spanish Journal of Agricultural Research 11 (1), pp. 137-145.
Jarvis, P. G. 1976. The interpretation of the variations in leaf water potential and stomatal conductance found in canopies in the field. Philosophical Transaction of Royal Society of London . B, 273, pp. 593-610.
Kozlowski, T. T. 1968. Diurnal changes in the diameter of fruit and tree stems of Montmorency cherry. Journal of Horticultural Sciences, 43, pp. 1-15.
Marigo, G., Peltier, J. P., 1996. Analysis of the diurnal change in osmotic potential in leaves of Fraxinus excelsior L. Journal of Experimental Botany, 47 (299), pp. 763-769. Njoku, E. G., Li, L., 1999. Retrieval of land surface parameters
using passive microwave measurements at 6-18 GHz. IEEE Transactions on Geoscience and Remote Sensing, 37, pp. 79–93.
Njoku, E.G., Entekhabi, D., 1996. Passive microwave remote sensing of soil moisture. Journal of Hydrology, 184, pp. 101–129.
Rajeevan, M., Bhate J., 2009. A high resolution daily gridded rainfall dataset (1971–2005) for mesoscale meteorological studies. Current Science 96(4), pp. 558–562.
Steele-Dunne, S. C., Friesen, J., van de Giesen, N., 2012. Using Diurnal variation in backscatter to detect vegetation water stress. IEEE Transactions on Geoscience and Remote Sensing, 50(7), pp. 2618-2629.