ON OUTLIER DETECTION IN A PHOTOGRAMMETRIC MOBILE MAPPING
DATASET
C. Taglioretti a, A. M. Manzino a, T. Bellone a, I. Colomina b
a
DIATI Department, Politecnico di Torino, Corso Duca degli Abruzzi 24, 10129 Torino, Italy - (cinzia.taglioretti, ambrogio.manzino, tamara bellone)@polito.it
b
Geomatics Division, GEON Department, Centre Tecnològic Telecomunicacions Catalunya, Parc Mediterrani de la Tecnologia (PMT) Building B4, Av. Carl Friedrich Gauss 7, 08860 Castelldefels, Spain - [email protected]
KEY WORDS: Mobile Mapping, relative orientation, outlier detection, robust statistical, RANSAC, Forward Search
ABSTRACT:
Various types of technology are used for Terrestrial Mobile Mapping (TMM) such as IMU, cameras, odometers, laser scanner etc., which are integrated in order to determine the attitude and the position of the vehicle in use, especially in the absence of GNSS signal i.e. in an urban canyon.
The aim of this study is to use only photogrammetric measurements obtained with a low cost camera (with a reduced focal length and small frames) located on the vehicle, in order to improve the quality of TMM solution in the absence of a GNSS signal. It is essential to have good quality frames in order to solve this problem. In fact it is generally quite easy to extract a large number of common points between the frames (the so-called ‘tie points’), but this does not necessarily imply the goodness of the matching quality, which might be uncorrected due to the presence of obstacles that may occlude the camera sight. The Authors used two different methods for solving the problem of the presence of outliers: RANSAC and the Forward Search.
In this article the Authors show the results obtainable with good quality frames (frames without occlusions) and under difficult conditions that simulate better reality.
1. INTRODUCTION
In an urban TMM relief the presence of repetitive objects (Fan et al, 2011) such as urban design elements, similar cars or buildings characterized by a regular distribution of windows on various floors, etc., could create interference in the matching of the points between the frames (the so-called ‘tie points’, TPs). Situations of this kind can generate outliers or divergence of the software used for the matching. The Authors are not interested in studying the efficiency of this software but they would like to investigate how to obtain clear datasets without outliers that can negatively affect the quality of the relative orientation solution between couples of frames. In fact, this type of error can also influence the subsequent block adjustment phase of triangulation.
The aim of this study is to use only photogrammetric measurements obtained with a low-cost camera (with a reduced focal length and small frames) installed on the vehicle in order to improve the quality of TMM solution in the absence of a GNSS signal (Cazzaniga et al, 2007; De Agostino et al, 2011).
2. SITUATIONS WHICH CAN GENERATE OUTLIERS
It is generally quite easy to extract a large number of common points between the frames, but this does not necessarily imply the goodness of the matching quality, which might be uncorrected due to the presence of obstacles which may occlude the camera sight.
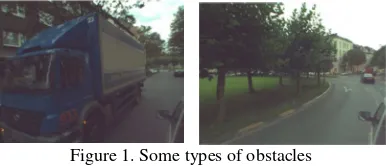
As already mentioned in the introduction there are many situations which can affect the quality of the relative orientation solution and that can determine the goodness or the ineffectiveness of the matching: the quality of the frames; the level of illumination; the dimension of the streets; the type of trajectory and the presence of obstacles such as large trees or vehicles in front of the camera sight (Figure 1). The quality of the frames depends on the quality of the camera: according to
the current trends of research, TMM relief is carried out with a low-cost camera (Lynx Optech) characterized by small focal length and small frames and therefore characterized by low resolution (Colomina et al, 2008).
It is therefore clear that with a good level of illumination it is possible to extract a higher number of good-quality tie points than with a low level of illumination, although this problem can be easily solved by using software that is able to modify the image radiometric improvement before matching the tie points. Various types of trajectory (rectilinear or curvilinear) influence matching quality: in fact by using a rectilinear rather than curvilinear trajectory, it is possible to obtain a different number of extracted TPs of various levels of quality due to perspective problems, especially if the trajectory is curvilinear (Alsadik et al, 2013).
A more complex problem is the presence of obstacles of various kinds that may occlude the camera sight. In fact in an urban design there are many large trees and/or vehicles that make it difficult to match the TPs.
Figure 1. Some types of obstacles
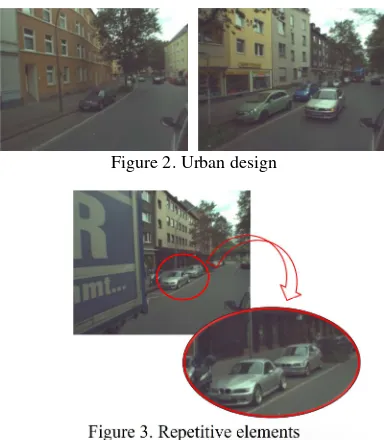
Another typical urban situation that can create problems in matching is the presence of repetitive objects (Fan et al, 2011 and Novák et al, 2011): i.e. the regular distribution of windows on the various floors of buildings can determine an uncorrected matching (Figure 2) between the TPs of successive frames and the presence of similar nearby cars could generate confusion (Figure 3).
Figure 2. Urban design
Figure 3. Repetitive elements
The above-described situations are only a few examples of the cases capable of generating outliers in the matching of TPs between successive frames.
The aim of the Authors is to identify a suitable procedure for determining a clean dataset to be used for computing the relative orientation solution as a support to positioning in the absence of a GNSS signal.
3. CASE STUDY
The Authors referred to a TMM dataset collected by TopScan GmbH, Germany, during the FP7 ATENEA project (Angelats and Colomina, 2014; Fernández et al, 2010).
This dataset is related to the city of Dortmund, located in the Bundesland of North Rhine-Westphalia. This city is the largest urban agglomeration in Germany yet it is also a green metropolis: there are urban canyons near green spaces and therefore it is a very interesting case study due to its variety of urban environments.
4. DATA PROCESSING
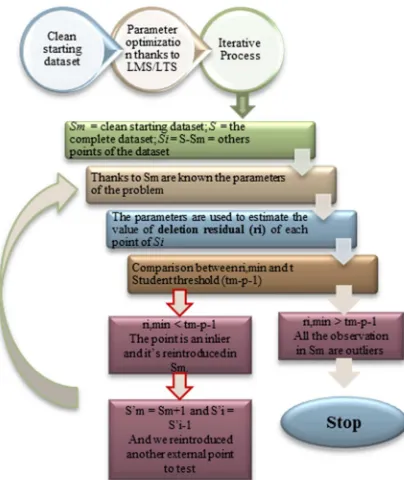
Figure 4 represents the data processing described in this article.
Figure 4. Schema of the data processing
4.1 Partition of the overlap area between the frames
In order to obtain a clean initial dataset the Authors extracted a limited number of points from the dataset in this way: with an aim of equitably distributing internal reliability (the hidden outlier in the measurements), the Authors decided to divide the overlap area between two successive frames into nine zones (Figure 5) and two points were extracted for each zone if present (in black in Figure 5).
Figure 5. An example of the overlap zones: in black the randomly extracted TPs for the robust analysis
The last aim of this study was to determine the solution of a relative asymmetric orientation between successive frames, therefore there were five unknown parameters: three attitudinal parameters plus two positional parameters.
The maximum 18 points enabled us to study a number of possible combinations of five points from a set of 18 useable common points for determining the solution.
The combinations also provide a good distribution of points on the overlap area, in order to guarantee an appropriate result by preventing the localization of the points in a restricted area in respect to a larger overlap area.
Therefore, in order to obtain a good computation of the solution and since it does not imply an improvement in the redundancy distribution, points in the central zone are not required although a homogeneous distribution is preferable in the other zones. In fact, contrastingly to a simulated case study (Taglioretti and Manzino, 2014), in a real case TPs are not well distributed in the overlap area (as shown in Figure 6): the TPs are not evenly distributed in a regular or homogeneous manner, but are usually located in a specific portion of the overlap area (Figure 6).
Figure 6. An example of a not homogeneous distribution of TPs Clean dataset
Start
Partition of the overlap area in 9
Extraction of the maximum 18
Outliers LMS or LTS
Inliers
RANSAC
Forward Search Definition of a
clean starting dataset
or
4.2 Robust statistical analysis: LMS and LTS method
As described in the introduction the Authors selected two methods for carrying out the analysis; RANSAC (Hartley and Zisserman, 2004) and the Forward Search (Atkinson and Riani, 2004 and Atkinson et al, 2010) using a “secure clean dataset”. For this purpose two different techniques obtained from the Robust Statistic (Rousseeuw and Leroy, 1987) were used: the LMS (Least Median Square) and the LTS (Least Trimmed Square) methods (Draper and Smith, 1998).
In the LMS method, by combining the points used in the analysis, it is possible to minimize the median of the residuals of the totality of points (18) with respect to the five used in the specific combination. The combination of selected points is then used for computing the solution.
The LTS method is quite similar although it differs thanks to the minimization of the sum of the square of the residuals of the totality of points with respect to the five used in the specific combination. Also in this case the combination of selected points is used for computing the solution.
For each method the value of standardized residual (Eq. 1) was compared to an established threshold obtained from the bibliography (Draper and Smith, 1998):
∑ ∙
∑
↔ (1)
where υstn = standardized residuals
υ = unknown residuals of observations S = scale factor
p = weight of the observations n = number of unknown parameters (5) m = number of observation in use (18)
threshold = adopted according to bibliography = 2.2
The first value of S is shown in the Equation 2:
! "#$% &' ∙ 1.4826 ∙ .1 / 0 1
23 45 (2)
The iterations continue as long as there are no conditions that are capable of stopping (the difference between the values of S in two successive cycle has to be negligible) and in each iteration the observations are re-weighed as one if ,78
(meaning that the observation is an inlier), otherwise as they are re-weighed as zero (meaning that the observation is an outlier).
At the end of the iterations these two robust methods enable us to obtain a first skimming of the data with an initial detection of outliers.
The comparison of the results obtained with each method showed that the LMS method enabled us to obtain a more realistic clear subset relative to the LTS method.
Figure 7 shows the tie points identified by the “software extractor”, yet it is evident that they are not all inliers: in fact some outliers were found using LMS (in green in Figure 8) while no outliers were observed using LTS (Figure 10).
Figure 7. In green the tie point outliers identified by the software extractor
Figure 8. Example of LMS result: outliers in green and inliers in blue (the outlier number “5” is shown in red in the zoom of
Figure 9)
Figure 9. An example of one outlier (5) identified by LMS
In Figure 9 we can see that the outliers identified by the LMS method are in actual fact points which are badly associated by the extractor, therefore in this case LTS is not suitable since it does not identify these outliers (Figure 10).
Figure 10. Example of the LTS result: inliers in blue (there are no outliers)
4.3 RANSAC and Forward Search
At this stage, the solution to the problem is used as the initial dataset for the iterative process of the successive method. After cleaning the data at our disposal by deleting some points identified as outliers, we can now apply either RANSAC or the Forward Search method. In this study we would like to compare the efficiency and the effectiveness of these two methods when
5
they are used for analyzing a real dataset, generated by an urban TMM relief in the absence of a GNSS signal.
We realized an iterative script in Matlab® in order to implement the RANSAC method, or better called RANSAC “paradigm” (Fischer and Bolles, 1981; Hartley and Zisserman, 2004), starting with the clean subset obtained by LMS and by continuing to iterate as long as there were no conditions capable of stopping the iterations (i.e. if the difference between the values of σ02 in two successive cycle is negligible or for a maximum of N iterations established as input). In each iteration this script calculates the value of residual of the totality of the points of the dataset in respect to the solution determined with the clean initial subset (the points obtained following the LMS method), properly re-weighing the points identified as outliers (Figure 11).
In each cycle the points are valued as outliers or inliers: if after an established number of iterations the inliers are less than 50% of the entire dataset (T), the iterations once again use the outliers as the initial dataset, with the aim of using all the points at disposal. This occurred in a case study in which there was a bad distribution of tie points between the frames. A threshold established as input (V) is used for evaluating the type of tie points (outliers or inliers): at the end of the iterative process the residual values are compared to this calibrated threshold.
Figure 11. Schema of the RANSAC algorithm
The Authors implemented another script in Matlab® for the Forward Search (Atkinson and Riani, 2004 and Atkinson et al, 2010).
This method is also iterative yet it differs to RANSAC thanks to the reintroduction of a corrected measurement or an outlier for recalculating the solution in each iteration (Figure 12). In the Forward Search the threshold used for determining outliers is a t Student (tm-p-1), therefore it is essential to know the number of elements considered in each iteration (m), the number of unknown parameters (p) and the percentage of probability to be used (99.9%) in the case study. This threshold is then compared with the values of deletion residual related to the points with the aim of determining the outliers.
This method enables us to carry out an in-depth analysis of the dataset at disposal and try to maximize the number of points that can be used for the successive phase of computation.
Figure 12. Forward Search method
5. RESULTS
Here we show some of the results obtained from the analysis of a real photogrammetric mobile mapping dataset using the methods described above.
The results obtained by the methods applied to the same couple of frames were compared. It is important to note that after applying one method the number of “inliers” may differ to the other, due to the different identification of outliers. Therefore we may have to compare different-sized subsets. In these situations it is preferable to analyze the mean of the residuals of tie points.
We decided to shown the results obtained by three different types of frames which differ in the level of quality (in terms of uniform distribution of the tie points in the overlap area between two successive frames): quite good quality (Figure 13), medium quality (some trees are located in a portion of the frame, like in Figure 14) and bad quality (Figure 15 and Figure 16).
This characterization is due to the level of distribution of points in the frames and by the presence or not of obstacles (i.e. obstacles like trees or trucks). If the tie points are distributed in the whole frames, the frames are classify as “good”, if the tie points are only located in an area we have a frame of “bad” quality.
In the analysis we decide to adopt a restricted number of TP: a compromise between the minimum possible number of TPs (5) and a number of TPs which guarantees an adequate level of redundancy and a good distribution of the points in the area. At the same time we also want to guarantee the quick computation of the solutions of the Robust methods.
This decision is also influenced by the need of having the minimum number of TP required to solve the problem, which is to determine the unknown parameters, and more importantly to ensure an adequate level of redundancy.
Next figures show four stereo pairs taken from the case studies, and in green there are the homologous rays identified by the software extractor.
Figure 13. Example of frames of quite good quality
Figure 14. Example of frames of medium quality
Figure 15. Example of frames of bad quality (presence of obstacles)
Figure 16. Example of frames of bad quality (presence of trees and bad distribution of tie points in the frames)
In the first case, if we consider a couple of frames characterized by a quite good distribution of TPs (Figure 13), we obtained quite good results (Figure 17 and Table 1).
In next figures in blue are represented the inliers, in green the outliers obtained by the LMS method and in red the outliers obtained by RANSAC (one the left) or FS (on the right).
Figure 17. Good quality frame: RANSAC and FS results (blue inliers; green: LMS outliers; red: RANSAC/FS outliers)
In Table 1 we compare the mean of the values of RMS of TPs inliers and outliers, because the number of elements in each dataset is different (n°TP = n°inliers + n°outliers).
This is due to the results of the previous analysis made by LMS method.
Type n°outliers n°TP RMS_inl [pixel]
RMS_outl [pixel]
Good (Figure 13)
RANSAC 11
60 0.75 2.52
FS 25 0.4 1.08
Table 1. Comparison between RANSAC and FS results
The second couple of frames is characterized by a medium level of quality, there are some trees and the TPs are not so well distributed in the area (Figure 18).
Figure 18. Medium quality frame: RANSAC and FS results (blue inliers; green: LMS outliers; red: RANSAC/FS outliers)
In this case study we obtained quite the same numbers of outliers with RANSAC and FS (Table 2).
Type n°outliers n°TP RMS_inl [pixel]
RMS_outl [pixel]
Medium (Figure 14)
RANSAC 11
44 0.75 3.00
FS 14 0.45 1.02
Table 2. Comparison between RANSAC and FS results
The last couples of frames are characterized by a bad level of quality, in each of them there is an obstacle which occludes camera sight (Figure 19 and Figure 20).
Figure 19. Bad quality frame (presence of obstacles): RANSAC and FS results (blue inliers; green: LMS outliers; red:
RANSAC/FS outliers)
Figure 20. Bad quality frame (presence of trees): RANSAC and FS results (blue inliers; green: LMS outliers; red: RANSAC/FS
outliers
Type n°outliers n°TP RMS_inl
Table 3. Comparison between RANSAC and FS results
These frames are characterized by a very high number of outliers, in fact in the first case (Figure 13) a truck occludes the camera sight and in the second the TPs are all located on a tree (Figure 14).
In these difficult situations the extractor of TPs makes some errors in the matching and so it is clear that the number of TPs outliers individuated by each method will be very high (Table 3).
In the second situation (Figure 14), the TPs are located all in the middle of the frames, on a moving element (the tree). For this reason is clear that the number of TPs outliers might be very high, in fact these points are not always located in the same position while the vehicle moves: for example the wind may move the tree and so the TPs. Furthermore the images with patterns (similar things like trees) generate an additional problem, indeed they are a common source of blunders (Figure 20).
6. CONCLUSIONS
In conclusion in this dataset Forward Search generates a more secure results for carrying out the analysis and generally enables us to determine a greater number of outliers compared to RANSAC.
Observing the results we can also see that in each case study RANSAC determines more “noised” results rather than FS, and so this is another advantage of this last method.
FS also guarantees an adequate number of inliers to be used in the analysis. In fact, starting from a restricted subset, this method added the observations closer to the model.
Another advantage of using Forward Search is that it is possible to individuate data clusters characterized by the same level of noise (RMS). These tie points are not necessarily outliers, in fact they may only be characterized by a higher noise level respect to the others (Figure 21).
Figure 21. An example of cluster of data
The TPs individuated as “outliers” by FS are all located in the same part of the frame and are characterized by the same values of RMS (mean of RMS of these “outliers” = 1.34 [pixel]).
Lastly, this clean dataset will be used for computing the unknown parameters and the successive analysis of goodness of the results obtainable from photogrammetric information.
ACKNOWLEDGEMENTS
The Authors would like to thank TopScan (www.TopScan.de), which collected the dataset during the FP7 ATENEA project, and the European Commission.
REFERENCES
Alsadik B., Remondino F., Menna F., Gerke M., Vosselman G., 2013. Robust extraction of image correspondences exploiting the image scene geometry and approximate camera orientation. ISPRS - International Archives of the Photogrammetry, Remote
Sensing and Spatial Information Sciences, Vol. XL-5/W1, pp.
1-7. Doi: 10.5194/isprsarchives-XL-5-W1-1-2013
Angelats E., Colomina I., 2014. One step mobile mapping laser and camera data orientation and calibration. ISPRS - International Archives of the Photogrammetry, Remote Sensing
and Spatial Information Sciences, Vol. XL-3/W1
Atkinson A.C., Riani M.,2004. The Forward Search and Data visualization. Computational Statistics, Vol. 19, pp. 29-54
Atkinson A.C., Riani M., Cerioli A., 2010.The forward search: Theory and data analysis. Journal of the Korean Statistical Society, Vol. 39, pp. 117–134
Cazzaniga N. E., Forlani G., Roncella R., 2007. Improving the reliability of a GPS/INS navigation solution for MM vehicles by photogrammetry, Proceedings of the 5th International Symposium on Mobile Mapping Technology, Padua
Colomina I., Blázquez M., Molina P., Parés M., Wis M., 2008. Towards a new paradigm for high-resolution low-cost photogrammetry and remote sensing. ISPRS - International Archives of the Photogrammetry, Remote Sensing and Spatial
Information Sciences, XXXVII-B1 (2008), pp. 1201–1206
De Agostino M., Lingua A., Marenchino D., Nex F., Piras M., 2011. GIMPHI: a new integration approach for early impact assessment. Applied Geomatics, Vol. 3(4), pp. 241-249
Draper N.R., Smith H., 1998. Applied regression analysis, 3rd edition. Wiley series in probability and statistics. ISBN: 978-0-471-17082-2
Fan B., Wu F., Hu Z., 2011. One the matching of images containing repetitive patterns by pair of interest points. International Conference on Information Science and Technology. 26-28 March 2011, Nanjing, Jiangsu, China
Fernández A.; Diez J.; D. De Castro; F. Dovis, P.F. Silva, P. Friess, M. Wis, I. Colomina, J. Lindenberger, I. Fernández, 2010. ATENEA: Advanced techniques for deeply integrated GNSS/INS/LiDAR navigation. Satellite Navigation Technologies and European Workshop on GNSS Signals and image analysis and automated cartography. Communications of the ACM, Vol. 24 (6), pp. 381-395
Hartley, R., Zisserman, A., 2004. Multiple vie geometry in Computer Vision. Cambridge University Press
Novák D., Baltsavias E., Schindler K., 2011. Reliable image matching with recursive tiling. PIA11 - Photogrammetric Image Analysis, 5-7 October 2011, Munich. Vol 38 (3/W22), pp.49-60. Doi: 10.1007/978-3-642-24393-6_5
Rousseeuw P., Leroy A.M., 1987. Robust regression and outliers detection. Wiley series in probability and mathematical statistics. John Wiley & Sons, Inc. New York, USA
Taglioretti C., Manzino, A. M., 2014. Terrestrial Mobile Mapping: photogrammetric simulator. ISPRS - International Archives of the Photogrammetry, Remote Sensing and Spatial
Information Sciences, XL-3, 333-339,
doi:10.5194/isprsarchives-XL-3-333-2014