Catechin in the Mediterranean diet: vegetable, fruit or wine?
Jean-Bernard Ruidavets
a,*, Pierre-Louis Teissedre
b, Jean Ferrie`res
a,
Ste´phane Carando
b, Guillaume Bougard
c, Jean-Claude Cabanis
baINSERM U518,De´partement d’e´pide´miologie,Faculte´ de me´decine,37Alle´es Jules Guesde,31073Toulouse Cedex,France bLaboratoire de chimie analytique,Faculte´ de Pharmacie,Uni6ersite´ de Montpellier,Montpellier,France
cSer6ice commun de spectrome´trie de masse,Faculte´ de Pharmacie,Uni6ersite´ de Montpellier,Montpellier,France
Received 7 June 1999; received in revised form 12 November 1999; accepted 16 December 1999
Abstract
The aim of this study was to determine which type of diet contributes most to plasma concentration of (+)-catechin, a naturally occurring antioxidant flavonoid. Consecutive subjects (n=180) were screened. A blood sample was collected after a fasting period and (+)-catechin measurement in plasma was performed by high-performance liquid chromatography (HPLC) method using fluorescence detection. Dietary consumption of the last evening meal was assessed by a dietary recall method. Taking fruit, vegetable and wine consumption into account, four types of diet were identified. After adjustment for confounding factors, concentration of (+)-catechin in plasma was three-fold higher in diet with fruit and vegetable but without wine (449.5
mg/l), and four-fold higher in diet with wine but without vegetable and fruit (598.5 mg/l) in comparison to diet without fruit, vegetable and wine (131.6mg/l). When the consumption of vegetable, fruit and wine was combined, the concentration was the highest (637.1mg/l) (PB0.001). Vegetable, fruit and wine were the major determinants of plasma (+)-catechin concentration (PB0.001). This study demonstrates that the highest plasma concentration of (+)-catechin was observed in subjects consuming fruit, vegetable and wine, and its antioxidant and antiaggregant activity could partly explain the relative protection against coronary heart disease (CHD). © 2000 Elsevier Science Ireland Ltd. All rights reserved.
Keywords:Catechin; Flavonoid; Antioxidant; Diet; Wine
www.elsevier.com/locate/atherosclerosis
1. Introduction
Flavonoids from vegetable and fruit intake appear to be inversely related to coronary heart disease (CHD) mortality [1 – 4]. Flavonoids from red wine have been shown to strongly inhibit low-density lipoprotein oxida-tion [5 – 8] both in vitro and in vivo, but also to reduce platelet aggregation [9,10], i.e. significant steps in reduc-ing CHD mortality. In the same way, (+)-catechin, a naturally occurring flavonoid, has been demonstrated to prevent human plasma oxidation [11] and to inhibit oxidation of low-density lipoprotein [12]. Thus, flavonoids may partly explain the protective effects of the Mediterranean diet [13], rich in vegetable, fruit and wine [14], against CHD. The first step in evaluating this hypothesis is to determine to what extent each of these
foodstuffs contributes to antioxidant flavonoid levels in the blood. The aim of this study was to determine which type of diet contributes most to plasma concen-tration of (+)-catechin.
2. Materials and methods
2.1. Population and sampling
A cross-sectional study was carried out from June 1996 to April 1997. A sample of 1183 men and women aged 35 – 65 years and living in the region of Toulouse (south-west of France), an area with low CHD mortal-ity and morbidmortal-ity rates, was recruited [15,16]. The sample was selected at random from the polling lists available in each town hall. Response rate reached 60% of the people contacted. Subjects were screened in a health center administered by the social security system. From the initial sample of 1183 people, 182 (15.4%) * Corresponding author. Tel.: +33-5-61521870; fax: +
33-5-62264240.
E-mail address:[email protected] (J.-B. Ruidavets).
consecutive subjects (100 men and 82 women) were included in the specific study to assess (+)-catechin concentration in plasma in relation to dietary patterns. Participants were volunteers. Subjects were informed of the aim of the study and a formal consent form was completed and signed by each subject. Authorization from the appropriate Ethics Committee was obtained. Subjects were contacted by letter. Those who agreed to participate were given a morning appointment and asked to fast for a period of 10 h minimum. No food and no drink (except water) were allowed during the fasting period.
2.2. Anthropometric, clinical measurements and medical history
Subjects were screened in the morning for cardiovas-cular risk factors by trained nurses. Anthropometric measurements including weight, height, waist and hip circumferences were measured with standardized proce-dures [17]. Body mass index (BMI) and waist-to-hip ratio (WHR) were calculated as follows, weight (kg)/ height (m2) and waist/hip. Blood pressure was
mea-sured twice after a 5-min rest at least in a sitting position using a standard mercury sphygmomanometer. The average of the two blood pressure measurements was used for the analysis.
Questionnaires were administered by interviewers at the examination center. Information on demographic and socio-economic factors, educational level, occupa-tional activity, personal previous history, tobacco con-sumption, drug intake, physical activity and medical problems was collected.
2.3. Dietary measurements
Subjects were asked to have their evening meal be-tween 19:00 and 23:00 h. They were asked not to eat or drink (except water) after 23:00 h and to comply with a minimum fasting period of 10 h before the blood collection on the next morning between 08:00 and 10.30 h. Subjects were instructed not to change anything in their nutritional habits. The average fasting period was 11 h and 55 min (ranging from 10 to 15 h). Food intake was assessed using a food recall method to test the relationship between dietary catechin intake and (+ )-catechin concentration in plasma. After blood collec-tion, subjects were interviewed concerning their last evening meal by a qualified dietitian. Food and drink consumption was carefully verified by the dietitian who, in order to avoid forgotten or misreported data, sub-mitted a list of various food categories to the subjects to check the reliability of the data. Food intake was assessed using estimated weights of food, household measures and portion size. The composition of pre-pared dishes was written down and the actual quantity
consumed calculated according to the number of people sharing the meal, allowing for different portion sizes. For meals, which were not taken at home, the cook was contacted, the composition of the recipes and the por-tion size were recorded. The estimates were facilitated by the use of photographs showing portion sizes and their respective weights. Among the 182 selected sub-jects, two were excluded from the statistical analysis because they had tea during their last meal the day before and the number of subjects was too small to be analyzed. Food data were translated into nutrients us-ing Renaud food composition table [18]. A catechin-food composition table was created using a compilation of the results of the measurements performed for differ-ent plant food and alcoholic beverages already pub-lished in some reports and in some food-composition tables [19 – 23]. This table (Appendix A) gives the cate-chin average values supplied by 100 g of food. It allowed the calculation of the subjects’ total catechin intake, taking into account the subjects’ specific food intake.
To check that the dietary pattern of the evening meals was comparable with their usual nutritional habits, a nutritional study using a 3-day food record method [24] was carried out among a third of the original sample (n=56). Moreover, to check that the alcohol intake during the subjects’ last evening meal was in agreement with their usual drinking habits, a quantitative recall frequency questionnaire was filled in, specifying for each day of the week, each type of alcoholic beverage intake (wine, beer, spirits, cider or aperitifs) representative of the last 12-month consumption.
2.4. Blood sample collection and biological analysis
A blood sample was collected after a 10-h-fasting period minimum, in tubes containing Na2EDTA, kept
mm, 5 mm particle size) was used as the stationary phase. The solvents used for separation were A, 50 mM dihydrogen ammonium phosphate adjusted to pH 2.6 with orthophosphoric acid; B, 20% A with 80% acetoni-trile; C, 0.2 M orthophosphoric acid adjusted with ammonia to pH 1.5. The column was thermostated at 25° and the flow-rate was 0.7 ml/min. Fluorescence detection was monitored at an excitation wavelength of 280 nm and an emission wavelength of 310 nm. A 0.5-ml aliquot of the plasma sample was placed in an ice bath. Acetonitrile (0.7 ml) was added to effect protein precipitation. The mixture was then centrifuged at 2000×g and +4°C for 4 min. The supernatant was taken into a 1-ml syringe and filtered through a 0.5mm pore size membrane. A 25 ml volume of filtered super-natant was directly injected into the HPLC system. A stock solution of (+)-catechin was prepared by dis-solving 20 mg of the compound in 10 ml of methanol. It was stored at +4°C, and diluted with methanol before use. The stock solution was stable for at least 1 month at +4°C. Calibration curves were constructed by linear regression of the peak-area ratio versus con-centration. Validation of accuracy and precision were satisfactory for both within and between batch assays. With fluorescence detection, coefficients of variation were less than 6.5% and mean relative errors were within 94.8%. The average recovery was 85.3%. The limit of detection and quantification was 40 ng/ml [25]. Identification of catechin in plasma by mass spec-trometer was realized after collection of the HPLC peak, dry evaporation and adjustment for methanol. The sample was introduced in an El-Mass Spectrometer HP5989 via a particle beam interface with an electron energy of 70 eV. Comparison was made with a (+ )-catechin reference standard from Aldrich (F.W. 290.28). The spectrum of the peak compound identified by EI-SM was similar to the spectrum of the catechin reference standard. The levels of (+)-catechin in plasma did not include methylated, sulfated and glu-curonide metabolites.
2.5. Definition of types of diet
Up to now, various works have been interested in the pharmacokinetic aspects of some polyphenols and more particularly catechin. Their aim was to study the rela-tionship between specific food-catechin intake, such as wine or tea, and its levels found in plasma or urine. Actually, under ordinary dietary conditions, catechin bioavailability and more particularly its absorption process may depend not only on the quantity ingested but also on the composition of its various nutriments constituting the alimentary bolus. In our region, dietary catechin originates mainly from fruit, vegetables and wine. Therefore, the first aim of the study was the comparison of plasmatic catechin levels in relation with
four types of diets, each one based upon the intake or not of these nutriments. Despite the fact that tea is an important source of catechin, a specific group could not be created since the number of tea-drinkers was too small. The two tea-drinkers were thus excluded from the analysis. Four types of diets were determined.
Diet type I, subjects who had consumed meat, eggs, fish, dairy products or cereals during their last evening meal but no fruit, no vegetable, no wine and no tea. Diet type II, nutriments that could be found in diet type I and including fruit and vegetable consumption and no wine intake.
Diet type III, nutriments that could be found in diet type I and including wine intake.
Diet type IV, nutriments that could be found in diet type I, and including fruit, vegetables and wine intake.
This classification into four groups may appear artifi-cial and arbitrary but it does correspond to actual nutritional behaviors. Diet type IV could be classified as ‘Mediterranean diet’. Diet type II was identical but excluding wine consumption. Lastly, diet type I was rich in food from animal origin (meat, fish and dairy products), thus comparable to diet type III, which besides, included wine intake.
The average consumption of red wine represented 87.5% of the total wine intake, whereas white and rose´ wines represented 2.9 and 9.6% of the total wine con-sumption, respectively.
2.6. Statistical methods
Statistical significance of the differences between diets were tested by the x2-test for qualitative variables and
3. Results
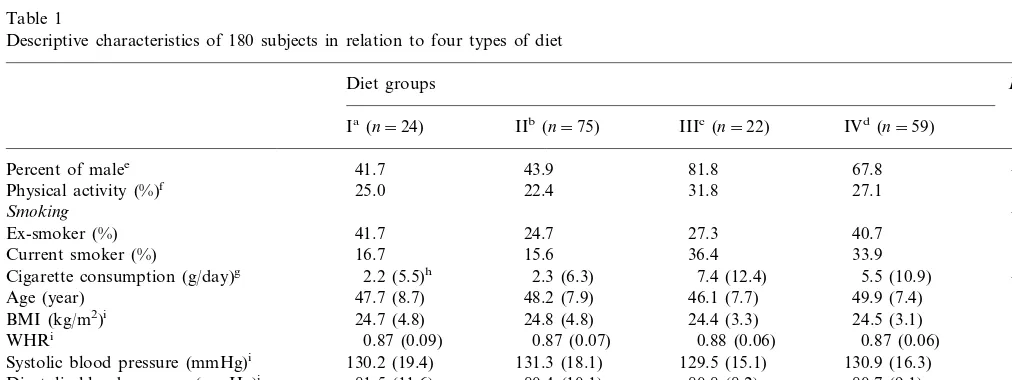
Table 1 shows baseline characteristics of 180 subjects in relation with four types of diet. The proportion of men was higher in diet III and IV, which included wine. In the same way, the percentage of current cigarette smokers was higher among these categories. Cigarette smoking data showed striking differences between sub-jects who drank wine (7.4 and 5.5 g/day of tobacco in diets III and IV, respectively) versus those who did not, in diets I and II tobacco consumption was approxi-mately 2.2 g/day. Lipid profile was characterized by the highest levels of plasma total cholesterol and HDL cholesterol in diets III and IV. Blood levels of triacyl-glycerol were higher in diets with alcohol consumption than in the other diets, but the differences were not significant. No significant difference between the four groups was observed for age, blood pressure, BMI and WHR.
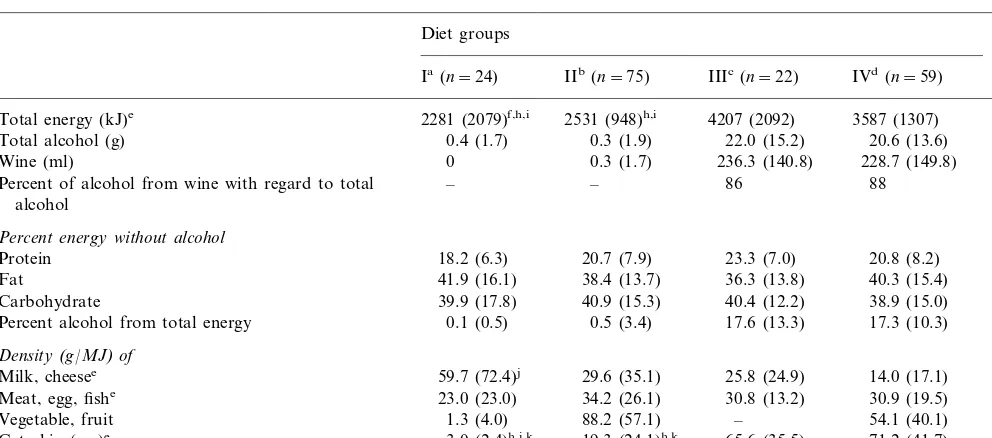
Table 2 presents nutrient (protein, fat, carbohydrate), food (dairy products, meat, egg, fish, vegetable and fruit), alcohol (total alcohol and wine) and catechin intakes. Subjects in diet I and II did not drink wine and those in diet I and III did not consume vegetable and fruit or very marginally. Total energy intake was higher among subjects who drank alcohol and was approxi-mately twice the energy intake of diet I and II. The
highest value (4207 kJ) was observed in diet III. The highest mean values of total energy were due to alcohol intake mainly. Energy supplied by alcohol accounted for 17.6 and 17.3% of total energy intake for diet III and IV, respectively. The highest amount of alcohol was provided by wine consumption ranging from 86 to 88% in diet III and IV, respectively. Diet I was charac-terized by the lowest meat, egg and fish intake, and by the highest consumption of dairy products. The amount of dairy products per MJ (59.7 g/MJ) was in this diet twofold higher than in diet II (29.6 g/MJ) and fourfold-higher than in diet IV (14.0 g/MJ). Comparisons of absolute mean values of catechin intake showed large differences between diet III and IV on the one hand and diet I and II on the other hand. When catechin intake was based on MJ consumed, the differences were smaller. Diet I supplied the lowest amount of dietary catechin (1.4 mg/MJ) when compared with diet II (8.1 mg/MJ) and the difference was more significant when compared with diet IV which included wine consump-tion (20.6 mg/MJ).
BMI was not significantly different in the four diets. In contrast, total energy intake was significantly higher in diets III and IV than in diets I and II. After subtraction of energy supplied by alcohol in the corre-sponding groups, and after adjustment for sex, smoking habits, age and physical activity, no significant
differ-Table 1
Descriptive characteristics of 180 subjects in relation to four types of diet
Diet groups P
Ia (n=24) IIb(n=75) IIIc(n=22) IVd(n=59)
41.7 43.9
Percent of malee 81.8 67.8 B0.001
NS 27.1
31.8
Physical activity (%)f 25.0 22.4
B0.01 Smoking
27.3 24.7
41.7
Ex-smoker (%) 40.7
15.6
Current smoker (%) 16.7 36.4 33.9
B0.05 2.3 (6.3)
Cigarette consumption (g/day)g 2.2 (5.5)h 7.4 (12.4) 5.5 (10.9)
NS 49.9 (7.4)
46.1 (7.7)
Age (year) 47.7 (8.7) 48.2 (7.9)
NS
BMI (kg/m2)i 24.7 (4.8) 24.8 (4.8) 24.4 (3.3) 24.5 (3.1)
WHRi 0.87 (0.09) 0.87 (0.07) 0.88 (0.06) 0.87 (0.06) NS
130.9 (16.3)
129.5 (15.1) NS
131.3 (18.1) 130.2 (19.4)
Systolic blood pressure (mmHg)i
NS 81.5 (11.6)
Diastolic blood pressure (mmHg)i 80.4 (10.1) 80.8 (8.2) 80.7 (9.1)
5.44 (0.88)k 5.84 (0.92)
Total cholesterol (mmol/l)i 5.87 (1.03) 6.16 (1.02) B0.05
HDL cholesterol (mmol/l)i 1.33 (0.34)k 1.48 (0.36) 1.50 (0.27) 1.58 (0.35) B0.05
1.35 (0.95) 1.08 (0.37)
1.21 (0.43)
Triacylglycerol (mmol/l)i,j 1.27 (0.38) NS
aWithout vegetable, fruit and wine. bWith vegetable and fruit.
cWith wine and without vegetable and fruit. dWith wine, vegetable and fruit.
ex2-Test.
fIntense physical activity for at least 20 min, three times a week or more. gOne cigarette=1 g of tobacco, Kruskal–Wallis test.
hX( (S.D.). iAdjusted for sex.
jProcessed after log transformation.
Table 2
Food, nutrient, alcohol and catechin intakes (evening meal) in 180 subjects according to four types of diet
P Diet groups
Ia(n=24) IIb(n=75) IIIc(n=22) IVd(n=59)
2531 (948)h,i 4207 (2092)
Total energy (kJ)e 2281 (2079)f,h,i 3587 (1307) B0.001
Total alcohol (g) 0.4 (1.7) 0.3 (1.9) 22.0 (15.2) 20.6 (13.6) –
0.3 (1.7) 236.3 (140.8)
Wine (ml) 0 228.7 (149.8) –
– – 86 88
Percent of alcohol from wine with regard to total –
alcohol
Percent energy without alcohol
20.7 (7.9) 23.3 (7.0)
18.2 (6.3) 20.8 (8.2)
Protein NS
38.4 (13.7) 36.3 (13.8)
Fat 41.9 (16.1) 40.3 (15.4) NS
40.9 (15.3) 40.4 (12.2)
39.9 (17.8) 38.9 (15.0)
Carbohydrate NS
Percent alcohol from total energy 0.1 (0.5) 0.5 (3.4) 17.6 (13.3) 17.3 (10.3) Density(g/MJ)of
29.6 (35.1) 25.8 (24.9)
Milk, cheesee 59.7 (72.4)j 14.0 (17.1) B0.001
34.2 (26.1) 30.8 (13.2)
23.0 (23.0) 30.9 (19.5)
Meat, egg, fishe NS
88.2 (57.1) –
Vegetable, fruit 1.3 (4.0) 54.1 (40.1) –
19.3 (24.1)h,k 65.6 (35.5)
3.0 (2.4)h,i,k 71.2 (41.7)
Catechin (mg)e B0.001
8.1 (9.3)h,k
Catechin (mg/MJ)e,g 1.4 (1.0)h,i,k 17.9 (11.1) 20.6 (10.9) B0.001
aWithout vegetable, fruit and wine. bWith vegetable and fruit.
cWith wine and without vegetable and fruit. dWith wine, vegetable and fruit.
eKruskal–Wallis test. fX( (S.D.).
gBased on MJ consumed.
hSignificantly different from diet III, PB0.001 (Kruskal–Wallis+Mann–Whitney test). Mann–Whitney significance level adjusted for the
number of pairs.
iSignificantly different from diet IV, PB0.001, (Kruskal–Wallis+Mann–Whitney test). Mann–Whitney significance level adjusted for the
number of pairs.
jSignificantly different from diet IV,PB0.01 (Kruskal–Wallis+Mann–Whitney test). Mann–Whitney significance level adjusted for the number
of pairs.
kSignificantly different from diet II, PB0.001 (Kruskal–Wallis+Mann–Whitney test). Mann–Whitney significance level adjusted for the
number of pairs.
ences in energy intake were observed between the four diets (the average energy intake was, 2266 kJ in diet I, 2554 kJ in diet II, 3164 kJ in diet III and 2771 kJ in diet IV).
Table 3 shows the correlations between the evening meal recall and the 3-day food record for some nutri-ents and foods.
A positive correlation was found between the nutri-tional pattern of the evening meal food recall and the 3-day food record. Pearson correlation coefficients for nutrients ranged from 0.40 for carbohydrates to 0.60 for protein intake. All these relationships were statisti-cally highly significant. For total alcohol, Pearson cor-relation coefficients were 0.70 (PB0.001) when the evening meal recall was compared to the 3-day food record and 0.73 (PB0.001) when the evening meal food recall was compared to the alcohol consumption assessed by the quantitative recall frequency question-naire. The coefficients were similar for wine, 0.69 and 0.80, respectively. The relationship between the evening meal and the 3-day food record was consistent. The
Table 3
Pearson correlations between evening meal food recall and the 3-day food record for some nutrients and food
Nutrients/food r P
0.59
Energy B0.001
Protein 0.60 B0.001
B0.001
Animal protein 0.52
B0.001 0.49
Vegetable protein
Fat 0.45 B0.001
B0.001 0.55
Saturated fatty acids
B0.05 Polyunsaturated fatty acids 0.31
B0.01 0.35
Monounsaturated fatty acids
B0.01
Carbohydrates 0.40
B0.01 0.28
Oligosaccharide
B0.001
Polysaccharide 0.54
Meat 0.34 B0.01
Fruit/vegetable 0.42 B0.01
B0.01 0.35
Dairy products
0.69a–0.73b
Total alcohol B0.001
0.70a–0.80b
Wine B0.001
aBetween evening meal recall and 3-day record. bBetween evening meal recall and weekly recall.
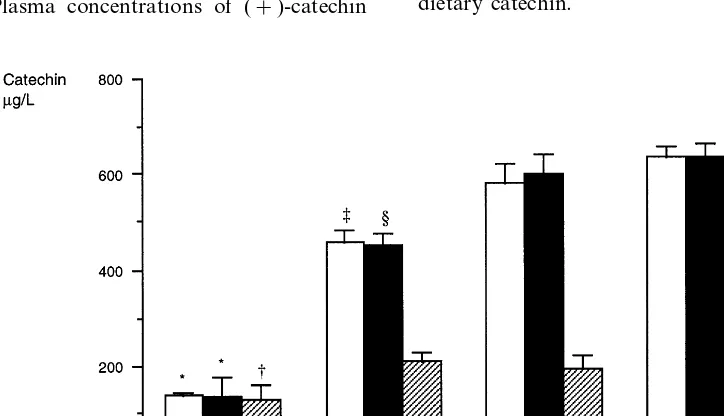
were, 125.8, 209.1, 190.1 and 225.2mg/l in diets I, II, III and IV, respectively.
The relationship between dietary catechin and (+ )-catechin concentration in plasma was evaluated in the entire population sample using the Pearson correlation coefficient (r=0.58, PB0.001). (+)-Catechin concen-tration in plasma depended on the amount of dietary catechin and on the length of the fasting period be-tween the last food intake and the blood collection. In this study, the ratio plasma (+)-catechin/dietary cate-chin was negatively related to the length of the fast (Pearson correlation coefficient= −0.20, PB0.01). The average fasting period was 11 h and 55 min (rang-ing from 10 to 15 h). The length of the fast(rang-ing period was not significantly different between the four types of diet. The average difference was 44 min between diet I (the shortest fasting period, 11 h and 23 min) and diet III (the longest fasting period, 12 h and 7 min). After adjustment for the length of the fasting period, differ-ences in the (+)-catechin concentration in blood re-mained significant.
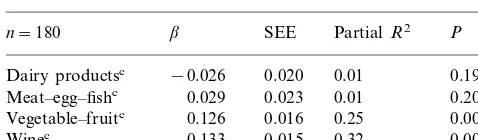
Table 4 shows the contribution of food to plasma concentration of (+)-catechin in a general linear model. Vegetable and fruit and even more wine intake were the major determinants of plasma concentration of (+)-catechin (PB0.001), whereas the contribution of dairy products, meat, egg and fish was marginal. Forty six percent of the variance of (+)-catechin con-centration in plasma was explained by the intake of dietary catechin.
fruit and wine was combined, the (+)-catechin concen-tration had the most elevated level (637.1 mg/l). When plasma concentration of (+)-catechin was based on MJ energy intake, differences between the four diets were smaller. Plasma concentrations of (+)-catechin
Table 4
Contribution of food to plasma concentration of (+)-catechin (mg/
l)a,b
SEE
n=180 b PartialR2 P
0.020
Dairy productsc −0.026 0.01 0.19
Meat–egg–fishc 0.029 0.023 0.01 0.20
0.016 0.25 0.0001 Vegetable–fruitc 0.126
0.015 0.32 0.0001 0.133
Winec
aAnalysis performed with log(catechin). bGeneral linear model.
cExpressed as log(density) in g/MJ for dairy products, meat–egg–
fish, vegetable–fruit and in ml/MJ for wine, coefficient of determina-tion,R2=0.46;PB0.001.
When compared to recent studies, the higher catechin levels found in our study can be explained by the fact that each subject had a complete evening meal and not only a single beverage or food such as, wine [27], tea [28,29], or chocolate [30]. High catechin levels, found in plasma 9 – 12 h after the meal might also be the conse-quence of a higher initial level of catechin before the evening meal (no flavonoid depletion diet), or of cate-chin protection induced by other antioxidants present in blood, either natural, (vitamin E, vitamin C, b -caroten, selenium) or non-natural such as terbutylhy-droquinone added during the plasma manipulation phases before the analysis. As indicated by Chen [31] other components of the diet could have affected plasma concentration and the elimination of flavonoids. Interspecies differences in metabolism of flavonoids were significant and depended on several parameters such as intestinal microflora, able to hydrolyze flavonoid conjugates [32].
For human beings, 3 h after green tea intake, total level of flavonoids such as, epicatechin, epicatechingal-late and epigallocatechingalepicatechingal-late could reach levels up to 1100 ng/ml [33]. These results did not take into account catechin, anthocyanine flavonols such as quercitin and metabolites, and flavonoids might reach higher levels if catechin, anthocyanine, flavonol such as quercitin and metabolite compounds were quantified. Generally, a clear dose – response relationship was not achievable when the subject sample was too small.
A recent comparison between detection limits for plasmatic catechin and derivatives by HPLC – UV, HPLC Coulochem Electrode Array System, HPLC-fluorimetry and GC/MS showed that only the last two had the highest sensitivity close to 3 ng, whereas the others reached 20 ng [34]. Flavonoid levels from plasma found after using different extraction and detection methods reached up to 10% of CV intra-day and inter-day for HPLC – UV and HPLC fluorescence [25], for HPLC Coulochem Electrode Array System [35]. The several stages of plasmatic catechin extraction may have impaired the results due to the potential loss occurring during the various recuperation phases before the injection in HPLC or GC.
Significant individual variability could be observed and so far, no explanation has ever been given. Identi-cal results had already been reported in several studies for flavonoids (epicatechin, epigallocatechin and epigal-locatechingallate). Flavonoid plasmatic levels measured in a small number of subjects (around five or six) within the same period of time after food or beverage intake could be multiplied by six [35]. Finally, in our study, the same methodology used to perform catechin mea-surement among 180 subjects, enabled comparisons of plasma catechin levels between various diets.
Several reports [36 – 39] have shown a positive rela-tionship between alcohol consumption and WHR, but 4. Discussion
The results of this study show that consumption of fruit, vegetable or wine was associated with elevated plasma concentration of (+)-catechin in a free-living population. When diet included both fruit/vegetable and wine, in other words when nutritional patterns were similar to a Mediterranean diet, the highest level of plasma (+)-catechin was observed. Thus, Mediter-ranean diet may provide a great amount of dietary catechin and may account for the highest level of (+)-catechin in plasma. However, based on MJ of energy intake and after adjustment for age, sex, smok-ing habits, BMI, and WHR the differences in (+ )-cate-chin levels found in the various diets were reduced significantly but the highest level was still observed in diet IV. When statistical comparisons were performed on crude data, differences of (+)-catechin concentra-tions in plasma were significant (overall test PB0.001) and paired test showed significant differences too, diet I versus each diet individually and diet II versus diet IV. Plasma concentration in diet II was 27 and 40% lower than in diet III and in diet IV, respectively. When concentration of (+)-catechin in plasma was expressed per MJ energy intake, the overall test remained signifi-cant too but paired comparisons were statistically sig-nificant only for diet I versus the other diets individually. In this case, the differences observed be-tween the diets were smaller, in particular when diet II was compared to diet IV (+8%) and was even inverted when diet II was compared to diet III (−9%). Thus, for the same energy intake, concentrations of (+ )-cate-chin in plasma were similar in diets II, III and IV but were higher (]50%) in these diets than in diet I. If diets III and IV supplied a large amount of catechin, they supplied a large amount of alcohol too. In this study, the average consumption of total alcohol was 21 g per subject.
the impact of specific alcoholic beverages on BMI and on WHR was not clearly demonstrated [40,41]. In this population where wine is the typical alcoholic beverage, people for whom alcohol represented more than 17% of their total energy intake (diets III and IV) had a WHR significantly higher than people for whom alcohol con-sumption represented less than 1% of their total energy intake (diets I and II).
Numerous studies have shown that the Mediter-ranean diet could protect against cardiovascular dis-ease. This protection seems to be influenced by several nutrients or foods, such as a low intake of saturated fat, a high intake of poly- and mono-unsaturated fat, and high fiber and antioxidant vitamin intake [42 – 45]. In addition, epidemiological studies have shown that mod-erate alcohol intake was inversely related to CHD incidence [46 – 57]. Some authors have found that the protective effect of wine was superior to the protective effect of other alcoholic beverages [58 – 60], but these results are being discussed [61 – 63]. Criqui [64] showed that wine and fruit consumption only were correlated with a reduced number of CHD. If we admit that the effect of ethanol on atherosclerosis was similar what-ever the types of alcoholic bwhat-everages, we can hypothe-size that the possible additional and specific effect of wine should be attributed to the non-ethanolic sub-stances of wine. When compared to other alcoholic beverages, red wine contains a lot of phenolic sub-stances [65]. Numerous phenolic compounds found in wine were potent antioxidants in inhibiting LDL oxida-tion in vitro [66]. Inhibioxida-tion of LDL oxidaoxida-tion in vitro by phenolic substances from red wine [5] has raised interest in these non-ethanolic substances. An in vivo study has shown that daily intake of red wine decreased the susceptibility of plasma LDL to lipid peroxidation, whereas white wine consumption induced the opposite effect [6,7,67]. Maxwell [68] showed that the consump-tion of red wine increased the antioxidant activity of human serum by about 15%. Catechin has been shown to delay the consumption of endogenous lipid soluble antioxidant a-tocopherol and b-carotene and to inhibit lipid oxidation [11]. Thus, we have now some promising facts in favor of the hypothesis that any polyphenols may act against CHD, because we have found high concentrations of (+)-catechin in plasma connected with Mediterranean diet, and that catechin has an antioxidant and antiaggregant activity. But we do not forget that nutritional patterns may reflect other social and cultural behaviors, which may account for the differences in CHD incidence and mortality observed in Europe.
Catechin is only one of the numerous compounds of wine and its concentration depends on vine plants, cultivation and vinification process. Catechin in wine has been shown to reduce LDL susceptibility to oxida-tion. However, some studies found that red wine had
no effect on in vivo LDL-oxidation [69]. Also, catechin was able to reduce the progression of atherosclerosis in apolipoprotein E-deficient mice [70]. In addition, it has been shown that dietary catechin and vitamin E inhibit the atherogenesis process via circulating plasma LDL cholesterol in hypercholesterolemic hamsters [71].
This study demonstrates that in subjects consuming Mediterranean foodstuffs, the highest concentration level of (+)-catechin in plasma was observed when wine, fruit and vegetable were consumed. Among these vegetal foodstuffs, red wine appears to be the most effective to produce this effect in a sample of free-living population in the south of France. If, as reported, antioxidant flavonoids, especially catechin, have a sig-nificant protective effect against CHD, red wine and some fruit and vegetables, owing to their flavonoids, may provide the highest protection among all the Med-iterranean foodstuffs which have been tested.
Acknowledgements
This study was funded by Direction Ge´ne´rale de la Sante´ (DGS) and Institut National de la Sante´ et de la Recherche Me´dicale (INSERM). The authors are grate-ful to Dr Audran for assistance in LC/MS support.
Appendix A
3
[1] Knekt P, Ja¨rvinen R, Reunanen A, Maatela J. Flavonoid intake and coronary mortality in Finland: a cohort study. Br Med J 1996;312:478 – 81.
[2] Hertog MGL, Feskens EJM, Hollman PCH, Katan MB, Kromhout D. Dietary antioxidant flavonoids and risk of coro-nary heart disease: the Zutphen elderly study. Lancet 1993;342:1007 – 11.
[3] Hertog MGL, Kromhout D, Aravanis C, Blackburn H, Buzina R, Fidanza F, Giampaoli S, Jansen A, Menotti A, Nedeljkovic S. Flavonoid intake and long-term risk of coronary heart disease and cancer in the seven countries study. Arch Intern Med 1995;155:381 – 6.
[4] Rimm EB, Katan MB, Ascherio A, Stampfer MJ, Willett WC. Relation between intake of flavonoids and risk for coronary heart disease in male health professionals. Ann Intern Med 1996;125:384 – 9.
[5] Frankel EN, Waterhouse A, Kinsella J. Inhibition of oxidation
of human low density lipoprotein by phenolic substances in red wine. Lancet 1993;341:454 – 7.
[6] Kondo K, Matsumoto A, Kurata H, Tanahashi H, Koda H, Amachi T, Itakura H. Inhibition of oxidation of low-density lipoprotein with red wine. Lancet 1994;344:1152.
[7] Fuhrman B, Lavy A, Aviram M. Consumption of red wine with meals reduces the susceptibility of human plasma and low-den-sity lipoprotein to lipid peroxidation. Am J Clin Nutr 1995;61:549 – 54.
[8] Hollman PC, Katan MB. Absorption, metabolism and health effects of dietary flavonoids in man. Biomed Pharmacother 1997;51:305 – 10.
[9] Landofi R, Mower R, Steiner M. Modification of platelet func-tion and arachidonic acid metabolism by flavonoids. Biochem Pharmacol 1984;33:1525 – 30.
[10] Demrow H, Slane P, Qureshi A, Folts J. Administration of wine and grape juice inhibits in vivo platelet activity and thrombosis in stenosed canine coronary arteries. Circulation 1995;91:1182 – 8.
[11] Lotito SB, Fraga CG. Catechin prevents human plasma oxida-tion. Free Radic Biol Med 1998;24:435 – 41.
[12] Mangiapane H, Thomson J, Salter A, Brown S, Bell GD, White DA. The inhibition of oxidation of low density lipoprotein by (+)-catechin, a naturally occurring flavonoid. Biochem Pharma-col 1992;43:445 – 50.
[13] De Lorgeril M, Renaud S, Mamelle N, Salen P, Martin JL, Monjaud I, Guidollet J, Touboul P, Delaye J. Mediterranean alpha-linoleic acid rich-diet in the secondary prevention of coro-nary heart disease. Lancet 1994;343:1454 – 9.
[14] Evans AE, Ruidavets JB, McCrum EE, Cambou JP, McClean R, Douste-Balzy P, McMaster D, Bingham A, Patterson CC, Richard JL, Mathewson ZM, Cambien F. Autres pays, autres coeurs? Dietary patterns, risk factors and ischaemic heart disease in Belfast and Toulouse. Q J Med 1995;88:469 – 77.
[15] Tunstall-Pedoe H, Kuulasmaa K, Amouyel P, Arveiler D, Ra-jakangas AM, Pajak A. Myocardial infarction and coronary deaths in the world health organization MONICA project. Reg-istration procedures, event rates, and case-fatality rates in 38 populations from 21 countries in four continents. Circulation 1994;90:583 – 612.
[16] Ferrie`res J, Cambou JP, Ruidavets JB, Pous J. Trends in acute myocardial infarction prognosis and treatment in southwestern France between 1985 and 1990 (the MONICA project-Tou-louse). Am J Cardiol 1995;75:1202 – 5.
[17] Tunstall-Pedoe H. The World Health Organization MONICA project (MONItoring of trends and determinants in CArdiovas-cular disease): major international collaboration. J Clin Epi-demiol 1988;41:105 – 13.
[18] Renaud S, Attier NC. La composition des aliments. Ed IN-SERM, 1986.
[19] Jougla-Pelissier H. Cate´chines dans le re`gne ve´ge´tal: teneurs-ef-fets potentiels sur la sante´. Thesis of Pharmacology, University of Montpellier, 1997.
[20] Souci SW, Fachman N, Kraut H. Food Composition and Nutri-tion Tables. Stuttgart, Wissenschaftiche Verlag Gmbh, 1989. [21] Hermann K. U8ber die gehalte der hauptsa¨chlichen
pflanzenphe-nole im obst. Flu¨ssiges Obst 1992;2:66 – 70.
[22] Teissedre PL, Waterhouse AL, Walzem RH, German JB, Frankel EN, Ebeler JE, Clifford AJ. Les compose´s phe´noliques du raisin et du vin. Bull OIV 1996;69:251 – 77.
[23] Moll M, Flayeux TV. Composition et flaveurs des bie`res. Bie`res et coolers 1991:266 – 335.
[25] Carando S, Teissedre PL, Cabanis JC. Comparison of (+ )-cate-chin determination in human plasma by high-performance liquid chromatography with two types of detection: fluorescence and ultraviolet. J Chromatogr B Biomed Sci Appl 1998;707:195 – 201. [26] SAS Institute Inc. SAS/STAT User’s Guide:The GLM
Proce-dure, 6.03 ed. Cary, NC: SAS Institute Inc, 1990.
[27] Donovan JL, Bell JR, Kasim-Karakas S, German JB, Walzem RL, Hansen RJ, Waterhouse AL. Catechin is present as metabo-lites in human plasma after consumption of red wine. J Nutr 1999;129:1662 – 8.
[28] Nakagawa K, Miyazawa T. Absorption and distribution of tea catechin, (−)-epigallocatechin-3-gallate, in the rat. J Nutr Sci Vitaminol 1997;43:679 – 84.
[29] Pietta P, Simonetti P, Gardana C, Brusamolino A, Morazzoni P, Bombardelli E. Catechin metabolites after green tea infusions. Biofactors 1998;8:111 – 8.
[30] Richelle M, Tavazzi I, Enlsen M, Offord EA. Plasma kinetics of epicatechin from black chocolate. Eur J Clin Nutr 1999;53:22 – 6. [31] Chen L, Lee MJ, Li H, Yang CS. Absorption, distribution, elimination of tea polyphenols in rats. Drug Metab Dispos 1997;25:1045 – 50.
[32] Piskula MK, Terao J. Accumulation of (−)-epicatechin metabo-lites in rat plasma after administration and distribution of conju-gation enzymes in rat tissues. J Nutr 1998;128:1172 – 8. [33] Yang CS, Chen L, Lee MJ, Balentine D, Kuo MC, Schantz SP.
Blood and urine levels of tea catechins after ingestion of different amounts of green tea by human volunteers. Cancer Epidemiol Biomarkers Prev 1998;7:351 – 4.
[34] Donovan J, Luthria DL, Stremple P, Waterhouse AL. Analysis of (+)-catechin, (−)-epicatechin and their 3%-and 4%-O -methy-lated analogs. A comparison of sensitive methods. J Chromatogr B Biomed Sci Appl 1999;726:277 – 83.
[35] Lee MJ, Wang ZY, Li H, Chen L, Sun Y, Gobbo S, Balentine DA, Yang CS. Analysis of plasma and urinary tea polyphenols in human subjects. Cancer Epidemiol Biomarkers Prev 1995;4:393 – 9.
[36] Suter PM, Maire R, Veter W. Is an increased waist:hip ratio the cause of alcohol-induced hypertension? The AIR94 study. J Hypertens 1995;13:1857 – 62.
[37] Slattery ML, McDonald A, Bild DE, Caan BJ, Hilner JE, Jacobs DR, Jr, Liu K. Associations of body fat and its distribution with dietary intake, physical activity, alcohol and smoking in blacks and whites. Am J Clin Nutr 1992;55:943 – 9.
[38] Laws A, Terry RB, Barret-Connor E. Behavioral covariates of waist-to-hip ratio in Rancho Bernado. Am J Public Health 1990;80:1358 – 62.
[39] Armellini F, Zamboni M, Frigo L, Mandragona R, Robbi R, Micciolo R, Bosello O. Alcohol consumption, smoking habits and body fat distribution in Italian men and women aged 20 – 60 years. Eur J Clin Nutr 1993;47:52 – 60.
[40] Gutierrez-Fisac JL, Rodriguez-Artalejo F, Rodriguez-Blas C, del Rey-Calero J. Alcohol consumption and obesity in the adult population of Spain. J Epidemiol Community Health 1995;49:108 – 9.
[41] Colditz GA, Giovannucci E, Rimm EB, Stampfer MJ, Rosner B, Speizer FE, Gordis E, Willett WC. Alcohol intake in relation to diet and obesity in women and men. Am J Clin Nutr 1991;54:49 – 55.
[42] Keys A. Coronary heart disease in seven countries. Circulation 1970;41:162 – 83.
[43] Renaud S, Lorgeril M. Wine, alcohol, platelets, and the French paradox for coronary heart disease. Lancet 1992;339:1523 – 6. [44] Gey F, Puska P, Jordan P, Moser K. Inverse correlation between
plasma vitamin E and mortality from ischaemic heart disease in cross-cultural epidemiology. Am J Clin Nutr 1991;53:326 – 34. [45] Artaud-Wild S, Connor S, Sexton G, Connor W. Differences in
coronary mortality can be explained by differences in cholesterol
and saturated intakes in 40 countries but not in France and Finland. A paradox. Circulation 1993;88:2771 – 9.
[46] Marmot MG, Rose G, Shipley MJ, Thomas BJ. Alcohol and mortality: a U-shaped curve. Lancet 1981;1:580 – 3.
[47] Kozarevic D, Demirovic J, Gordon T, Kaelber CT, McGee D, Zukel WJ. Drinking habits and coronary heart disease: the Yugoslavia cardiovascular disease study. Am J Epidemiol 1982;116:748 – 58.
[48] Friedman LA, Kimball AW. Coronary heart disease mortality and alcohol consumption in Framingham. Am J Epidemiol 1986;124:481 – 9.
[49] Moore RD, Pearson TA. Moderate alcohol consumption and coronary artery disease. A review. Medicine 1986;65:242 – 67. [50] Jackson R, Scragg R, Beaglehole R. Alcohol consumption and
risk of coronary heart disease. Br Med J 1991;303:211 – 6. [51] Rimm EB, Giovannucci EL, Willett WC, Colditz GA, Ascherio
A, Rosner B, Stampfer MJ. Prospective study of alcohol con-sumption and risk of coronary disease in men. Lancet 1991;338:464 – 8.
[52] Rimm EB, Klatsky A, Grobbee D, Stampfer MJ. Review of moderate alcohol consumption and reduced risk of coronary heart disease: is the effect due to beer, wine, or spirits? Br Med J 1996;312:731 – 6.
[53] Klatsky AL. Epidemiology of coronary heart disease-influence of alcohol. Alcohol Clin Exp Res 1994;18:88 – 96.
[54] Camargo CA, Jr, Stampfer MJ, Glynn RJ, Grodstein F, Gaziano JM, Manson JE, Buring JE, Hennekens CH. Moderate alcohol consumption and risk for angina pectoris or myocardial infarction in US male physicians. Ann Intern Med 1997;126:372 – 5.
[55] Tunstall-Pedoe H, Woodward M, Tavendale R, A’Brook R, McCluskey MK. Comparison of the prediction by 27 different factors of coronary heart disease and death in men and women of the Scottish heart health study: cohort study. Br Med J 1997;315:722 – 9.
[56] Thun M, Peto R, Lopez A. Alcohol consumption and mortality among middle-aged and elderly US adults. New Engl J Med 1997;337:1705 – 14.
[57] Renaud S, Gue´guen R, Sckenker J, d’Houtaud A. Alcohol and mortality in middle-aged men from eastern France. Epidemiol-ogy 1998;9:184 – 8.
[58] Rosenberg L, Slone D, Shapiro S, Kaufman DW, Miettinen OS, Stolley PD. Alcoholic beverages and myocardial infarction in young women. Am J Public Health 1981;71:82 – 5.
[59] Goldberg DM. Does wine work? Clin Chem 1995;41:14 – 6. [60] Gronbaek M, Deis A, Sorensen T, Becker U, Schnohr P, Jensen
G. Mortality associated with moderate intakes of wine, beer, or spirits. Br Med J 1995;310:165 – 9.
[61] Hennekens CH, Willett W, Rosner B, Cole DS, Mayrent SL. Effects of beer, wine, and liquor in coronary deaths. J Am Med Assoc 1979;242:1973 – 4.
[62] Marques-Vidal P, Ducimetie`re P, Evans A, Cambou JP, Arveiler D. Alcohol consumption and myocardial infarction: a case-con-trol study in France and Northern Ireland. Am J Epidemiol 1996;143:1089 – 93.
[63] Klatsky L, Armstrong MA, Friedman G. Red wine, white wine, liquor, beer, and risk for coronary artery disease hospitalization. Am J Cardiol 1997;80:416 – 20.
[64] Criqui MH, Ringel BL. Does diet or alcohol explain the French paradox? Lancet 1994;344:1719 – 23.
[65] Havsteen B. Flavonoids, a class of natural products of high pharmacological potency. Biochem Pharmacol 1983;32:1141 – 8. [66] Teissedre PL, Frankel EN, Waterhouse AL, Peleg H, German
[67] Miyagi Y, Miwa K, Inoue H. Inhibition of human low-density lipoprotein oxidation by flavonoids in red wine and grape juice. Am J Cardiol 1997;80:1627 – 31.
[68] Maxwell S, Cruiskshank A, Thorpe G. Red wine and antioxi-dant activity in serum. Lancet 1994;344:193 – 4.
[69] de Rijke YB, Demacker PN, Assen NA, Sloots LM, Katan MB, Stalenhoef AF. Red wine consumption does not affect oxidiz-ability of low-density lipoproteins in volunteers. Am J Clin Nutr 1996;63:329 – 34.
[70] Hayek T, Fuhrman B, Vaya J, Rosenblat M, Belinky P,
Cole-man R, Elis A, Aviram M. Reduced progression of athero-sclerosis in apolipoprotein E-deficient mice following consump-tion of red wine, or its polyphenols quercitin or catechin, is associated with reduced susceptibility of LDL to oxidation and aggregation. Arterioscler Thromb Vasc Biol 1997;17:2744 – 52.
[71] Xu R, Yokoyama WH, Irving D, Rein D, Walzem RL, German JB. Effect of dietary catechin and vitamin E on aortic fatty streak accumulation in hypercholesterolemic hamsters. Atherosclerosis 1998;137:29 – 36.