DEVELOPMENT OF A MULTI-SENSOR SYSTEM FOR ROAD CONDITION MAPPING
A.Miraliakbari, M. Hahn
Department of Geomatics, Computer Science and Mathematics, University of Applied Sciences Stuttgart, Schellingstraße 24, 70174 Stuttgart, Germany, - (alvand.miraliakbari, michael.hahn)@hft-stuttgart.de
H-G. Maas
Institute of Photogrammetry and Remote Sensing, Technische Universität Dresden, Helmholtzstr. 10, 01069, Dresden, Germany, - [email protected]
Commission I, IAG5
KEY WORDS: Spectrometer, Camera, Laser scanner, GPS/INS, Sensor Integration, Road Condition, Mapping
ABSTRACT
We present a concept for a vehicle based road condition mapping system using infrared spectrometers, high resolution RGB cameras and a laser scanner. Infrared spectrometry is employed to monitor the deterioration of the surface material and pavement condition, in particular by aging. High resolution RGB imaging enables automatic asphalt crack detection and provides base images for spectrometry spots. Laser scanning aims at the detection of geometrical road irregularities and pavement failures such as potholes and ruts. These three major recordings contribute to the analysis of the pavements condition. All mapping sensors are synchronised with a navigation sensor to collect geo-referenced data. The concept of road condition mapping relies on a separate analysis of the different sensor data which are related to road sections. Processing results like the percentage of the road section area related to cracks, pot holes, ruts etc. are merged to achieve an assessment for the road section. The processes for assessing deterioration from the spectrometer data, the detection of ruts from the laser data and cracks from the images are discussed in detail and outlined with some experiments.
1. INTRODUCTION
Precise information about the pavement condition is a key issue for the overall management of transportation infrastructure (Herold et al., 2003). The public road networks are degrading in many places, as necessary investments are postponed or withdrawn. In order to deploy available means in a most serviceable way, the evaluation and geo-referenced mapping of the pavement quality is an indispensable prerequisite for maintenance management. Manifest asphalt failures like pot-holes, cracks etc. entail significant geometrical perturbations of the smooth road surface; therefore most of the recent research has focused only on geometrical irregularities of the uppermost road layer; aside from asphalt failures, surface roughness is a widely considered geometric condition parameter (FGSV, 2001). Such investigations benefit most from high precise surveys of road surfaces, in particular by laser scanners or laser profilers. On the other hand, the gradual ageing process of asphalt which is triggered by erosion of the organic components (bitumen) and molecular restructuring, leads to reduced elasticity of the asphalt material. Reduced elasticity of material is not necessarily accompanied by geometric changes, however. Good indicators for the ageing are reflectivity curves or spectral signatures, which show more or less distinct absorption features in characteristic wavelength ranges. Such data can be captured by spectrometers or hyperspectral cameras; they have been rarely used for road condition assessment so far.
Several commercial surveying companies have focused on road surface data acquisition using vehicle-based mobile mapping systems. The major concern of these companies is to capture high resolution images and dense laser point clouds. TÜV Rheinland Schniering GmbH e.g. has employed laser profilers along and across the driving direction to measure the
unevenness in both longitudinal and transverse directions. Some other parameters such as general unevenness, virtual water depth or International Roughness Index (IRI) are derived from those profile data. From mobile acquired images, which are taken at very small exposure times of ~1/50000 s in order to avoid motion blur, even tiny cracks can be detected (TÜV Rheinland, 2014). Another service provider called 3D Mapping uses two laser scanners on its mobile road mapping system MoSES; positioning accuracies of about 2 cm and relative laser point measurement accuracies to captured objects of 5 mm are reported (3D Mapping, 2014).
In the present paper we consider each of the above-mentioned sensors separately and investigate its benefit for the assessment of road pavement conditions. In a second step, the data from the three sensors will be integrated in a common framework for road condition mapping; however, this procedure is only briefly addressed here.
There have been several relevant studies related to pavement condition mapping. However, very few reports exist about the use of vehicle-based spectrometry. (Herold et al., 2004) have investigated the spectral properties of materials in urban areas. The part of their research which is related most to our study is the utilization of the field spectrometry for a separability analysis of road conditions. The authors focused on the wavelength range from 350 nm to 2400 nm. Most significant is an increase in the overall reflectance as the asphalt deteriorates. In the wavelength range between near infra-red (NIR) and SWIR the shape of the spectral signatures changes from convex to concave. The regular asphalt ageing is effected by reactions with the atmospheric oxygen, photochemical response with the solar radiation and heat impact. The authors have verified the process of iron oxidization for older asphalts by considering the The International Archives of the Photogrammetry, Remote Sensing and Spatial Information Sciences, Volume XL-1, 2014
iron-oxide absorption features demonstrated at 520 nm, 670 nm and 870 nm.
(Segl et al., 2003) have discussed the end-member detection in urban environments using hyperspectral HyMap data. The spectrometry in an urban environment is a difficult task due to the spectral variability as a result of age, illumination and shadowing effects of the surface materials. The authors were interested in spectral characteristics (spectral features) of the surface materials such as depth of absorption bands, ratio, mean and root mean square. Moreover, a classification was performed in a further section using 61 features. They used a multilayer perception algorithm with a hidden layer for each class in order to permit non-linear classification. A backpropagation algorithm was applied in order to achieve supervised learning. The overall accuracy of the calculated confusion matrix was 90 - 100% (Segl et al., 2003). (Heiden et al., 2007) have determined spectral features for urban surface materials, which separate different material classes robustly, irrespective of within-class variations in the spectral signatures.
Several methods have been developed for automatic crack detection. (Mancini et al., 2013) have detected cracks from mobile recorded images. They applied Gradient Vector Flow snake and fuzzy logic techniques. (Maas, 2012) presents the Fly-fisher algorithm for crack detection which is based on edge detection through gradient operators. (Wei et al., 2010) have proposed a method based on the Beamlet transform in order to detect the pavement cracks from raster images. They have reported about a method which is robust against noise. Other possible methods for crack detection comprise support vector machine (Marques, 2012), wavelet transform (Subirats et al., 2004) and local binary pattern (Hu et al., 2010). (Kertész et al., 2008) have introduced a cost efficient road pavement mapping system for pothole and crack recognition. They equipped a van vehicle with a GPS/INS unit, an RGB camera and a laser projector (5 mW, 660 nm Lasiris laser diode). The projected laser line is detected in the image. By taking advantage of the known geometric relationships between laser line and camera the height profile in space can be reconstructed and height changes on the track can be analysed. (Mertz, 2011) has used a laser line striper to detect asphalt failure. 3D shape of buckled pavements was reconstructed using a video camera and a camera plus laser line striper.
In the following we present a concept for a vehicle based road condition mapping system using infrared spectrometers, high resolution RGB cameras and a laser scanner. By processing infrared spectrometer data we want to analyse the deterioration of surface material. Further we present a procedure for asphalt crack detection using high resolution RGB images. Another process will analyse the recorded laser point cloud to detect pavement failures such as potholes and ruts and estimate virtual water depth. These three major recordings contribute to the analysis of the pavement condition. All mentioned sensors are integrated with a GNSS aided inertial navigation system (GNSS/INS) on a platform. With this experimental setup geo-referenced data are captured with all sensors simultaneously.
After a short description on all involved sensors in the next section, data acquisition is outlined in section 3. Driving speed of the vehicle and recording rates of the sensors have to carefully adjusted to achieve the desired laser point density and the desired overlap between the captured images. The concept for our vehicle based road condition mapping system is presented in section 4 together with the algorithmic developments for analysing the sensor data. First processing
results illustrate the suitability of the development. Conclusion and prospects are presented in the last chapter.
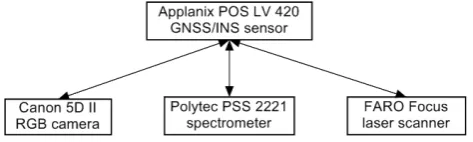
2. SENSOR SPECIFICATION AND INTEGRATION 330) and a GNSS-aided inertial navigation system (Applanix POS LV 420) are integrated on a platform which is mounted on the top of a van.
Figure 1. Sensor system used for road condition mapping
Our Polytec spectrometer (Polytec PPS 2221) is equipped with an artificial light source included inside the spectrometer head. While the spectrometer essentially registers light intensities in many contiguous wavelength bands, reflectivity values can be derived as the ratio between the registered and the emitted
intensity (“inner reference”). The reflectivity curve is characteristic for the respective material. The spectrometer consists of the following three components: the sensor head which concentrates and transfers the light into the polychromator, the polychromator which splits the incoming light into different wavelengths, and an SMA fiber connector which interfaces the polychromator and the sensor head (Polytec, 2011a). Polytec PPS 2221 registers reflectivity in 256 contiguous channels with a resolution of ca. 4 nm (relating to 1 sensor pixel) in the spectral range of 1253 to 2259 nm. In our approach the sensor head (Polytec, 2011b) of the spectrometer is mounted at the backside of the vehicle in order to keep the distance between the road surface and the sensor small (30 to 50 cm). A special protection was designed in order to insulate the sensor head from external light sources. The spectrometer must only register the light emitted by the artificial lamp.
In contrast to hyperspectral cameras, spectrometers register only data on one measuring spot at a time; therefore the observation has to be performed along profiles in driving or walking direction.
The camera used for this research is a digital single-lens reflex Canon 5D Mark II with 21 megapixels and a capability of 3.9 frames per second continuous shooting (Figure 2.). The relatively large sensor size of this camera (36 x 24 mm2) with the image size of 5616 x 3744 px gives the opportunity to take high resolution images. The lens of the camera has a focal length of 35 mm which causes a horizontal field of view of 54.43° and vertical field of view of 37.84°. There is an inclination angle of ca. 30° between the nadir line and the principal axis of the camera. The oblique view allows covering a bigger area and avoids recording parts of the vehicle. A camera output signal is generated by the hot-shoe for time synchronization purposes. The outgoing signal is amplified to fulfil the minimum voltage range needed for GNSS/INS synchronization.
The FARO Focus3D X 330 Laser Scanner has a vertical field of view of 300° and a maximum vertical scan speed of 97 Hz. Its measurement speed is from 122 to 976 kpts/s. The scan range is 0.6 m to 330 m (Faro, 2014).
Offset and angular (boresight) alignment between the axes of the inertial unit and the axes of a laser scanning device, the camera and the spectrometer is measured so far directly in the field. More suitable calibration procedures will be applied in future. Temporal synchronisation of the mapping sensors relies on the incoming pulses (TTL signal) recorded by POS LV 420 position and orientation system (Applanix, 2010).
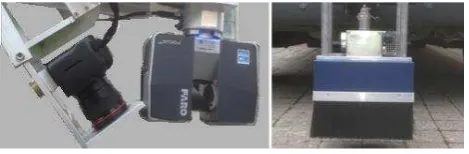
Parameter settings for the laser scanner are the measurement rate in points per second and the line scan speed specified by the number of scan rotations per second. Images and spectrometer data are recorded by selecting a suitable time interval. In addition, there the camera can be trigger based on waypoints to avoid recording superfluous images. Figure 2 shows the laser scanner, RGB camera and the spectrometer head.
Figure 2. Canon camera, FARO laser scanner and Polytec spectrometer head
3. DATA ACQUISITION AND PRE-PROCESSING As test area the neighbourhood of the University of Applied Sciences in Stuttgart was selected, the path along which all datasets were recorded so far has a length of 850 m.
Depending on the speed of the vehicle (typically between 20 to 30 km/h on small streets and alleys), the footprint of the spectrometer spot on the ground has a length of 16 to 24 cm and a width of 5 cm. Digital RGB images are registered together with the spectrometer data. By mounting the camera in nadir view at the back side of the vehicle, parts of the vehicle would be visible in the images. Therefore the images are recorded in an oblique view (Figure 2) and are rectified under the assumption of a planar road surface. Image capturing is performed either with a constant time increment, e.g. every second, or with a constant path increment, e.g. every 2 m. The
images feature a high ground resolution of ca. 1 mm; they are used for automatic detection of asphalt failures, in particular for cracks. Further the image data have been employed to localize the spectrometry spots on the ground. The laser scanner is pointing nadir in order to achieve a maximum point density on the road. For mobile laser scanning, the FARO Focus3D X330 is equipped with a helical adapter. 8533 points have been recorded per scan rotation (limited to 300°) at a line scan speed of 97 lines per second (Faro, 2014). The laser line spacing in the direction of travel amounts to 8.6 cm when driving at the speed of 30 km/h. Within the line, a sampling distance of a few mm is achieved on the road surface.
The Polytec spectrometer data are used up to 2240 nm. Beyond that wavelength an increasing noise level has been observed. Further noise filtering is carried out with a median filter. For some investigations the spectral signatures are reduced by their mean values in order to eliminate brightness effects which have been noticed as a result of different illumination conditions.
A further pre-processing step consists in the separation of the street floor from its neighbourhood so that laser data processing is limited to the street areas.
4. DATA PROCESSING METHODS AND RESULTS 4.1 Overall Concept of Road Condition Mapping
We use laser data, spectrometer data and RGB image data for different independent sub-tasks: From spectrometer data the asphalt ageing and deterioration is assessed, laser scanning data are used for the detection of ruts and potholes, from the RGB images cracks are extracted. At the end the individual results have to be integrated in a unifying assessment scheme. Our overall concept for the road condition assessment is based on the recommendations of the German “Road and Transportation
Research Association (FGSV)”: The road condition is assessed
as a weighted average of the individual contributions. According to these recommendations, there are two assessment
categories: The “utility value” describes the trafficability and
transport safety; it is determined as the worst of the parameters
“general unevenness”, “rut depth” and “road grip”. The “asset
value” characterizes the integrity of the asphalt layer, which can be degraded even if the trafficability is not yet impaired. It is
determined as a combination of the state values “cracks”, “surface damages”, “mends” and the “utility value” (FGSV, 2001). In addition here we integrate the “asphalt deterioration”, which is derived from the spectrometric observations, into the asset value. Figure 3 shows the overall concept of the research. The International Archives of the Photogrammetry, Remote Sensing and Spatial Information Sciences, Volume XL-1, 2014
Figure 3. The overall assessment scheme
4.2 K-means Clustering of Spectrometer Data
Firstly an unsupervised classification was applied to the Polytec data by a K-means algorithm under the assumption of three classes. The purpose of this procedure was to obtain experimental evidence about the main types of the surveyed road surfaces, i.e. to identify clusters in the feature space. The resulting groups give helpful evidence about the categories, into which the spectral signatures naturally subdivide. These categories do not necessarily need to correspond to road quality; they might be related to asphalt type (grain size etc.), impurity, vegetation impact etc. In a later supervised classification, such an actual grouping in “undesired” categories can severely affect the results, in particular if the training samples for both good and bad asphalt are not carefully selected from all groups. In our case, the three classes could be associated by visual inspection with new asphalts poor asphalt and road marks without enforcement, however.
Primarily the points with the same cluster association are highly sprawled in geometry space; the fragmentation of the segments with equal cluster number is gradually reduced for unrealistic
small segments. Sources of such small segments are amongst others dirt, shadows or moisture on the road surface.
Figure 4 presents the results of K-means clustering with Polytec data. The geocoded images have been used as a base-map for the spectrometry locations. The left part of the figure shows the position of spectral spots which hit the road mark demonstrated by a cluster colorized in green. The right part of the figure shows two segments. The street floor is composed of two patches. The left patch is newer than the right one. The border between the two spectral classes matches well with the border of the two patches.
Figure 4. Sample of geo-referenced spectrometer spots, colourized with the class association (Polytec data) The International Archives of the Photogrammetry, Remote Sensing and Spatial Information Sciences, Volume XL-1, 2014
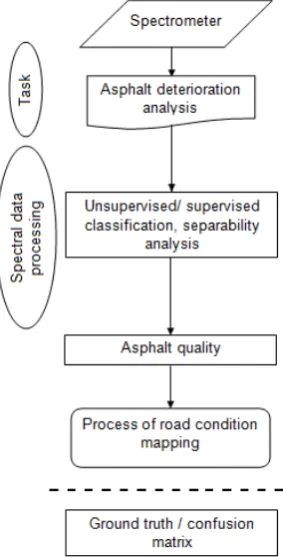
The workflow of the road deterioration mapping using spectral data is shown in Figure 5.
Figure 5. Workflow of the road deterioration mapping using spectral data
Figure 6. Flowchart of crack detection using RGB images
4.3 Road Crack Detection in RGB Images
Major road failures are cracks, mends, potholes and ruts. The frequency of cracks is an important indicator of the road condition. According to (IFI, 2011), the assessment of road conditions consists in a weighted average of several parameters as unevenness, patches, depth of ruts, virtual water depth etc. where the highest weight is on the alligator cracks. This affirms the significance of cracks. Cracks and mends are detectable in RGB images of sufficient resolution as their reflectivity differs from the intact surface; our RGB images are well suited as their ground resolution amounts to ca. 1 mm. Figure 6 represents the flowchart of crack detection using RGB images.
As a first step of our crack detection procedure, the grey-value histogram of an image is analyzed in order to separate the dark pixels from the background. For this purpose a thresholding is applied. Figure 7 shows the threshold represented as a red line. It is set halfway between the highest peak and the local maximum left of the highest peak. As all cracks lie on the left side of the highest peak, the thresholding yields a good preselection of possible crack pixels.
Figure 7. Histogram with threshold (red line).
The crack detection consists of a template matching; the matching is performed on several resolution levels in order to obtain cracks of various widths. We apply linear filters to the images by convolving the images with 18 quadratic masks, which are derived from a generating mask by successive rotations. The incremental rotation angle amounts to 10°. The width of the 2D filter masks is an odd number of pixels; a typical width is 51. The generating mask has the following structure:
= 1− 1
[
1 … … 1 − − 1 1 … … 1 … − − 1 … … − − 1 … … … … … − − 1 … … − − 1 … 1 … … 1 − − 1 1 … … 1]�×�
The derived masks are suited for the detection of line-like structures and therefore of cracks, which mostly appear as narrow, elongated areas in the images. While seams between different asphalt types could be extracted by edge detection methods, those methods are less suited for cracks: the latter do not represent discontinuities within the grey-value field, but rather dark segments within an otherwise quite homogeneous grey-value distribution. The given mask looks somewhat similar to the well-known operators for the approximation of second derivatives. Here it serves rather for the detection of elongated image parts with a sufficiently high grey-value difference compared to the neighbourhood, however.
The images �� of different resolutions are convoluted with all rotated masks mi according to
��,�= ��∗ �
The resulting images ��,� are thresholded and upsampled to the original resolution in order to obtain binary images �,�; as a threshold the empirical difference between the grey-value level of crack pixels and adjacent non-crack pixels is suitably selected. The images �,� now contain elongated structures with a high negative grey-value difference compared to their neighbourhood. Let denote the binary image where the sufficiently dark pixels are marked. The binary image of preliminary crack pixels is then computed according to
= ⋃ �,� ∩ ,
�,�
i.e. a pixel is considered as a crack pixel if it is marked in one of the binary images �,� and if it is sufficiently dark.
Completeness of the crack detection is considered more important than correctness, as remaining false positive pixels are not of great impact for road condition mapping. However groups of detected crack pixels are eliminated if they represent a very small area or if the roundness of a region indicates an extensive area rather than a line-like structure.
Weather conditions play a significant role in the crack detection. Sunny and rainy weather may both impair the crack detection using images, as shadows or wet ground both cause false detections. Figure 8 shows an example where a wet spot on the ground could be successfully filtered by the roundness criterion.
Figure 8. Greyscale image (upper left), binary result of crack detection (upper right), connected regions as symbolic image (lower left), binary image filtered by the roundness criterion
(lower right).
Figure 9 shows a stream of images with their respective crack images. Obviously some small crack regions are still remaining even after filtering.
Figure 9. A stream of geocoded mobile images (top) with respective mosaicked crack images (bottom)
4.4 Rut Detection using Mobile Laser Data
Our main usage of laser data is to detect 3D asphalt failures as potholes and ruts. Ruts occur due to sustained pressure along the most travelled lanes or due to acceleration or deceleration tractions at road junctions; they are characterized by their elongated shape. On the contrary, there is no predefined shape for the potholes.
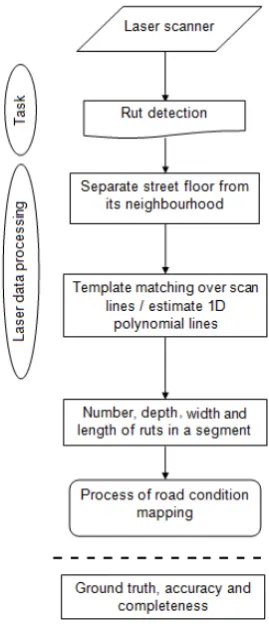
The detection of potholes is not covered by the present study; with respect to the ruts, we restrict ourselves to ruts parallel to the road axis. Rut detection is carried out by 1D template matching over each scan-line. Figure 10 displays the flowchart of rut detection using laser scan data.
Figure 10. Flowchart of rut detection using laser data.
Ruts are represented as arcs in the profiles. Accordingly we define an arc-like 1D template and calculate the correlation of this template with each scan line. The width of the arc was determined empirically as 40 cm.
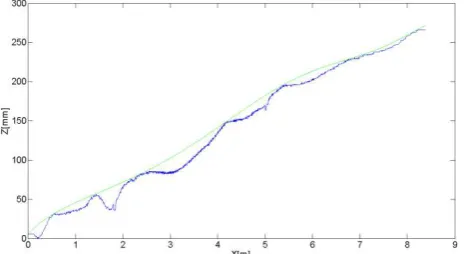
Cross sections of roads frequently feature a slope or long-wave irregularities, which are affecting the trafficability much less than ruts. We therefore fit a low order polynomial to the profile,
which represents the “unperturbed” progression of the road section; the polynomial is constructed in such a way, that it is everywhere located above the profile. Figure 11 shows an example with a polynomial of 8th order. This method resembles somewhat a traditional way of rut observation, where a sequence of measuring rods of 2m length were laid along the profile and the biggest distance between the road and the rod was measured with a V-head. The template matching is then performed on the difference curve between the original profile and the polynomial.
Figure 11. An eight order polynomial fitted on top of the profile
The correlation coefficient � � is computed according to the following formula, see e.g. (Leese, et. al., 1971), (Barnea and Silvermann, 1972)
� � = ∑ [� �+� −�̅ � ][� � −�̅]�
∑ [� �+� −�̅ � ]� ∑ [� � −�̅]� ⁄ (4)
where �̅ � = ∑�−�= � � + � represents the mean value of the laser points within a range of length of N, i.e. the length of the template.�̅ = ∑�−�= � � is the mean value of the template. The local maxima of the correlation curve, which are above a certain threshold, indicate possible rut locations. As a template we use a half ellipse with two adjacent horizontal line segments.
Figure 12 shows the correlation result for the profile of figure 11. Obviously the correlation at profile length 1.8 m, where actually a rut is located, is very high. On the other hand, the correlation is also high at other positions. This is partly due to the fact that in the denominator of the correlation coefficient the standard deviation of the windowed road section appears, so that the scale of the depression is irrelevant. Therefore also very small depressions can feature high correlation coefficients. Accordingly the test for ruts must take not only the correlation coefficient but also the depth and width of the depressions into account.
Figure 12. Correlation of the height differences of figure 11 with the template
Figure 13 shows the plot of height differences between the scan lines and its fitted polynomial; they represent the most important indicator of ruts. The scan lines are selected with 1 m interval. Darker points mean higher height differences. Figure 14 represents the correlation coefficients of the height differences with respect to the template. Locations with correlation coefficient above 0.5 are visualised in blue colour. This confirms that an additional consideration of depth and width of the depressions is crucial for reliable rut detection.
Figure 13. Plot of height differences between scan line and fitted polynomial
Figure 14. Correlation coefficients of the height differences
5. CONCLUSION AND OUTLOOK
In this paper we have presented a new concept of road condition mapping based on infrared spectrometer measurements, RGB images and laser scanning data. Classification of spectral data aims at collecting information about the pavement condition of roads. Cracks detected from geocoded RGB images and pavement failures extracted from laser scanning data are two further sources which provide information about the condition of a road surface. The information collected by these processes is combined to estimate road condition.
First classification results are obtained by unsupervised classification of the spectrometer data. The cluster can be assigned to new and old asphalt, etc. which experimentally indicates the potential of the spectral information for road condition mapping. With a histogram analysis and a multilevel line segment detection process cracks are localized in the geocoded images. Ruts are detected by using the laser point cloud. Because of the high point density of the laser scan line a high order polynomial can be fitted on top of the scan line profile. The difference between the polynomial curve and the scan line profile is used to detect and localize ruts by 1D template matching. Depth and width of the ruts are further considered in this process of rut detection.
The achievements so far are quite encouraging. In our overall concept of road condition mapping we further included mends and potholes for which procedures still have to be worked out. Future work will further focus on fusing the results of all these detection procedures.
6. ACKNOWLEDGEMENTS
This work is funded by the German Federal Ministry of Education and Research within the project RoadInspect: Detection and assessment of road conditions with the help of the reflection spectroscopy - Development of a kinematic platform solution. Helpful discussions with Dr. Johannes Engels are highly acknowledged. Greatly appreciated is the assistance provided by Marius Ziegler, Sokunthet Sok and Sergey Voinov.
7. REFERENCES
3D Mapping, 2014. Kinematic Surveying of Road and Railway Networks. http://www.3d-mapping.de (12 Oct. 2014)
Applanix, 2010. POS LV V5 Installation and Operation Guide. Pubs-Man-003758.
FGSV, 2001. Arbeitspapiere zur Zustandserfassung und -bewertung der Fahrbahnoberflächen von Straßen Nr. 9. Forschungsgesellschaft für Straßen- und Verkehrswesen, Köln.
Barnea, D. I., Silverman, H. F., 1972. A Class of Algorithms for Fast Digital Image Registration. IEEE Transactions on Computers, Vol. C-21, No. 2, pp. 179-186.
Faro, 2014. FARO Laser Scanner Focus 3D X 330 - The Perfect Instrument for 3D Documentation and Land Surveying. http://www.iqlaser.co.za/files/04ref201-519-en---faro-laser-scanner-focus3d-x-330-tech-sheet.pdf (22 Sep.2014).
Herold, M., Gardner, M.E., Noronha, V, Roberts, D.A., 2003. Spectrometry and hyper-spectral remote sensing of urban road infrastructure. Determination of robust spectral features for identification of urban surface materials in hyperspectral remote sensing data. Remote Sensing of Environment, Vol. 111, Issue 4, pp. 537– 552.
Hu, Y., Zhao, C., 2010. A Local Binary Pattern Based Methods for Pavement Crack Detection. Journal of Pattern Recognition Research, Vol. 5, No. 1, pp. 140-147.
Kertész, I., Lovas, T., Barsi, A., 2008. Photogrammetric Pavement Detection System. The International Archives of the Photogrammetry, Remote Sensing and Spatial Information Sciences, Vol. XXXVII, Part B5, pp. 897–902.
Leese, J.A., Novak, C. S., Clark, B. B., 1971. An Automated Technique for Obtaining Cloud Motion from Geosynchronous Satellite Data Using Cross Correlation. Journal of Applied Meteorology, Vol. 10, No.1, pp- 118–132.
Maas, H-G., 2012. Digitale Nahbereichsphotogrammetrie im bautechnischen Versuchswesen. Bautechnik Nr. 89, Heft 11, pp. 786-793.
Mancini, A., Malinverni, E.S., Frontoni, E., Zingaretti, P., 2013. Road pavement crack automatic detection by MMS images. 21st Mediterranean Conference on Control and Automation (MED), Platanias-Chania, Crete, Greece, June 25-28, 2013, DOI: 10.1109/MED.2013.6608934
http://ieeexplore.ieee.org/ (16 Oct. 2014 )
Marques, A.G.C.S, 2012. Automatic road pavement crack detection using SVM, Dissertation to obtain a Master Degree in Electrical and Computer Engineering, Instituto Superior Técnico, Universidade Técnica de Lisboa, October of 2012 https://fenix.tecnico.ulisboa.pt/downloadFile/395144951036/dis
Polytec, 2011a. Polytec Spectrometer System, User manual, PSS- XXX1, 41368-Man-PSSxxx1-0311-03en.
Polytec, 2011b, Conveyor Belt Sensor Head, User manual, PSS-H-A03, For Spectrometer Systems, 41376-Man-PSS-H-A03-0511-03en.
Segl, K., Heiden, U., Müller, M., and Kaufmann, H., 2003. Endmember detection in urban environments using hyperspectral HyMap data. Proc. of 3rd EARSeL Workshop on Imaging Spectroscopy, Herrsching, 13-16 May 2003.
IFI, 2011. Straßenerhaltung mit System, Visuelle und messtechnische Zustandserfassung, EDV-technische Zustands-bewertung Bedarfs- und Projektplanung, IFI Consult GmbH, http://www.ificonsult.de/pdf/erhaltung.pdf (25 Sep. 2014)
Subirats, P., Fabre, O., Dumoulin, J., Legeay, V., Barba, D., 2004. A combined wavelet-based image, processing method for emergent crack detection on pavement surface images. In: Proceedings of the XII European Signal Processing Conference, Vienna, Austria, 6–10 September 2004.
TÜV Rheinland, 2014. TÜV Rheinland Schniering GmbH, http://www.schniering.com/?hl=en_US (12 Oct. 2014)
Wei, N., Zhao, X.M., Dou, X.Y., Song, H.X., Wang, T., 2010. Beamlet Transform Based Pavement Image Crack Detection. In: International Conference on Intelligent Computation Technology and Automation, Volume 1, pp.881-883, DOI: 10.1109/ICICTA.2010.755.