EFFICIENT POINT CLOUD COLLISION DETECTION AND ANALYSIS IN A TUNNEL
ENVIRONMENT USING KINEMATIC LASER SCANNING AND K-D TREE SEARCH
Johannes Schauera, Andreas N¨uchterb
a
School of Engineering and Science,
Automation Group, Jacobs University of Bremen gGmbH, Campus Ring 1, Bremen 28759, Germany
bInformatics VII : Robotics and Telematics, Julius-Maximilians-University W¨urzburg,
Am Hubland, W¨urzburg 97074, Germany [email protected], http://www.nuechti.de
KEY WORDS:Collision Detection, K-D Tree, Kinematic Laser Scanning, 3D Point Clouds
ABSTRACT:
Measuring the structure gauge of tunnels and other narrow passages has so far been the only way to evaluate whether large vehicles can pass through them. But especially for very long vehicles like train wagons and their cargo, the structure gauge is an insufficient measure because the center part of the vehicle between two bogies will inevitably leave the swept volume of its cross section when moving along any other trajectory than a straight line perpendicular to its cross section. In addition, the vehicle as well as the cargo must keep a minimum safety margin from the environment at all points of its trajectory. This paper explores an automated method to check for possible collisions of a model represented by a 3D point cloud moving through the 3D point cloud of an environment. We were given environment data of a train track through a narrow tunnel where simply relying on the structure gauge would indicate that a given wagon would pass through without any collision even though in reality, the train wagon would collide with the inner tunnel wall inside a sharp turn of the tracks. The k-d tree based collision detection method presented in this paper is able to correctly highlight these collisions and indicate the penetration depth of each colliding point of the environment into the model of the train wagon. It can be generalized for any setup where two static point clouds have to be tested for intersection along a trajectory.
1. INTRODUCTION AND PROBLEM FORMULATION
The minimum clearance outline orstructure gaugehas an im-portant place in the planning of railroad tracks. It is the swept volume of the minimum cross section that must be kept free of any obstacles. A similar measure is theloading gaugewhich is the swept volume of the cross section of a train wagon moved along a track. The difference between the two is the engineer-ing tolerance orclearance. The structure gauges along a track together with the maximum loading gauge determine whether or not a train with certain cargo can go along a given route or how much space around new tracks has to be kept clear and is subject to a number of decades old standards and regulations (Siegmann, 2011).
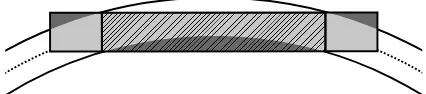
Unfortunately the structure gauge is an unsatisfying measure within turns of the tracks. Figure 1 visualizes the problem. The curva-ture represents the loading gauge of the train wagon in gray. The dark gray areas represent the volume of the train wagon which is outside of its loading gauge during the turn.
The algorithm that will be presented in the following requires three objects as input: the pointcloud of theenvironmentwhich was collected by driving a Optech Lynx Mobile Mapper along the train tracks but can also be acquired using the methods presented in (Elseberg et al., 2014). The second input is a point cloud of the modelwhich was acquired by taking seven scans of a real train wagon with a Riegl VZ-400 laser scanner and then registering them using 3DTK (N¨uchter et al., 2010). The third input is the trajectoryof the train tracks.
The goal is to determine which points of the environment collide with the model on its path, given a certain safety margin (the minimal allowed clearance) and how deep any colliding points penetrate the model. To this end a k-d tree of the environment was
Figure 1: Top view of the train wagon (in dark and light gray) and its curved loading gauge as it passes through a turn. The dark gray areas mark the volumes of the train wagon outside of its loading gauge. The striped volume indicates the volume of the train wagon between its two bogies. The dotted line indicates the wagon’s trajectory.
created, the model was moved through it along its trajectory and a k-d tree search was performed around the points of the model to find colliding points and their penetration distance.
The contributions of this paper can be summarized as:
• a method to perform easily parallelizable collision detec-tion of a single arbitrary (and deformable) point cloud (the model) with a static environment in two variants
• two easily parallelizable methods to calculate penetration depth of the model with the environment
• a highly optimized k-d tree implementation and query func-tions to perform collision detection
The rest of the paper is organized as follows: The next section covers related work to the one presented in this paper. Section three presents the k-d tree data structures and algorithms. Section four and five present our methods for collision detection and pen-etration depth calculation using the k-d tree, respectively. Section six show benchmark results while section seven concludes this paper.
2. RELATED WORK
Collision detection, which is also called interference detection or intersection searching, is a well studied topic in computer graph-ics (Jim´enez et al., 2001, Lin and Gottschalk, 1998) because of its importance for dynamic computer animation and virtual re-ality applications (Tzafestas and Coiffet, 1996). On the other hand, their work is limited to collision detection between geo-metric shapes and polygonal meshes whereas most sensor data is acquired as point clouds. While collision detection is also rele-vant for motion planning in the field of robotics, it is a less stud-ied problem there. Collision detection between point clouds was for example researched by Klein and Zachmann (Klein and Zach-mann, 2004) who use the implicit surface created by a point cloud to calculate intersections. Another example is the recent work by Hermann et al. (Hermann et al., 2014) who use voxels to check for spatial occupancy for robot motion planning.
Existing techniques make use of very similar approaches. One method is to apply a spatial hierarchical partitioning of the input geometry using octrees (Jung and Gupta, 1996), BSP-trees (Ar et al., 2000) or k-d trees (Held et al., 1995) . Other solutions ap-ply regular partitioning using voxels (Garcia-Alonso et al., 1994, Hermann et al., 2014). The goal of any partitioning is to be able to quickly search and check only the relevant geometries in the same or neighboring cells. The method presented in this paper will make use of a hierarchical k-d tree for the environment in combination with a regular partitioning of the model into a grid of bounding spheres.
Another method is to use hierarchies of bounding volumes like spheres (Hubbard, 1996), axis aligned bounding boxes, oriented bounding boxes (Gottschalk et al., 1996) or discrete oriented poly-topes (Klosowski et al., 1998). Optimizing the regular grid that was generated for the model into a hierarchical structure will be left for future work.
Collision detection methods can be divided in those for static and deformable objects (Teschner et al., 2003, Bergen, 1997). While the method presented in this paper does not easily allow changes in the environment because it would require a recalculation of its k-d tree, arbitrary changes in the point cloud of the model are possible without any performance impacts.
Another classification is whether the algorithm easily allows mul-tiple moving objects. Using a brute-force approach such algo-rithms would have a runtime ofO(n2
)fornobjects because ev-ery possible pair of objects is checked for collisions. Modern approaches like the I-COLLIDE system (Cohen et al., 1995) use a “sweep and prune” approach to minimize the amount of nec-essary checks. Another approach is to dynamically adjust the search tree to account for object movements (Luque et al., 2005). The method in this paper does not handle multiple moving mod-els.
Calculating the penetration depth of one object into another is important to calculate the force of collisions and respond ac-cordingly in virtual reality applications (Tzafestas and Coiffet, 1996). It is also important for visualization purposes, to differ-ently highlight objects reaching into a safety margin with an indi-cation of how much they violate the constraint. This appliindi-cation was shown in prior work on this topic by the authors of this
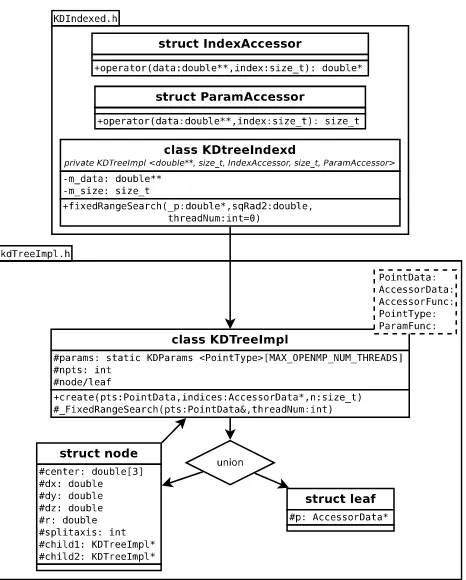
pa-Figure 2: Boxes are in UML, relationships (arrows) are not. KDTreeImplis templated byKDtreeIndexedwith the param-eters listed in the comment. Thenodeandleafstructure are a C++union. Theparamsmember ofKDTreeImplis static. UML packages are used to indicate file membership and to group for readability. Only thefixedRangeSearchsearch function and its recursive counterpart FixedRangeSearchare listed for brevity.
per (Elseberg et al., 2014).
3. DATA STRUCTURES FOR EFFICIENT COLLISION DETECTION AND DEPTH OF PENETRATION
CALCULATION
In this section our highly-optimized k-d tree implementation is presented. It is implemented in 3DTK in C++. It currently im-plements multiple search functions, can be parameterized to be used with 3D point data of different precision and container type, allows to present search results as pointers, array indices or as 3D coordinate data and allows parallel execution through OpenMP.
Tree data structure Consider the object relationship sketched in figure 2. Each node in the k-d tree stores an integer npts indicating the number of points this node contains. If this value is non-zero, the node is a leaf node. Otherwise, the node is an inner node. A union structure stores data depending on the node type. Inner nodes store their center coordinate, the node size, the coordinate axis by which the node is split and pointers to the two children the node is split into. Leaf nodes store a pointer pto an array representing the contained points. The static member paramsof typeKDParamsstores information associated with the current k-d tree search. As a static member, this container is only stored in memory once.
by finding the longest axis of the bounding box and the data is partitioned into the new two child nodes. The functioncreateis then called recursively with the points falling into each subtree, respectively.
Searching the k-d tree Spacial search in point clouds can be parameterized by two properties: the location (where to search for results) and the subject (what to return). The following five search areas are implemented by 3DTK:
(a) radiusraround a pointP1
(b) radiusraround an infinite line defined by a pointP1and a
direction vectorv
(c) radiusraround an infinite ray defined byP1andv
(d) radiusralong a finite line segment defined by pointsP1and
P2and
(e) inside an axis aligned bounding box defined byP1andP2as
the corners with minimum and maximum coordinate values, respectively
Additional search volumes that could be added in the future would be oriented bounding boxes, cylinders or general polytopes. In most volumes, searches for the following result types can be per-formed:
(1) the point closest toP1
(2) thekpoints closest toP1
(3) all points within the search volume
(4) the point closest to the given line, ray or line segment
(5) thekclosest points to the given line, ray or line segment
After eliminating the inapplicable combinations, one ends up with 19 meaningful search functions. A full list is omitted for brevity. For example, the common nearest-neighbor search (NNS) would be searching for the closest point toP1(1) in a radiusraround a
pointP1(a). For the collision detection method presented in this
paper, the following four functions are needed:
• FindClosest: closest point to a coordinate: (a) and (1)
• fixedRangeSearchall points around a coordinate: (a) and (3)
• segmentSearch 1NearestPointclosest point to a line seg-ment: (d) and (1)
• segmentSearch allall points around a line segment: (d) and (3)
fixedRangeSearch The general operation of the search func-tions will be presented by using the functionfixedRangeSearch as an example. The functions is implemented in the class KDTreeIndexed. It sets up the KDParams structure with the search parameters and then calls the recursive function FixedRangeSearch (notice the leading underscore) imple-mented inKDTreeImpl.
All recursive search functions can be divided into three functional parts. Firstly, if the node is a leaf node, then all points the node contains are checked for satisfiability of the search criteria. Sec-ondly, if the node is an inner node, then a check is done whether the node can possibly contain parts of the result. If not, the func-tion returns. Otherwise, thirdly, the search recurses into one or both child nodes.
The recursive function FixedRangeSearchreturns all points within a radius r around a point P. The satisfiability check for leaf nodes involves checking the distance criteria of radius raroundP and pushing the point to the result vector if its dis-tance fromPis less thanr. The parameterized functions of type IndexAccessorandParamAccessorare used to return coordi-nate data or data of the return type for each point in the leaf node, respectively. They do not pose a performance overhead as they are usually inlined by the compiler.
To check whether to abort, the following fast heuristic is used. Suppose an intermediate node inside the k-d tree with center co-ordinateCand a bounding box size ofdx,dyanddz. Suppose the six sides of the node’s axis aligned bounding box form six axis aligned planes: each plane being the infinite extension of the six sides of the node’s bounding box. Opposing sides of the node’s bounding form pairs of parallel planes. Three of these plane pairs are created, one pair along each dimension. Then the distance ofPto the closest plane of each pair of planes is found. IfP is between a pair of planes, then its distance is represented as a negative value. Then the maximum distance of the result-ing three distance values is taken (one for each dimension). If the maximum valuedPis negative, then all three coordinate val-ues ofPmust lie inside the current node’s bounding box and the search has to recurse into one or both child nodes. If the maxi-mum value is positive and larger than the search distance, then the current node cannot contain any results and the function returns without recursing deeper into the tree. While the geometry be-hind this check seems complex, the calculations can be done with very few and inexpensive operations thanks to the axis alignment of the bounding box (see equation 1).
dP = max (max (|Px−Cx| −dx,|Py−Cy| −dy),
|Pz−Cz| −dz) (1)
The last part of each search function recurses into the child nodes. First, a check for the point’s position relative to the split axis of the current node decides which child node to recurse fist. Whether or not the second child node is recursed into as well depends on whether the bounding cube of the search radius aroundPextends into the second child of the current node as well or not.
4. COLLISION DETECTION
Two variants of collision detection were implemented using the k-d tree. One variant is based on a range search around each point of the model usingFixedRangeSearchand the other is based on a segment search between two subsequent points of the model on its trajectory usingsegmentSearch all. In both variants, the model is moved along its trajectory and a range or segment k-d tree search with radiusr is performed at each position. When points are found to be colliding, then this information is saved in a separate boolean vector which stores for each point in the environment whether it ever collided with the model on its trajec-tory or not. The search radiusrdetermines the precision of both algorithms. The smaller the search radius, the more precise the collision detection is. For smaller search radii, the model has to be sampled dense enough to not leave any unoccupied volume. The search radiusris the required “safety distance” between the model and the environment within which no point of the environ-ment should lie. At the end, the collision information from the boolean vector is used to partition the environment into colliding and non-colliding points.
written but not read during collision detection.
Range search In this variant, on each position of the model on its trajectory, a fixed range search usingFixedRangeSearchis done around each point of the model. All points of the environ-ment that are found to be within rangerof any point of the model at any position on its trajectory are updated to be colliding.
Segment search This variant executes a segment search using segmentSearch allbetween the same points of the model at two subsequent positions of the model in the environment. This means that in this variant, trajectory positions can be further apart than the search radius because the space between two positions is searched by linearly connecting the two. In effect, this variant can thus require less search operations while maintaining a similar result quality compared to the range search.
5. DEPTH OF PENETRATION CALCULATION
Two variants to calculate depth of penetration will be presented. They perform differently depending on the kind of input data and yield different results depending on the sampling rate of the model trajectory. The first variant is generally faster but produces only good results for objects protruding the path of the model through the environment. The first variant does not produce cor-rect results when the model moves alongside a will and collides with it.
The first variant is an embarrassingly parallel operation just as the collision detection methods. The second variant easy to par-allelize as well and the only part of the second variant that has to be synchronized between workers is the updating of the penetra-tion depth because it requires reading and checking the already stored depth of penetration per colliding point.
Heuristic for protruding objects This variant iterates through all points of the environment that were found to be colliding and finds the closest non-colliding point usingFindClosest. The distance between the two points is then recorded as the depth of penetration. This variant works well for objects that “stick” into the path of the model because the penetration depth of the tip of that object will be about as deep as its distance to the clos-est non-colliding point. This method was shown to work well for automotive assembly lines as shown in prior work of the au-thors (Elseberg et al., 2014).
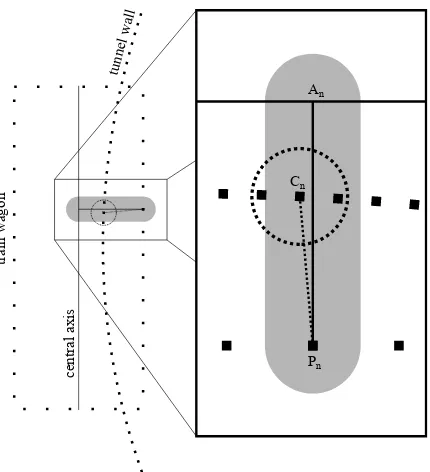
General depth of penetration calculation Consider figure 3a which illustrates this method. Figure 3a shows a top view of the train wagon model at one point of its trajectory inside the tunnel. It is shown colliding with the right hand side tunnel wall. The algorithm iterates over every point of the modelPnand finds its projection to the wagon centerAn. Since the central axis is the y-axis in the coordinate system of the train wagon, this projec-tion is simply done by setting thexandz coordinates to zero. Then a segment search usingsegmentSearch 1NearestPoint on the line segment fromPntoAnis performed for every point of the model: for each pointPnthe closest pointCnof the col-liding environment within the search radius is found. A fixed range search usingFixedRangeSearchof radiusraroundCn is performed and all points within that search radius including Cnare collected. This collection of points has to be performed because otherwise, many points of the environment would be missed bysegmentSearch 1NearestPoint. The distance be-tweenCnandPnis calculated and that distance is assigned to all points that were found byFixedRangeSearchif the new dis-tance value is greater than the old one. This set of calculations is done for each point of the model on each position of its trajectory. In the end, every colliding point of the environment has attached to it the greatest distance found by this method over the whole trajectory.
ce
nt
ra
l a
xi
s
tra
in w
agon
tunne l w
all
An
Pn
Cn
(a) Left:a top view of the train wagon at a position through the tunnel.Right:a magnified and rotated part of the left fig-ure with point names. The gray area represents the segment search volume. The dotted line is the distance betweenPn andCnwhich is the point that was found to be closest toPn within the search area. The dotted circle shows the search radius aroundCn. All points within this radius are updated with the same distance thatCnhas toPnif that distance is greater than the previously stored one.
(b)A comparison of the penetration depth as calculated by the two variants. Both figures show a narrow piece of tunnel from the outside with the calculated penetration depth indi-cated by the point color. Non-colliding points are shown in dark red. The top figure shows the simple and fast variant while the bottom figure shows the more correct slower vari-ant.
This method requires that the individual points of the trajectory are not further apart than the search radius. While this is also one of the reasons why this method is more computationally ex-pensive than the first heuristic, it also yields better results when applied to a collision with the tunnel wall. Figure 3b illustrates the difference.
6. EXPERIMENTS AND RESULTS
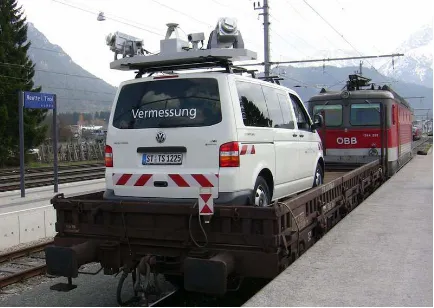
A 3D point cloud of train tunnel was provided to us by TopScan GmbH. The point cloud contains 18.92 million points of outdoor data. The point cloud was collected by a Optech Lynx Mobile Mapper mounted on a van which was placed on a train wagon (see figure 4a). TopScan also provided the trajectory data to us which was comprised of 23274 positions over a distance of1144m. The trajectory contains positional as well as orientation data.
To retrieve a point cloud of a suitable model to move through the environment, a train wagon was manually scanned using a RIEGL VZ-400 laser scanner. Seven scans were taken from all sides of the wagon and registered using 3DTK’s SLAM imple-mentation. The train wagon was manually extracted from the re-sulting registered point cloud by using 3DTK’sshowapplication. It was then aligened inside the axis aligned bounding box of the wagon. The alignment process can be seen in figure 4c. As cal-ibration data of the precise location of the scanner relative to the environment was missing, our results can only serve a demonstra-tion purpose of our methods. The final point cloud of the wagon contained 2.5 million points.
The trajectory that was provided to the authors included orien-tation information in three degrees of freedom as well. Since a train wagon is mounted on two bogies and since the origin of the coordinate system of the train is located in its center , using this trajectory directly would’ve meant that the wagon would rotate around its own center along the trajectory. This would produce wrong results since instead, the bogies of the train have to remain on the tracks while the center follows accordingly. A new tra-jectory was calculated from the original tratra-jectory by assuming a bogie distance of20mand moving the train wagon such that the center of both bogies would always be on the original trajectory. Since this operation requires the original trajectory to be a con-tinuous function and not a sampled trajectory, a spline was fitted across all points of the trajectory with a sum of squared residuals over all the control points of10m. This amounts to the spline only a few millimeter away on average from the original trajec-tory. The FITPACK library (Dierckx, 1993) was used to calculate the spline. The result of this computation also adjusted the yaw and pitch of the trajectory.
To benchmark the developed algorithms, the train wagon model as well as the trajectory were sampled with several different point distances. For the train wagon, the original amount of 2.5 mil-lion points was reduced using 3DTK’sscan redprogram which allows an octree based reduction of a point cloud with a given voxel size. As the search volume for collision detection must not contain any holes,p a model of equidistant points was created by saving the center of each occupied octree voxel as point of the reduced model. This creates a 3D square lattice of points. Five different reductions of the train wagon point cloud were created to run benchmarks on them. Due to the structure of the under-lying octree, the voxel sizedm was repeatedly halved starting from a maximum voxel size of0.924mand down to a voxel size of5.8cm. For each of the five reductions, the search ra-dius was chosen to create a bounding sphere of an octree voxel of the respective size. That way, all space occupied by the model is searched for collisions without leaving any holes. This means that the voxel sizedmcomputes from the bounding sphere and search radiusrasdm = 2
3 √
3r. Similarly, the trajectory was sampled
(a)The Optech Lynx Mobile Mapper on the back of a train wagon.
(b)The extracted model of the train wagon.
(c)Frontal view of the train wagon and the rectangular base of its bounding box
(d)Aligned train wagon (yellow) inside the tunnel en-vironment (gray) and trajectory (red).
Table 1:The first column shows the choice of collision detection search radiusr. The second column shows the resulting distance between the points of the wagondmand the points on the trajec-torydt. The third column shows the resulting number of points in the model. The fourth column shows the resulting number of points on the trajectory. The second and fourth column are ex-tended as the results in figure 5b are calculated for higher distance values as well.
such that the individual positions would be between5.8cmand 14.78mapart. Table 1 gives an overview of the chosen search radii, the according voxel size and trajectory position distances and the resulting number of points in the model and on the trajec-tory.
The benchmarks omit runtime results that only modify either the amount of points in the model or the amounts of positions in the trajectory. Both collision detections algorithms scale completely linearly with both variants and can be completely parallelized by splitting the workload over different sets of points in the model or positions in the environment. The benchmarks were done on a Intel Core i5-4200U @ 1.6GHz system with 16GB of system memory and only executed using a single thread.
Figure 5a shows the influence of the search radius on the run-time of both collision detection variants. While all other variables are kept constant, the algorithm was benchmarked with different search radii. The figure shows the runtime of both collision detec-tion variants as well as the number of points that were found to be colliding in each variant. One can observe that the segment based variant finds more colliding points but that it is also slower than the fixed range search based method. Both variants increase ex-ponentially in runtime with higher search radii. With small radii in the centimeter scale, which is desirable for precise results, the runtime of both variants stays below 10 seconds.
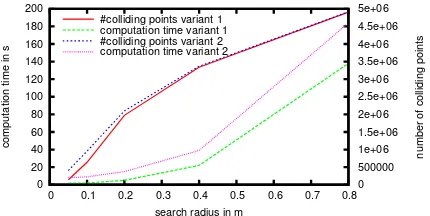
In figure 5b the search radius is kept constant and the sampling rate of the trajectory is modified to investigate the dependency of the segment based collision detection method on the segment size. One can observe that as the segment size grows larger, the computation time quickly converges to a constant value of under 10 seconds. The amount of found colliding points slightly in-creases with larger segment sizes as more colliding points will be found inside the curvature of the tunnel wall.
Figure 5c shows a more realistic setup in the sense that not only the search radius is modified but also the sampling rate of the trajectory and train wagon model. If the search radius grows, the sampling rates can be lower because more volume is cov-ered. For each value of search radius the sampling rates have been chosen such that no points of the environment would be skipped as the model moves along its trajectory. The graph in figure 5c shows that the algorithm quickly approaches runtimes below five seconds as the amount of required k-d tree searches decreases with higher search radii and thus lower sampling rates. On the other hand it can be seen that with the lowest and thus most precise search radius of5cmwhich searches on a trajectory of
0
(a)Computation time of both collision detection variants with different search radiir. The distance between individual points on the trajectorydtand the distance between points in the model dmis chosen to bedt=dm= 0.231m.
trajectory position distance in m #colliding points computation time
(b) Computation time of the segment based collision detection variant with different distances between individual points on the trajectory with a model sampled withdm= 0.231mand a search radius of0.2m.
(c)Computation time of both collision detection variants with different search radiir. The distance between individual points on the trajectorydtand the distance between points in the model dmis chosen such thatdt=dm=2
(d)Computation time of both penetration depth variants with dif-ferent search radiir. The distance between individual points on the trajectorydt and the distance between points in the model dm is chosen such thatdt = dm = 2
3 √
3r. Colliding points were computed using the segmentation based collision detection variant.
19,392positions a model of28,622points, our k-d tree is able to make all required19,392×28,622 = 555,037,824k-d tree searches in only 77 seconds. This means that the average k-d tree search in a dataset of 18.92 Mill points takes139ns. This in turn means that collision detections of even complex models with up to 287000 points could be done in real time speed of25.0frames per second with the presented k-d search tree implementation.
In the last figure 5d the two depth of penetration methods are compared. One can see that the first variant stays below 20 sec-onds of computation time in all variants. This is expected as the performance of the algorithm only depends on the amount of colliding points found. We can observe that the first variant in-creases in runtime slightly as the mount of colliding points rises with increased search radius. The second, more precise depth of penetration variant performs badly for small search radii for which a large number of k-d tree searches have to be performed but quickly approaches runtime values below one minute as the search radius grows larger than10cm.
7. CONCLUSIONS AND OUTLOOK
This paper presented a highly efficient k-d tree implementation which was used to perform collision detection of a sampled arbi-trary point cloud against an environment of several million points. It was shown that even though this is a partly brute-force method as it checks all sampled points of the model, it performs well enough such that real queries of densely sampled trajectories can be completed in a matter of seconds. Two heuristics for calcu-lating penetration depth have been presented which work for dif-ferent scenarios and have difdif-ferent precision and runtime proper-ties. All of these algorithms are embarrassingly parallel and thus speed-ups can easily be gained.
For future work, several routes to improve these methods exist. More work has to be done to research which checks to abort the k-d tree traversal for k-different search geometries ank-d input k-data per-form best. Another easy way to increase the perper-formance could be to change the sampling of the model from bounding spheres to different geometries like axis aligned bounding boxes which are similarly quick to check for collisions. Lastly, instead of check-ing every point of the model, a hierarchy of boundcheck-ing spheres or other geometries could be used (Tzafestas and Coiffet, 1996) but that would destroy the property of the current algorithm that the input model is allowed to arbitrarily deform.
REFERENCES
Ar, S., Chazelle, B. and Tal, A., 2000. Self-customized bsp trees for collision detection. Computational Geometry 15(1), pp. 91– 102.
Bergen, G. v. d., 1997. Efficient collision detection of complex deformable models using aabb trees. Journal of Graphics Tools 2(4), pp. 1–13.
Cohen, J. D., Lin, M. C., Manocha, D. and Ponamgi, M., 1995. I-collide: An interactive and exact collision detection system for large-scale environments. In: Proceedings of the 1995 sympo-sium on Interactive 3D graphics, ACM, pp. 189–ff.
Dierckx, P., 1993. Curve and surface fitting with splines. Oxford University Press, Inc.
Elseberg, J., Borrmann, D., Schauer, J., N¨uchter, A., Koriath, D. and Rautenberg, U., 2014. A sensor skid for precise 3d modeling of production lines. ISPRS Annals of Photogrammetry, Remote Sensing and Spatial Information Sciences II-5, pp. 117–122.
Garcia-Alonso, A., Serrano, N. and Flaquer, J., 1994. Solving the collision detection problem. Computer Graphics and Appli-cations, IEEE 14(3), pp. 36–43.
Gottschalk, S., Lin, M. C. and Manocha, D., 1996. Obbtree: A hierarchical structure for rapid interference detection. In: Pro-ceedings of the 23rd annual conference on Computer graphics and interactive techniques, ACM, pp. 171–180.
Held, M., Klosowski, J. T. and Mitchell, J. S., 1995. Evalua-tion of collision detecEvalua-tion methods for virtual reality fly-throughs. In: Canadian Conference on Computational Geometry, Citeseer, pp. 205–210.
Hermann, A., Drews, F., Bauer, J., Klemm, S., Roennau, A. and Dillmann, R., 2014. Unified gpu voxel collision detection for mo-bile manipulation planning. In: Intelligent Robots and Systems (IROS), 2014.
Hubbard, P. M., 1996. Approximating polyhedra with spheres for time-critical collision detection. ACM Transactions on Graphics (TOG) 15(3), pp. 179–210.
Jim´enez, P., Thomas, F. and Torras, C., 2001. 3d collision detec-tion: a survey. Computers & Graphics 25(2), pp. 269–285.
Jung, D. and Gupta, K. K., 1996. Octree-based hierarchical dis-tance maps for collision detection. In: Robotics and Automa-tion, 1996. Proceedings., 1996 IEEE International Conference on, Vol. 1, IEEE, pp. 454–459.
Klein, J. and Zachmann, G., 2004. Point cloud collision detec-tion. In: Computer Graphics Forum, Vol. 23, Wiley Online Li-brary, pp. 567–576.
Klosowski, J. T., Held, M., Mitchell, J. S., Sowizral, H. and Zikan, K., 1998. Efficient collision detection using bounding vol-ume hierarchies of k-dops. Visualization and Computer Graphics, IEEE Transactions on 4(1), pp. 21–36.
Lin, M. and Gottschalk, S., 1998. Collision detection between geometric models: A survey. In: Proc. of IMA conference on mathematics of surfaces, Vol. 1, pp. 602–608.
Luque, R. G., Comba, J. L. and Freitas, C. M., 2005. Broad-phase collision detection using semi-adjusting bsp-trees. In: Pro-ceedings of the 2005 symposium on Interactive 3D graphics and games, ACM, pp. 179–186.
N¨uchter, A., Elseberg, J., Schneider, P. and Paulus, D., 2010. Study of parameterizations for the rigid body transformations of the scan registration problem. Computer Vision and Image Un-derstanding 114(8), pp. 963 – 980.
Siegmann, J., 2011. Lichtraumprofil und fahrzeug-begrenzung im europ¨aischen schienenverkehr. http: //www.forschungsinformationssystem.de/servlet/ is/325031/. [Online; accessed 2014-07-14].
Teschner, M., Heidelberger, B., M¨uller, M., Pomeranets, D. and Gross, M., 2003. Optimized spatial hashing for collision detec-tion of deformable objects. Technical report, Technical report, Computer Graphics Laboratory, ETH Zurich, Switzerland.