PRECIPITATION TREND ANALYSIS OVER EASTERN REGION OF INDIA
USING CMIP5 BASED CLIMATIC MODELS
A. Kundu*, S. Dwivedi
, V. Chandra
K. Banerjee Centre of Atmospheric and Ocean Studies, University of Allahabad, Allahabad, Uttar Pradesh, India- [email protected]
Commission VIII, WG VIII/3
KEY WORDS: Climate Change, Precipitation Trends, CMIP5 models, RCP.
ABSTRACT:
Climate science is a complex field as climate is governed by processes that interact and operate on a vast array of time and space scales. The processes involving radiative transfer, chemistry and phase changes of water are most easily described at atomic and molecular scales; the influence of ice sheets, continents and planetary scale circulations controlling the basic energy balance of the planet operate at continental scales; even planetary orbital and solar variations operating at millennial time scales cannot be ignored. Global as well as regional climate has changed due to human activities like land use changes, production of industrial effluents and other activities due to the development of the society. The consequences of these changes have a massive impact on atmospheric events like precipitation, temperature etc. So, present and future information of precipitation is required to develop adaptation and mitigation strategies at national and international levels. Precipitation is one of the major phenomena of the atmosphere. So, its prediction and the trend are very necessary to realize the change of climate. The study attempted some model based analysis to assess prediction of rainfall trend using MK test and the Sen’s slope estimator.
1. INTRODUCTION:
Models have been used by scientists to express their knowledge about a process or a set of processes using equations that can be solved on a computer. It is impossible to represent everything known about all the processes that govern climate in detail on today’s computers because it is simply beyond the computer power currently available to us and approximations must be made. There are also many things scientists recognize that are “not known” that may be important in understanding climate change. Climate projections for the Fifth Assessment Report of the Intergovernmental Panel on Climate Change (IPCC) are made using the newly developed Representative Concentration Pathways (RCPs) under the Coupled Model Inter-comparison Project 5 (CMIP5). Generally, it is accepted that global climate has changed due to increasing atmospheric carbon dioxide (CO2) and other greenhouse gases and anthropogenic activities (IPCC, 2001). Climate change has expected effects on physical, biological and socio-economic processes. Present and future climate change information at local, regional and global scales is required to develop national as well as international level adaptation and mitigation strategies (Xu et al., 2010; Miao
et al., 2011). The general circulation model (GCM) has steadily become a prime tool for climate change research (IPCC, 2007). Driven by different radiative forcings, GCMs can simulate present-day climate and project future climate conditions under different scenarios (IPCC, 1990; Li et al., 2011; McAfee et al., 2011; Xu et al., 2011; Miao
et al., 2013; Ou et al., 2013).
*
Corresponding author.
The World Climate Research Program (WCRP) developed the Coupled Model Intercomparison Project (CMIP), which mainly provides coordinated simulations from the state of the art for global climate models. The project provides an opportunity for model comparison and multi-model ensemble strategy development (Li et al., 2011). The present study is mainly concerned with the changing trend of frequency of low to medium rainfall, heavy rainfall, very heavy rainfall, extremely heavy rainfall over the eastern part of India from MIROC5, HadGEM2-ES, CCSM4 and GFDL-CM3 models using the MK test. Mann-Kendall (MK) is one of the most commonly used non-parametric tests for detecting climatic changes in time series and trend analysis (Mann 1945; Kendall 1955). The MK trend test is a rank correlation test for two groups of observations proposed by Kendall (1955).
2. STUDY AREA:
responsible for causing damage (Fig. 1).
Figure 1: Map of study area 3. METHODOLOGY:
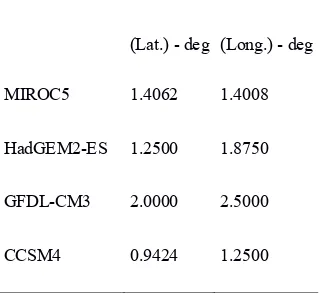
Daily precipitation from IPCC AR5 CMIP5 models (Taylor et al., 2012) was used in this study (Table 1, available at http://pcmdi9.llnl.gov/esgf-web-fe/). Model results from historical simulations (1956 to 2005) and future climate projections (2006–2100) under different scenarios were used. Unlike the Special Report on Emissions Scenarios SRES) B1, A1B and A2 used in CMIP3, CMIP5 uses the new RCPs. The RCPs are named according to their radiative forcing level in 2100, i.e. RCP 2.6 corresponds to a radiative forcing of 2.6Wm−2 in 2100.The CMIP5 models have different spatial resolutions to provide fair comparisons with observations.
CMIP5-Models Resolution
(Lat.) - deg (Long.) - deg
MIROC5 1.4062 1.4008
HadGEM2-ES 1.2500 1.8750
GFDL-CM3 2.0000 2.5000
CCSM4 0.9424 1.2500
Table 1: Description of CMIP5 Models
Annual time series of the following indices are constructed for these Models Output data.
• Frequency low to medium rainfall. According to the definition followed by India Meteorological Department, a day is called ‘low to medium rainfall’, if the rainfall of that day is 2.5 mm or more.
• Frequency of heavy rainfall days (including very heavy and extremely heavy). A day is called heavy rainfall day’ if
the rainfall of that day is 64.5 mm or more according to India Meteorological Department.
• A day is called very heavy rainfall day’ if this includes (i.e., 124.5–244.5 mm).
• A day is called very extremely heavy rainfall day’ if this includes (i.e.,>244.5 mm).
3.1 Trend Analysis:
In the present study, trend analysis has been done by using non-parametric Man-Kendall test. This is a statistical method which is being used for studying the spatial variation and temporal trends of hydro climatic series. A non parametric test is taken into consideration over the parametric one since it can evade the problem raised by data skew. Man-Kendall test is preferred when various stations are tested in a single study (Hirsch et al., 1991). Mann-Kendall test had been formulated by Mann (1945) as non-parametric test for trend detection and the test statistic distribution had been given by Kendall (1955) for testing non-linear trend and turning point.
3.2 Mann-Kendall Test: The Mann-Kendall statistic S is given as
= ( − ) (1)
The application of trend test is done to a time series xi that is ranked from i = 1,2,………n-1 and xj, which is ranked from j = i+1,2,……….n. Each of the data point xi is taken as a reference point which is compared with the rest of the data points xj so that,
( − ) =
+ 1, > ( − ) 0, = ( − ) −1, < ( − ) .
( 2)
It has been documented that when n ≥ 8, the statistic S is approximately normally distributed with the mean. E(S) = 0
The variance statistic is given as
= ( −1)( 2 + 5)−∑ ( ) ( −1) ( 2 + 5)
18 ( 3)
Where ti is considered as the number of ties up to sample i. The test statistics Zc is computed as
Zc =
⎩ ⎪ ⎨ ⎪
⎧ S−1
Var( S) 0, S = 0 S+ 1
Var ( S) , S < 0
( 4)
the significance level, then the trend is considered as significant.
Kendall’s Tau is estimated as:
τ= 2S
n(n−1) ( 5)
3.3 Sen’s Slope Estimator Test:
The magnitude of trend is predicted by the Sen’s estimator. Here, the slope (Ti) of all data pairs is computed as (Sen, 1968)
Ti = Xjj−−Xkk for i = 1,2,− −−, N ( 6)
Where Xj and Xk are considered as data values at time j and k (j>k) correspondingly. The median of these N values of Ti is represented as Sen’s estimator of slope which is confidence interval and then a true slope can be obtained by the non-parametric test. Positive value of Qi indicates an upward or increasing trend and a negative value of Qi gives a downward or decreasing trend in the time series.
4. RESULTS AND DISCUSSION:
Trend analysis of the eastern part of India has been done in the present study with 95 years of precipitation data from 2006 to 2100 for RCP Scenario and 50 years of precipitation data from 1956 to 2005 for historical scenario. Mann-Kendall and Sen’s slope estimator has been used for the determination of the trend.
In Fig. 2, Trend of low to medium rainfall (LTMR) frequency for 95 years for RCP scenario and 50 years for Historical from May to October has been calculated for each Model individually together with the Sen’s magnitude of the slope (Q). At the Mann-Kendall test the Zc statistics revealed the trend of the series for 95 years and 50 years for individual four Models (MIROC5, HadGEM2-ES, CCSM4, and GFDL-CM3) from May to October. The future evolution of Low to medium rainfall and its inter-annual variability have been analyzed based on global coupled model simulations under the RCP scenarios and historical scenarios. This study analyzes whether previous
inconsistency between models regarding the long term trend in the low to medium rainfall under transient warming scenarios still exists in the CMIP-5 generation of climate models. By comparison of the models’ performance with the eastern part of India Zc statistics for historical period and RCP Scenario of the spatial patterns of rainfall. For these models a consistent picture arises: Low to medium rainfall decreases under future warming. All models except HadGEM2-ES simulate the maximum negative trend under the highest concentration pathway RCP-8.5. This result who finds a decreases low to medium rainfall in the Indian summer monsoon period. The changes in long-term Zc statistics for the period 2006–2100 with respect to 1956–2005 are used to analyze how the trends evolve under global warming in each category. The Zc statistics of frequency low to medium rainfall shows a negative (decreasing) trend in most of the models under the RCP-8.5 scenario indicating a decrease in low to medium and RCP scenario in low to medium rainfall category.
In Fig. 3, Trend of Heavy Rainfall (HR) frequency for 95 years for RCP and 50 years for Historical from May to October has been calculated for each Model individually together with the Sen’s magnitude of the slope (Q). At the Mann-Kendall test the Zc statistics revealed the trend of the series for 95 years and 50 years for individual four Models from May to October. The future evolution of heavy rainfall and its inter-annual variability have been analyzed based on global coupled model simulations under the RCP scenarios and historical scenarios. This study analyzes whether previous inconsistency between models regarding
-4
the long term trend in the heavy rainfall under transient warming scenarios still exists in the CMIP-5generation of climate models. By comparison of the models’ performance with the eastern part of India. For these models a consistent picture heavy rainfall increases under future warming. All models except HadGEM2-ES simulate the maximum positive trend under the highest concentration pathway RCP-8.5. This result finds an increased heavy rainfall in the Indian summer monsoon period during abrupt warming. The changes in long-term Zc statistics for the period 2006– 2100 with respect to 1956–2005 are used to analyze how the heavy rainfall evolves under global warming. The Zc statistics of seasonal heavy rainfall show a positive (increasing) trend in most of the models under the RCP-8.5 scenario indicating an increase in heavy rainfall in the future (Fig. 2). MIROC5 and GFDL-CM3 shows slight decrease in Zc statistics under RCP-2.6 scenario. It has to be noted that most models will show an increase in heavy rainfall in the future under various concentration pathways as compared to the historical run. The largest increase is simulated by HadGEM2-ES and CCSM4 under the
RCP-8.5 scenario.
Figure 3: Zc statistics of CMIP5 models under historical and RCP scenario in heavy rainfall category.
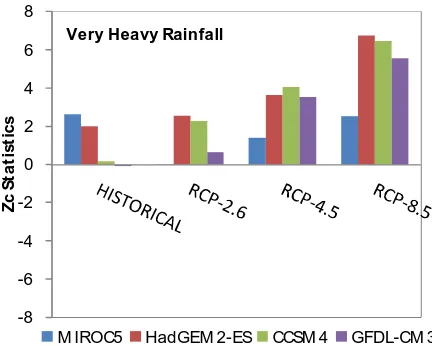
In Fig. 4 Trend of Very Heavy rainfall (VHR) frequency for 95 years for RCP and 50 years for Historical from May to October has been calculated for each Model individually together with the Sen’s magnitude of the slope (Q). At the Mann-Kendall test the Zc statistics revealed the trend of the series for 95 years and 50 years for individual four Models from May to October. The future evolution of very heavy rainfall and its inter-annual variability have been analyzed based on global coupled model simulations under the RCP scenarios and historical scenarios. This study analyzes whether previous inconsistency between models regarding the long term trend in the very heavy rainfall under transient warming scenarios still exists in the CMIP-5generation of climate models. By comparison of the models’ performance with the eastern part of India Zc statistics for historical period from RCP Scenario of the spatial patterns of rainfall. For these models a consistent picture arises extremely heavy rainfall increase under
future warming. All models except HadGEM2-ES simulate the maximum positive trend under the highest concentration pathway RCP-8.5. This result finds an increase in very heavy rainfall in the Indian summer monsoon period during abrupt warming. The percentage changes in long-term Zc statistics for the period 2006–2100 with respect to 1956–2005 are used to analyze how the very heavy rainfall evolves under global warming. The Zc statistics of seasonal very heavy rainfall show a positive (increasing) trend in most of the models under the RCP-8.5 scenario indicating an increase in very heavy rainfall in the future (Fig. 3). All models show an increase in very heavy rainfall under RCP8.5 scenario but MIROC5 shows in RCP-2.6 scenario slight decrease in Zc statistics as compared to the historical run. It has to be noted that most models will show an increase in very heavy rainfall in the future under various concentration pathways. The largest increase is simulated by HadGEM2-ES, CCSM4 and GFDL-CM3 under the RCP-8.5 scenario.
Figure 4: Zc statistics of CMIP5 models under historical and RCP scenario in very heavy rainfall category.
In Fig. 5, Trend of Extremely Heavy Rainfall (EHR) frequency for 95 years for RCP and 50 years for Historical from May to October has been calculated for each Model individually together with the Sen’s magnitude of the slope (Q). At the Mann-Kendall test the Zc statistics revealed the trend of the series for 95 years and 50 years for individual 4 Models from May to October. The future evolution of extremely heavy rainfall and its inter-annual variability have been analyzed based on global coupled model simulations under the RCP scenarios and historical scenarios. This study analyzes whether previous inconsistency between models regarding the long term trend in the extremely heavy rainfall under transient warming scenarios still exists in the CMIP-5generation of climate models. By comparison of the models’ performance with the eastern part of India Zc statistics for historical period from RCP Scenario of the spatial patterns of rainfall. For these models a consistent picture raises extremely heavy rainfall increases under future warming. All models except CCSM4 simulate the maximum positive trend under
-9
M IROC5 HadGEM 2-ES CCSM 4 GFDL-CM 3
-8
the highest concentration pathway RCP-8.5. This result finds an increase extremely heavy rainfall in the Indian summer monsoon period during abrupt warming. The changes in long-term Zc statistics for the period 2006–2100 with respect to 1956–2005 are used to analyze how the extremely heavy rainfall evolves under global warming. The Zc statistics of seasonal extremely heavy rainfall show a positive (increasing) trend in most of the models under the RCP-8.5 scenario indicating an increase in extremely heavy rainfall in the future (Fig. 4). All models show an increase in extremely heavy rainfall under this scenario but also all models shows decrease in Zc statistics under RCP-4.5 scenario as compared to the RCP-2.6 scenario. It has to be noted that most models show an increase in extremely heavy rainfall in under highest emission scenario (RCP8.5). The largest increase is simulated by CCSM4, MIROC5 and GFDL-CM3 under the RCP-8.5 scenario.
Figure 5: Zc statistics of CMIP5 models under historical and RCP scenario in extremely heavy rainfall category.
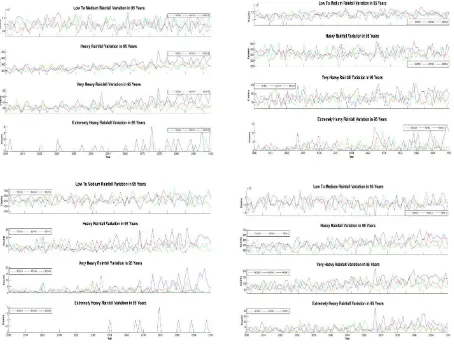
Figure 6: HadGEM2-ES, MIROC5, GFDL-CM3, CCSM4
-6 -4 -2 0 2 4 6
Z
c
S
ta
ti
s
ti
c
s
Ext remely Heavy Rainfall
M IROC5 HadGEM 2-ES CCSM 4 GFDL-CM 3
N A
N A
Variation of annual counts for HadGEM2-ES, MIROC5, GFDL-CM3, CCSM4 models in each category (low to
medium, heavy, very heavy and extremely heavy rainfall) show in Fig. 6
5. CONCLUSIONS:
The present study shows the varieties of rainfall trend in the eastern part of India. Basically, RCP scenario 8.5 shows the decreasing trend in low to medium rainfall, on the other hand, there is rapidly increasing trend in heavy rainfall, very heavy rainfall and extremely heavy rainfall as compared with RCP 2.6 and RCP 4.5 scenario. The Zc value of MK Test represents both positive and negative trends. Rainfall varies in different years which are evident in the graphs. Sen’s slope is also indicating increasing and decreasing the magnitude of the slope in correspondence with the MK Test values. Therefore it can be concluded that there is evidence of any change in the trend of precipitation in the region in these 95 years. Furthermore, when global warming is increasing then there is a decreasing trend for low to medium rainfall which is essential for agricultural practices and on the other hand, there is an increasing trend for heavy, very heavy and extremely heavy rainfall which is responsible for flood, landslides in this study area.
ACKNOWLEDGEMENTS
The authors would like to thank the Department of Science and Technology under Ministry of Science and Technology, DST, Govt. Of India for sponsoring the project “Study of Extreme Rainfall Events over India in the Context of Climate Change” at K. Banerjee Centre of Atmospheric and Ocean Studies at University of Allahabad, Uttar Pradesh, India.
REFERENCES
Hirsch, R. M., Alexander, R. B., Smith, R. A., 1991. Selection of methods for the detection and estimation of trends in water quality, Water Resources Research. 27, pp. 803-813.
IPCC. 1990. Climate Change: The IPCC Scientific Assessment (1990). Cambridge University Press: Cambridge, UK.
IPCC. 2001. Climate Change 2001: The Scientific Basis. Contribution of Working Group I to the Third Assessment Report of the Intergovernmental Panel on Climate Change. Cambridge University Press:Cambridge, UK.
IPCC. 2007. Climate Change 2007: The Scientific Basis. Contribution of Working Group I to the Fourth Assessment Report of the Inter-governmental Panel on Climate Change. Cambridge UniversityPress: Cambridge, UK. Kendall, M. G., 1955. Rank Correlation Methods. Griffin, London.
Li, H., Feng, L., Zhou, T., 2011. Multi-model projection of July–August climate extreme changes over China under CO2 doubling. Part I: precipitation. Advances Atmospheric Sciences, 28, pp. 433–447.
Mann H B 1945 Nonparametric tests against trend, Econometrica 13 245-259
McAfee, S. A., Russell, J. L., Goodman, P. J., 2011. Evaluating IPCC AR4 cool-season precipitation simulations and projections for impacts assessment over North America, Climate Dynamics, 37, pp. 2271-2287. Miao CY, Ni JR, Borthwick AGL, Yang L. 2011. A preliminary estimate of human and natural contributions to the changes in water discharge and sediment load in the Yellow River. Global Planetary Change, 76, pp. 196–205.
Miao, C. Y, Duan, Q.Y, Sun, Q. H. and Li, J. D. 2013. Evaluation and application of Bayesian multi-model estimation in temperature simulations. Progress in Physical Geography, 37, pp. 727–744.
Ou, T., Chen, D., Linderholm, H. W., Jeong, J. H., 2013. Evaluation of global climate models in simulating extreme precipitation in China. Tellus A, 65, pp.: 19799, DOI: 10.3402/tellusa.v65i0.19799.
Sen, P. K., 1968. Estimates of the regression coefficient based on Kendall's tau, Journal of American Statistical Association, 63, pp. 1379-1389
Taylor, K. E., Stouffer, R. J. and Meehl, G. A., 2012. An overview of CMIP5 and the experiment design. Bulletin of
American Meteorological Society. Soc. 93, pp. 485–498.
Xu, C., Luo, Y., Xu, Y., 2011. Projected changes of precipitation extremes in river basins over China. Quat. Int.