TOWARDS A MORE EFFICIENT DETECTION OF EARTHQUAKE INDUCED FAÇADE
DAMAGES USING OBLIQUE UAV IMAGERY
D.Duarte a*, F.Nex a, N. Kerle a ,G. Vosselmana
a Faculty of Geo-Information Science and Earth Observation (ITC), University of Twente, Enschede, The Netherlands,
(d.duarte, f.nex, n.kerle, george.vosselman @utwente.nl)
Commission I, ICWG I/II
KEY WORDS: multi-view, damage detection, urban search and rescue, salient object detection, deep learning
ABSTRACT:
Urban search and rescue (USaR) teams require a fast and thorough building damage assessment, to focus their rescue efforts accordingly. Unmanned aerial vehicles (UAV) are able to capture relevant data in a short time frame and survey otherwise inaccessible areas after a disaster, and have thus been identified as useful when coupled with RGB cameras for façade damage detection. Existing literature focuses on the extraction of 3D and/or image features as cues for damage. However, little attention has been given to the efficiency of the proposed methods which hinders its use in an urban search and rescue context. The framework proposed in this paper aims at a more efficient façade damage detection using UAV multi-view imagery. This was achieved directing all damage classification computations only to the image regions containing the façades, hence discarding the irrelevant areas of the acquired images and consequently reducing the time needed for such task. To accomplish this, a three-step approach is proposed: i) building extraction from the sparse point cloud computed from the nadir images collected in an initial flight; ii) use of the latter as proxy for façade location in the oblique images captured in subsequent flights, and iii) selection of the façade image regions to be fed to a damage classification routine. The results show that the proposed framework successfully reduces the extracted façade image regions to be assessed for damage 6 fold, hence increasing the efficiency of subsequent damage detection routines. The framework was tested on a set of UAV multi-view images over a neighborhood of the city of L’Aquila, Italy, affected in 2009 by an earthquake.
1. INTRODUCTION & RELATED WORK
Early post-disaster efforts, in particular the delineation and optimization of urban search and rescue (USaR) deployment, require fully automated, fast and detailed building damage assessment. This detailed damage information aids in the identification of viable rescue sites and is commonly performed by an USaR mobile team (United Nations 2015). However, in a hazard event such as an earthquake, ground observations have several limitations: limited access/points of view, procedure requiring a substantial amount of time and the need of sufficient USaR personnel.
Remote sensing has been recognized as a critical aid in building damage assessment (Dong and Shan 2013). Optical (Dell’Acqua and Polli 2011; Vetrivel et al. 2017), radar (Gokon et al. 2015; Marin et al. 2015) or laser instruments (Armesto-González et al. 2010; Khoshelham et al. 2013) have already been used successfully in building damage detection. These, mounted on aerial platforms may acquire data in a short time interval and allow the automatization of the damage detection procedures (Dell’Acqua and Gamba 2012).
In particular, aerial images have been demonstrated to be suited for building damage assessment (Dong and Shan 2013; Vetrivel et al. 2016b). The use of overlapping images allows for the computation of 3D point clouds, adding geometric information to the radiometric content of the images. While the point clouds are usually used to detect damages in the form of geometrical deformations (e.g. collapsed building), the images are used to detect damage evidences which may not be clearly represented in the point cloud (e.g. cracks or spalling) (Fernandez Galarreta et al. 2015; Sui et al. 2014; Vetrivel et al. 2016a).
* Corresponding author
Nadir aerial imagery readily depicts totally collapsed buildings or damaged roofs (Ma and Qin 2012). However, nadir imagery is physically constrained by its capture geometry and cannot directly observe the façades. Even a pancake collapse of a building or a partially collapsed façade with an otherwise intact roof cannot be directly identified.
To overcome this limitation, airborne multi-view images started to be exploited for building damage assessment. With this capture geometry it is possible to survey directly the façades, and consequently, assess them for damage evidences (Gerke and Kerle 2011). Nonetheless, unmanned aerial vehicles (UAV) with their fast data acquisition, centimetre resolution, high revisit capability, low cost and possibility of surveying otherwise inaccessible or dangerous areas, seem to be the fit-for-purpose platform for USaR building damage assessment.
Similar to the airborne, the UAV multi-view images are usually collected with enough overlap to derive a 3D point cloud through the computationally expensive dense image matching (DIM). This allows to assess geometrical deformations through the extraction of 3D features (Fernandez Galarreta et al. 2015; Vetrivel et al. 2017). Assuming that a given façade is still standing or is only partially collapsed, the image information becomes critical to identify damage evidences that may not be translated into any deformation in an image-derived point cloud (Fernandez Galarreta et al. 2015). The relevance of the images for damage detection was also pointed out by Vetrivel et al. (2017). The authors indicated the negligible increase in accuracy when using 3D features and convolutional neural network (CNN) features in a multiple-kernel-learning approach, instead of the CNN features alone. This approach reached an average damage detection accuracy of 85%, solely using CNN features derived The International Archives of the Photogrammetry, Remote Sensing and Spatial Information Sciences, Volume XLII-2/W6, 2017
from labelled image samples from UAV datasets, not containing samples from the dataset being analysed for damage.
When the 3D information is not generated, the time needed for the damage detection part is reduced. However, the processing time is still lengthy, due to the high amount of images that are usually collected in such UAV-multi-view surveys.
Procedures like the simple linear iterative clustering (SLIC) (Achanta et al. 2012) segmentation are often used as starting point for current object-based or damage classification procedures, as in the CNN approach indicated earlier. These are applied to every image of a given dataset, which is not efficient. The temporal inefficiency is not a problem in many applications but limits the use of such methods in the USaR context. The objective of this contribution is to propose a more efficient approach for a thorough façade damage detection using UAV multi-view imagery. Specifically, the aim is to avoid the computationally expensive procedures, and to direct all damage classification computations only to the images and image portions containing the façades, hence discarding the irrelevant areas of the captured UAV images. To accomplish this, a three-step approach is proposed, taking advantage of the rapid data acquisition and ready revisiting capabilities of the UAV (see Figure 2): i) extract the building’s roof outline from the sparse point cloud generated from nadir images alone; ii) use the latter as a proxy for façade location in the oblique images, using the raw image orientation information of the UAV, and iii) damage detection only on relevant patches of the extracted façade image patch using the CNN as in Vetrivel et al. (2017). More details regarding the method are given in section 3.
The remainder of the paper contains in section 2, a description of the data used in the experiment. Section 4, contains the results, followed by discussion and conclusion, in sections 5 and 6, respectively.
2. DATA
The proposed approach was tested on a set of UAV multi-view images, captured using a Sony ILCE-6000 mounted on an Aibot X6 hexacopter. It comprises a subset of 281 nadir images, and four subsets of oblique images (891 images in total, one set for each cardinal direction). These were captured using a flying height of approximately 100 m with 70-80% forward overlap and 60-70% side lap. The average ground sampling distance is ~0.04m.
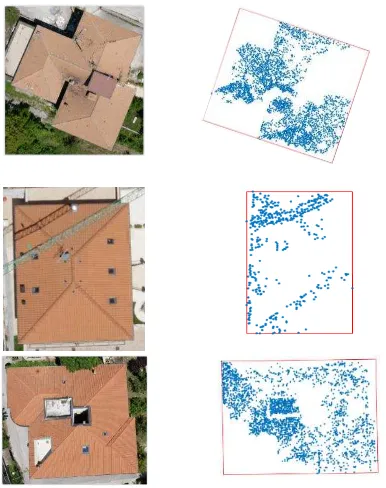
The captured images depict the damage caused by the M5.9 April 6th2009 earthquake in L’Aquila, Italy. These were acquired over a city block of approximately10 ha. The scene contains partial collapses and buildings with smaller signs of damage (e.g. cracks and spalling). In spite of the image capture only being performed in 2016, the area of the city covered was abandoned and still contains the damage evidences from the 2009 earthquake, with only very limited reconstruction taking place. Due to the time interval between event and capture, and since the area is still largely untouched since the earthquake, it contains several areas with high vegetation. Hence, many of the façades are not visible, even in the oblique images (see Figure 1), making this dataset more challenging for research purposes.
Figure 1 Three examples of vegetation occlusion in the UAV multi-view L'Aquila dataset
3. METHOD
The central idea behind the targeted efficiency increase in façade damage mapping, is to reduce not only the number of images that are used in a façade damage detection routine, considering a conventional grid flight; but also to reduce the area of the oblique images to be fed for damage classification. In a first stage the façades are defined. This façade location allows to select only the oblique images that contain a given façade. Moreover, knowing the façade location also enables the identification of the oblique image patch corresponding to a given façade. Only this patch is then fed to the damage detection step. The second core idea regarding this method is to avoid that the whole façade image patch is fed to the damage assessment phase. The façade image patch is divided into equilateral patches of a given size, where only patches with early evidence of damage are fed to the damage classification step, which will use a pre-trained CNN, more details in section 3.3.
The approach can be divided in three main steps as presented in Figure 2. The initial step is to detect the buildings, that will be used as proxies for the presence of façades. The second step is to use the façade locations to extract the façade patch from the oblique images. The last step refers to the façade damage detection on the previously extracted façades.
Figure 2 Overview of the method - divided into the three main components
3.1 Building detection and façade definition
The first step of the method is to locate the façades, as shown in Figure 3. Considering that every façade is connected to a building roof, this need to be located and a building hypothesis formulated, to subsequently define the façades. Usually the DIM point cloud is used as the main source of information to perform the building extraction phase. This is due to the general assumption that building roofs are elevated (above ground) objects composed by planar surfaces.
Figure 3 Building extraction and facade definition flowchart
Since one of the aims of the proposed approach is to avoid the computationally expensive DIM, it is hypothesized that to detect the building’s roof, the (sparse) tie point cloud suffices. A conventional UAV nadir flight generates a large amount of images, and it is expected that the sparse point cloud is dense enough to derive building information. To reduce the number of outliers only tie points present in at least three images are considered.
The sparse point cloud is generated using Pix4D, which also generates the internal camera parameters and the updated orientation of the images. In a first step, a distinction is needed from on and off ground points, to identify the elevated objects present in the scene. This is achieved recurring to LAStools software package which uses the method proposed by Axelsson (2000). Due to the common heterogeneity of sparse point clouds, since these rely on the texture present in the scene to compute the point correspondences, isolated points are removed with lasnoise. This is performed to avoid the inclusion of these isolated points in the building detection phase. With the isolated points removed, the following step is to differentiate between on and off ground points, using lasground. This further allows to obtain a normalized height surface by differencing each of the off ground points by its closest on groud point.
1) Building detection from the off ground points: the off ground points of the sparse point cloud are segmented into disjoint planar segments as described in Vosselman (2012). An initial set of 10 points is used to estimate the plane equation and initialize the region growing algorithm. An initial distance threshold of 0.3 m is used to determine these points. New points are added considering a radius of 2 m to define the local neighbourhood: only those that have a distance from the plane lower than 1 m are added. These adopted parameters are intentionally lax in order to address the low and heterogeneous point density of some building roofs. Since there still may exist points on vertical elements of building roofs, segments with a slope greater than 70% are discarded.
The resulting segments are then merged into building regions using a connected component analysis.
2) Façades per detected building: the points belonging to a given building region are initially projected into the xy plane. The proposed algorithm then assumes that each building has 4 or more facades and that they are mutually perpendicular. Using this assumption, the points are then fitted with a minimum-area bounding rectangle (Freeman and Shapira 1975), defining, in this way, the 4 main façade directions of a building region. The planes
of the main façades directions are finally computed considering the same X, Y coordinates of the bounding rectangle corners and assigning as Z values the mean roof height and the ground mean values, respectively.
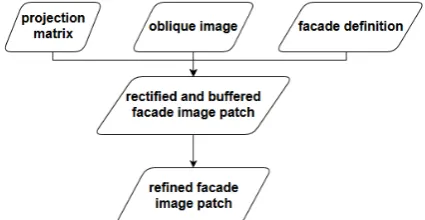
3.2 Façade extraction from oblique views
The façade regions defined before are used to locate their corresponding image patch on the oblique images, see Figure 4. The images are not relatively oriented by means of photogrammetric procedures but using the raw GNSS/IMU (X,Y,Z,ω,φ,κ) information from the UAV navigation system. The accuracy of such raw GNSS/IMU data can range from 2-10m for the positions and 0.5-5 deg for the attitudes (Eling et al. 2014).
Figure 4 Flowchart regarding the facade extraction from the oblique images
A projection matrix is built using the camera internal parameters and the raw orientation from the UAV stored in the image as exif metadata. With the projection matrix and the 4 3D corners of the façade it is possible to re-project the 3D corners into the image. The extracted image patch can then be rectified defining the real-world plane formed by the 4 3D façade corners. However, since the raw UAV image orientation is not accurate, the extraction of the patch containing the whole façade can be a difficult task. The extracted image patch is therefore buffered in image space. The extracted image patch now contains other objects from the scene in its background, apart from the façade itself. This patch needs to be refined before its use in the damage assessment because: 1) it increases the image area to be analysed; 2) neighbouring objects could also contain damaged areas, hindering the damage classification of the analysed façade. Hence, a further refinement of the façade location is performed using two main sets of information: 1) salient object probability image (Tu et al. 2016), and 2) line segments analysis on the façade (Yi Li and Shapiro 2002).
1) Salient object probability image: the problem to distinguish the façade from its neighbouring objects in image space is in accordance with the objective of salient object detection, which aims to distinguish the figure from the background in a given image (Borji et al. 2015). A real-time salient object detection algorithm (Tu et al. 2016), using a minimum spanning tree image representation, is used as one set of information to distinguish the façade from the background resulting from the applied buffer. This salient object detection approach uses the image boundary pixels as seed points for the background detection. In this approach, the boundaries of the buffered image patch extracted before are assumed to be dissimilar from the façade. The result of the application of this algorithm is an image containing the probability of a given pixel to belong to the figure, in this case, the façade. This probability map is then transformed to a binary image, where only the blob occupying the largest image area is considered.
2) Façade line segments analysis: the images should provide a clear indication of horizontal and vertical elements on the image façade. These lines should appear as perpendicular in the rectified patches. The vertical and horizontal line segments are extracted using the line segment extraction as described in (Košecká and Zhang 2002), which uses the Canny edge detector (Canny 1986) followed by a line fitting stage (Kahn et al. 1990). Line segments which are not vertical nor horizontal (within a 10 degree tolerance) are not considered. In the case the intersection between a vertical and a horizontal line segment is on, or close to the edges of the extended line segments, these are considered as façade line segments (Yi Li and Shapiro 2002).
The salient object detection blob and the façade line segments analysis are finally merged to detect the actual façade within the buffered façade image patch. Every façade line segment which overlays with the salient object blob is considered as part of the façade. The façade area is defined by the image coordinates of the detected façade lines: the maximum and minimum of both x and y pixel coordinates are used to define the rectangle to crop the façade image patch.
3.3 Damage assessment on the refined façade image patch
The cropped façade region is used as input for the damage assessment step. This patch is further divided into equilateral patches (50px size), these are the unit of analysis.
The developed method exploits the presence of vertical and horizontal elements on the rectified patch to quickly analyse the façade. The gradient information has previously been used in contributions aiming at façade decomposition (Recky and Leberl 2010; Teeravech et al. 2014). In this case, the objective is to early select patches in which the gradient information indicates the patches that are candidates for damage. The vertical and horizontal gradients are computed for each patch and posteriorly projected into the horizontal and vertical axes. For each axis, the local maxima and minima of the gradients are computed, and its concentration per axis is determined (peaks per pixel ratio). Figure 5 contains two examples (one damaged and one non-damaged) of the projection of the vertical and horizontal gradients. The peaks ratio for the non-damaged patch (Figure 5, left) is of 0.11 and 0.12, respectively for the horizontal and vertical projection of the gradients. The peaks ratio for the damaged patch (Figure 5, right), is of 0.45 and 0.33, respectively for the horizontal and vertical projection of the gradients. A candidate for damage is considered when the ratio peaks/pixel is greater than 0.25 on both axes: this number has been experimentally defined and it is intentionally low in order to avoid discarding damaged patches. The image patches where anomalies are detected are further analysed using a pre-trained damage classification CNN as described in Vetrivel et al. (2017). The used model allows to distinguish between damaged and intact regions and it is pre-trained with a set of approximately 8000 training samples (4000 for each class) obtained from several sets of UAV multi-view imagery.
Figure 5 Projection of the vertical and horizontal gradients :in a non-damaged façade patch (left) and damaged façade patch (right).
4. RESULTS
The described method has been applied to the set of data presented in section 2. For each sub-section of the method, a corresponding sub-section in this results section is given.
4.1 Building hypothesis generation and façade definition
This sub-section presents the results for the building detection and façade definition from the sparse point cloud.
Figure 6 presents the sparse point cloud and the corresponding detected buildings (coloured). As can be noted in this figure, the sparse point cloud density is not homogenous throughout the project area, as it highly depends on the texture of the different regions and the image block overlap.
Figure 6 Sparse point cloud, left ; building hypothesis (coloured) overlaid on the sparse point cloud , right
Three examples of the façade definition are given in Figure 7. As can be noted, the proposed approach successfully defines the 4 main façade directions. Since the building edges are usually good candidates for tie points, most of the extracted building regions had a greater concentration of points in those regions. As such, even in the case the point density is low, the main façade identification was successful. This is central to correctly define the minimum bounding rectangle.
Figure 7 Façade definition. Nadir view of 3 buildings, left and corresponding xy projected sparse points (blue points), and minimum area bounding rectangle (red rectangle), right
With this approach only a building was not identified, because it was partially covered by vegetation, this biased the plane based segmentation and the following building detection. Another issue was the inclusion of points outside the building roof see Figure 8, that happened in one building, hindering the following façade definition.
Figure 8 Details of 3 detected building roofs. Left nadir image; right sparse point cloud overlaid with the detected buildings - red circle indicates a segment which is part of the vegetation but is identified as part of a roof segment.
4.2 Façade extraction from oblique views
This subsection presents the result of the façade extraction from the oblique images, using the façades defined previously. The used buffer was 350px, to account for the use of the raw orientation coming from the UAV. This buffer was sufficient to successfully capture the whole extent of the façades.
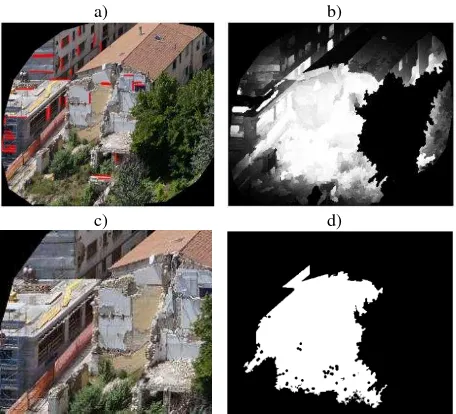
From the 40 considered buffered façade image patches, only 2 were incorrectly extracted due to an incorrect result in the salient object detection (see Figure 9, a and d). This resulted in the extraction of only a small patch of the whole façade. The edges of the buffered image patch in Figure 9 a, contain radiometric similarities with the façade itself. This hindered the real-time salient object detection (since this approach assumes that the image edges are background hence a cue to distinguish it from the façade). The façade line segments, in this case, enclosed only a part of the façade.
a) b) c)
d) e) f)
Figure 9 Three examples of the salient object detection results, second row (white regions show a higher probability of the pixel pertaining to the façade)
Figure 10 and Figure 11, show the result of the application of the salient object detection combined with the façade line segments to define the façade image patch. In these figures is also visible how the façade line segments information complemented the salient object detection. As it can be noticed in Figure 10, there was no significant impact of the building having more than 4 façades, due to the fitting of the minimum-area bounding rectangle. In this case, and since the other smaller façade shared the same plane orientation, the rectification procedure had a different scale for each façade plane. On the other hand, the results depicted in Figure 11 were hindered by both the presence of façade line segments of a neighbouring façade and by the inclusion of that same façade in the salient object detection. In this case, however, the whole façade patch was still considered.
a) b)
c) d)
Figure 10 Results of the façade line segments and salient object map: a) façade line segments overlaid in buffered façade patch, b) real-time salient object, c) final refined facade patch, d) binary image of the salient object detection in b)
a) b)
c) d)
Figure 11 Results of the façade line segments and salient object map: a) façade line segments overlaid in buffered façade patch, b) real-time salient object, c) final refined facade patch, d) binary image of the salient object detection in b)
4.3 Damage assessment on the refined façade image patch
This sub-section presents the results for the damage detection on the refined façade image patch.
Table 1 provides the damage classification results, considering the building façades as unit of analysis. Considering 11 damaged façades, 10 contained at least one patch classified as damaged. However, 1 façade was incorrectly classified as not-damaged. Considering the non-damaged façades, 23 were correctly identified as not-damaged, while 6 were incorrectly classified as damaged.
Façade damage classification No.
Correctly classified as damaged 10 Incorrectly classified as damaged 6 Correctly classified as not-damaged 23 Incorrectly classified as not-damaged 1
Precision = 62% ; Recall= 90% ; Accuracy= 83% Table 1 Results of the façade damage classification on 40 façades
The visual outcome of the damage classification is depicted in several examples in Figure 12. Ground regions and overhanging elements of the façade contain most of the false positives. Table 2 provides the results regarding the number of the classified patches on all the façades. The projection of the gradient information in the form of a peaks/pixel ratio allowed to successfully omit 1233 patches from the CNN damage classification. A total of 179 image patches were classified by the CNN, 83 of which as damaged.
Patches assessed for damage
Patches confirmed damaged (CNN)
Patches not considered (gradient peaks)
179 83 1233
Table 2 Results regarding the early selection of patches to be fed to the CNN, considering the 40 façades
a)
b)
c)
d)
Figure 12 Refined façade damage detection results: a, b, c and d. Damaged patches overlaid in red.
5. DISCUSSION
The use of the sparse point cloud to extract the buildings, through a plane base segmentation followed by a connected component analysis, has been validated on 40 façades. In spite of the heterogeneous 3D point density in such a point cloud, only one building was not identified due to vegetation occlusions that hindered the plane based segmentation. However, in cases where the building roof does not reflect the actual orientation of the façades, these are not properly rectified, hindering the consequent analysis.
The buffer used in the extraction of the façade image patch also sufficed to account for the poor raw orientation from the UAV navigation system. However the adoption of the same buffer size for every façade is not optimal due to the variability in the image georeferencing inaccuracies and due to the varying façade size. The posterior façade patch refinement using line segments and the salient object image, successfully depicted the façade location. However, 2 façades were incorrectly extracted due to a wrong salient object detection.
The use of the projection of the vertical and horizontal gradient, allowed to decrease the refined façade image patch regions to be processed by the damage classification step. Only approximately 1/6 of the total regions contained in the refined façade image patch were considered for classification.
The results of the damage classification using a CNN, at a refined façade image patch level, are in accordance with the results obtained in Vetrivel et al. (2017). Scene characteristics like ground regions, overhanging objects in the façade, construction sites and roof tiles, are the main cause of the false positives (6) reported in the results.
In spite of the increase in efficiency it must be noted that the façades which were wrongly defined from the sparse point cloud or incorrectly extracted from the images, are not assessed for damage. This is one of the main drawbacks of the proposed method.
6. CONCLUSIONS
In this paper a methodology to increase the efficiency of façade damage detection using a set of UAV multi-view imagery was presented. The higher productivity of the method was achieved by reducing the number of images and image regions to be analysed for damage in a three step approach.
One of the major contributions of the presented approach was the possibility of using the sparse point cloud to detect building roofs. This allowed to omit the generation of the computationally expensive DIM, increasing the speed of the façade damage detection.
The 4 main façade directions, together with the raw orientation information from the navigation system of the UAV, were used to identify the façades in the oblique images. Due to the uncertainties of such orientation information, a wide image buffer was adopted. Future work will address this issue, by relating, the façade size with the size of the buffer to apply. The salient object detection coupled with the façade line segments, successfully identified the façade in the buffered image patch, reducing the area to be used in the subsequent earthquake UAV multi-view datasets could represent a limiting factor. Another possibility to improve these results would be to
consider more than one image to assess the damage state of a given façade.
The presented methodology is still an on-going work, the final goal would be to reach a near-real-time façade damage detection. In this regard, a new way to acquire images could be considered, planning the acquisitions of the oblique views on the basis of the buildings extracted from the sparse point cloud, hence decreasing the amount of collected images. Moreover, the information provided by nadir images may be also used to detect evidences of façade damage, such as blow out debris or rubble piles in the vicinity of the building. This would enable a prioritization of the planed oblique views.
ACKNOWLEDGEMENTS
The work was funded by INACHUS (Technological and Methodological Solutions for Integrated Wide Area Situation Awareness and Survivor Localisation to Support Search and Rescue Teams), a FP7 project with grant number: 607522.
REFERENCES
Achanta, R., Shaji, A., Smith, K., Lucchi, A., Fua, P., and Süsstrunk, S. (2012). “SLIC superpixels compared to state-of-the-art superpixel methods.” IEEE Transactions on Pattern Analysis and Machine Intelligence, 34(11), 2274–2282.
Armesto-González, J., Riveiro-Rodríguez, B., González-Aguilera, D., and Rivas-Brea, M. T. (2010). “Terrestrial laser scanning intensity data applied to damage detection for historical buildings.” Journal of Archaeological Science, 37(12), 3037– 3047.
Axelsson, P. (2000). “DEM generation from laser scanning data using adaptive TIN models.” International Archives of Photogrammetry and Remote Sensing, Amsterdam, 111–118.
Borji, A., Cheng, M.-M., Jiang, H., and Li, J. (2015). “Salient object detection: a benchmark.” IEEE Transactions on Image Processing, 24(12), 5706–5722.
Canny, J. (1986). “A computational approach toedge detection.” IEEE Transactions on Pattern Analysis and Machine Intelligence, PAMI-8(6), 679–698.
Cheng, G., Han, J., and Lu, X. (2017). “Remote sensing image scene classification: benchmark and state of the art.” Proceedings of the IEEE, 1–19.
Dell’Acqua, F., and Gamba, P. (2012). “Remote sensing and earthquake damage assessment: experiences, limits, and perspectives.” Proceedings of the IEEE, 100(10), 2876–2890.
Dell’Acqua, F., and Polli, D. A. (2011). “Post-event only VHR radar satellite data for automated damage assessment.” Photogrammetric Engineering & Remote Sensing, 77(10), 1037– 1043.
Dong, L., and Shan, J. (2013). “A comprehensive review of earthquake-induced building damage detection with remote sensing techniques.” ISPRS Journal of Photogrammetry and Remote Sensing, 84, 85–99.
Eling, C., Klingbeil, L., Kuhlmann, H., Bendig, J., and Bareth, G. (2014). “A precise direct georeferencing system for UAVs“. Geographisches Institut der Universität zu Köln - Kölner Geographische Arbeiten.
Fernandez Galarreta, J., Kerle, N., and Gerke, M. (2015). “UAV -based urban structural damage assessment using object--based image analysis and semantic reasoning.” Natural Hazards and Earth System Science, 15(6), 1087–1101.
Freeman, H., and Shapira, R. (1975). “Determining the minimum-area encasing rectangle for an arbitrary closed curve.” Communications of the ACM, 18(7), 409–413.
Gerke, M., and Kerle, N. (2011). “Automatic structural seismic damage assessment with airborne oblique Pictometry© imagery.” Photogrammetric Engineering & Remote Sensing, 77(9), 885–898.
Gokon, H., Post, J., Stein, E., Martinis, S., Twele, A., Muck, M., Geiss, C., Koshimura, S., and Matsuoka, M. (2015). “A method for detecting buildings destroyed by the 2011 Tohoku earthquake and tsunami using multitemporal TerraSAR-X data.” IEEE Geoscience and Remote Sensing Letters, 12(6), 1277–1281.
Kahn, P., Kitchen, L., and Riseman, E. M. (1990). “A fast line finder for vision-guided robot navigation.” IEEE Transactions on Pattern Analysis and Machine Intelligence, 12(11), 1098–1102.
Khoshelham, K., Oude Elberink, S., and Sudan Xu. (2013). “Segment-Based classification of damaged building roofs in aerial laser scanning data.” IEEE Geoscience and Remote Sensing Letters, 10(5), 1258–1262.
Košecká, J., and Zhang, W. (2002). “Video Compass.” Computer Vision — ECCV 2002, A. Heyden, G. Sparr, M. Nielsen, and P. Johansen, eds., Springer Berlin Heidelberg, Berlin, Heidelberg, 476–490.
Ma, J., and Qin, S. (2012). “Automatic depicting algorithm of earthquake collapsed buildings with airborne high resolution image.” IEEE, 939–942.
Marin, C., Bovolo, F., and Bruzzone, L. (2015). “Building Change Detection in Multitemporal Very High Resolution SAR Images.” IEEE Transactions on Geoscience and Remote Sensing, 53(5), 2664–2682.
Recky, M., and Leberl, F. (2010). “Window detection in complex facades.” IEEE, 220–225.
Sui, H., Tu, J., Song, Z., Chen, G., and Li, Q. (2014). “A novel 3D building damage detection method using multiple overlapping UAV images.” ISPRS - International Archives of the Photogrammetry, Remote Sensing and Spatial Information Sciences, XL-7, 173–179.
Teeravech, K., Nagai, M., Honda, K., and Dailey, M. (2014). “Discovering repetitive patterns in facade images using a RANSAC-style algorithm.” ISPRS Journal of Photogrammetry and Remote Sensing, 92, 38–53.
Tu, W.-C., He, S., Yang, Q., and Chien, S.-Y. (2016). “Real-time salient object detection with a minimum spanning tree.” IEEE, 2334–2342.
United Nations. (2015). “INSARAG Guidelines, Volume II: Preparedness and Response, Manual B: Operations.” United Nations Office for the Coordination of Humanitarian Affairs (OCHA).
Vetrivel, A., Duarte, D., Nex, F., Gerke, M., Kerle, N., and Vosselman, G. (2016a). “Potential of multi-temporal oblique airborne imagery for structural damage assessment.” ISPRS Annals of Photogrammetry, Remote Sensing and Spatial Information Sciences, III-3, 355–362.
Vetrivel, A., Gerke, M., Kerle, N., Nex, F., and Vosselman, G. (2017). “Disaster damage detection through synergistic use of deep learning and 3D point cloud features derived from very high resolution oblique aerial images, and multiple-kernel-learning.” ISPRS Journal of Photogrammetry and Remote Sensing.
Vetrivel, A., Gerke, M., Kerle, N., and Vosselman, G. (2016b). “Identification of structurally damaged areas in airborne oblique images using a Visual-Bag-of-Words approach.” Remote Sensing, 8(3), 231.
Vosselman, G. (2012). “Automated planimetric quality control in high accuracy airborne laser scanning surveys.” ISPRS Journal of Photogrammetry and Remote Sensing, 74, 90–100.
Yi Li, and Shapiro, L. G. (2002). “Consistent line clusters for building recognition in CBIR.” IEEE Comput. Soc, 952–956. The International Archives of the Photogrammetry, Remote Sensing and Spatial Information Sciences, Volume XLII-2/W6, 2017