AN IMPROVED ALGORITHM USED IN AUTOMATIC MATCHING FOR
LOW-ALTITUDE AERIAL IMAGE
Xue WAN, Zuxun ZHANG, Youchuan WAN
School of Remote Sensing Science and Technology, Wuhan University, 129 Luoyu Road, Wuhan 430079, China
[email protected], [email protected], [email protected]
Commission VI, Youth Forum
KEY WORDS: Image matching; SIFT operator; feature extraction; low-altitude remote sensing; zero-crossing; correlation coefficient; principal orientation
ABSTRACT:
In this paper, we present an improved algorithm used for low altitude aerial image automatic matching based on SIFT operator. Compared to traditional photogrammetry based on platforms such as satellites and aerospace aircrafts, the platforms of low-altitude remote sensing system have relatively lighter weight, therefore existing rotation angle and scale differences in the stereo-images. In addition, there appears fracture lines and the discontinuities of parallax in the elevation undulating area. The characteristics above make it unsuitable for the traditional photogrammetry matching method based on grey scale correlation and the matching search strategy based on continuous parallax.
In this paper an improved SIFT(Scale-invariant feature transform) operator is applied to the automatic matching of low-altitude aerial images. Several improvements were made to enhance the feature recurrence rate, matching correct rate and speed of matching. Firstly, we applied the theory of zero-crossing in SIFT feature extraction introducing the image geometry feature in scale space detection. Secondly, correlation coefficient is used as similarity measure instead of Euclidean distance in SIFT algorithm. Thirdly, we proposed a new matching strategy based on principal orientation constrain to shorten the search distance compared to the global search in SIFT algorithm.
To demonstrate the feasibility of the approach, experiments were carried with four groups low-altitude remote sensing stereo-images from different sensors, and presented different distortions. Results showed that the improved algorithm has higher feature recurrence rate, matching correct rate and speed of matching dealing with different scale, large rotation angle, affine distortion and nonlinear distortion of low-altitude remote sensing stereo-images.
1. INTRODUCTION
These years, the rapid development of platform and system in low-altitude remote sensing result in many applications in quickly update of large-scale remote sensing image, stitch of panoramic images and construction of three-dimensional digital city model. Low-altitude remote sensing refers to digital aerial photography in low-altitude with flight height ranging from 300 to 1500 meters. Compared to traditional photogrammetry based on platforms such as satellites and aerospace aircrafts, low-altitude aerial remote sensing platforms such as airships and unmanned aerial vehicles are low cost, autonomous or remote control and relatively independent on the weather conditions. However, the relatively light weight of low-altitude remote sensing platforms results in poor flight stability, and therefore existing rotation angle and image scale differences in the stereo-images. In addition, because of low-altitude and large scale photographic imagery, there appears the discontinuities of parallax caused by fracture lines in the elevation undulating area (such as skyscrapers). The characteristics above make it unsuitable for the traditional photogrammetry matching method based on grey value correlation and the matching strategy based on continuous parallax. This paper introduced the SIFT operator to cope with the matching problems in low-altitude remote sensing. Meanwhile, several improvements were made to enhance the feature recurrence rate, matching correct rate and speed of matching
2. SIFT ALGORITHM
2.1 Review of SIFT Algorithm
SIFT (Scale-invariant feature transform) is an algorithm in computer vision to detect and describe local features as well as image matching. SIFT operator is first published by Lowe (Lowe, 1999) in 1999. In 2004, Lowe(Lowe, 2004) introduced a more completed SIFT operator. From the experiment of comparative local descriptors (Mikolajczyk etc al, 2005), SIFT operator showed best matching result to different type of distortions in images. Several improvements were made to SIFT operator, such as PCA-SIFT(Yan, 2004), SUFT(Bay, 2006) and A-SIFT(Morel, 2009). As its robust matching result in rotation and scale difference, SIFT operator has been used for object recognition(Sirmacek, 2009), robot navigation(Se, 2001) mapping and 3D scene reconstruction(Iryna, 2006) etc. As described by Lowe(Lowe, 2004), the SIFT algorithm contains four main stages: scale-space extrema detection, key point localization, orientation assignment and key point descriptor. The scale-space extrema detection stage is based on the blob detection methods developed by Lindeberg (Linderberg, 1994), which is detecting local extrema with respect to both space and scale in Difference-of-Gaussian images subtraction from Gaussian-blurred images. Then the key point candidates are interpolated to accurate position using the quadratic Taylor expansion. Meanwhile the key point candidates with low-contrast and edge responses have to be eliminated. In orientation assignment stage, each key point is assigned one or more orientations based on local gradient directions. In the last stage, a 128 dimensions descriptor have been computed for each
key point which is invariant to rotation, scale, illumination, 3D viewpoint, etc. After descriptor constructed, Euclidean distance is used to measure the similarity between the two local descriptors. For one key point descriptors, it is to search for all the key points in the reference image and choose the nearest neighbour.
2.2 SIFT Algorithm for Low-altitude remote sensing
In this paper SIFT operator is applied to the automatic matching of low-altitude aerial images. From the above discussion, the low-altitude remote sensing image matching have two main problems. The first problem is there existing rotation angle and scale difference in stereo images. The second one is discontinuities of parallax in stereo-image. Compared to traditional image matching based on grey value correlation, SIFT operator has its own characteristics of feature description and matching strategy. Firstly, SIFT operator with the scale and rotation invariance, can effectively handle the large rotation angle and different image scale in the low-altitude remote sensing stereo-images. Moreover, the global search method used in SIFT feature matching, can avoid match errors caused by discontinuities of parallax. But there also remains some of the problems with the application of SIFT operator in automatic image matching of low-altitude aerial images. First, the remote sensing images are texture-rich, while the SIFT operator also has large amounts of feature key points with high dimensions of descriptor. However, correctly matching points in SIFT algorithm is much less than the feature points. That means a large waste in computer memory during the feature detection and description. So the feature recurrence rate needs to be improved in this algorithm. Secondly, to meet the need for fast automatically matching in low-altitude images, the time of matching and matching correct rate should be improved. In this paper, we change the similarity measure and the matching strategy in SIFT algorithm.
3. IMPROVED SIFT ALGORITHM
In order to enhance the feature recurrence rate, matching correct rate and matching speed, we made three improvements in feature extraction and image matching. Firstly, we introduced the theory of zero-crossing into the feature extraction to enhance the feature recurrence rate. Then, correlation coefficient and principal orientation constrain was used in image matching to enhance the matching correct rate and speed of matching.
3.1 Zero-crossing Based Feature Extraction
The zero-crossing based on the theory of second-order edge detection. The LOG(Laplacian of Gaussian) operator(Mar, 1980) is based on the detection of zero-crossings applied to a Gaussian-smoothed image. According to Mar, edge features appeared in zero crossings of a second-order derivative local extrema detection. Lindeberg(Lindeberg, 1994) proved that DoG operator LoG operator has a certain connection with a constant.
2
( , , ) ( 1) ( , , )
DoG x y t k LoG x y t (3)
k
represents octave of the Gassian pyramid.Thus the theory of second order edge detection could be applied to DoG operator. In order to record the signal changing of edge in scale space, wikin(Wikin, 1984) first drew a contours of zero-crossings in scale-space, shown in Figure . In the experiment, relatively unchanged. With the increase of convolution kernel, the location of zero-crossings have small offsets along the x-axis due to the disturbance of interact of edge points and image noise. Overall, the distribution of zero-crossings in contour map is stable.
From the above analysis of contours of zero-crossings in scale space, we made some improvements in the feature extraction in SIFT operator.
When building the DoG array, there are both negative values and positive values while subtraction on Gaussian images with different kernels. However, the grey value distribution in image ranges from 0 to 255 without negative value. Thus there exist two ways of data normalization. The first method used absolute value in subtraction and then normalize all absolute data to the range of 0 to 255. The second method directly used both positive and negative values for normalization.
In this paper, we choose the second method for the sake of second order detection. Because the change from negative to positive is crucial in second order detection, thus the information of negative value should be remain in this stage. Then, detect the crossings in DoG array. The zero-pixel will be labelled as feature points. In this paper, T was set as 8.
3.2 Improved SIFT Matching
The image matching result could be effected by two main factors similarity measure and searching strategy. Similarity measure is usually cost function or distance function in order to determine the correctness for the current transformation model for the two images. Commonly used similarity measures are correlation function, cross correlation, coefficient, Euclidean distance, Minkowski distance and Hausdorff distance. For feature matching, distance functions are usually used as a similarity measure, such as Euclidean distance in SIFT operator. In this paper, the correlation coefficient replaced the original Euclidean distance as the similarity measurement to enhance the matching correct rate. Matching strategy is to determine the
search method for features in stereo images. The most simple strategy is to search for all candidates in the reference image which could be time-consuming and error-prone. Thus several matching strategies were add in order to enhance the matching speed. The common matching strategy is based on epipolar line which calculated by strict geometry constrains in stereo images. However, without correct elements of exterior orientation, we could not calculate the epipolar line in stereo image. Thus this paper, we proposed a principal orientation constrain as image matching strategy.
Firstly, because the 12dimension descriptor contain sixteen 8-dimension histograms, the correlation coefficient was calculated between those 8-dimension histograms. weight in reference image, k for correlation coefficient. Then, assign different weight to the 16 histograms according to Gaussian Equation. The histogram near central pixel have higher weight than that far from the central pixel.
2 2 from histogram to the central pixel.
The final correlation coefficient was calculated 8
The features which have the highest correlation coefficient will be consider as candidates for corresponding points. If the correlation coefficient exceed the threshold H.
In this paper, the determination of threshold H is determined
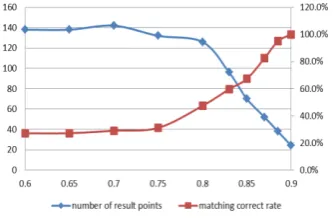
I for correct matching points, Itotalfor total matching points. The high value of matching correct rate represents more robust and higher success rate in image matching. The matching correct rate reflects the function of matching algorithm. The figure below showed the trends of number of result points and matching correct rate with respect to the increase of threshold for correlation coefficient.
Figure 1 threshold for correlation coefficient, blue line for number of result points, red line for matching correct rate. The x-axis for threshold of correlation coefficient, the principal
y-axis for number of result points and the auxiliary y-y-axis for matching correct rate
The chart showed that with the increase of threshold, the matching correct was on a stable rise. With correlation coefficient ranging from 0.8 to 0.9, there is a sharp increase in matching correct rate from 50% to 100%. The number of matched points showed an opposite trend which dwindled with the increase value of coefficient. The two line intersect in the point around 0.85. In image matching, we wish the number of matched point as large as possible meanwhile the correct rate as high as possible. However, in this paper, we want the matching correct rate surpass 80%, so the threshold is set as 0.88. In the SIFT features descriptor, each key point was assigned a principal orientation. We found that the subtraction of principal orientations belonging to two corresponding points remain relatively same, which equals to the rotation angle of the two images. Thus in image matching, it is unnecessary to search for all candidates in the reference image but only for the candidates which have the same subtraction result equalling rotation angle. In this way, the speed of matching accelerated because of the shorten of search time.
The first stage of the principal orientation constrain was to determine the rotation angle in the two images. There are several ways to know the rotation angle. If the elements of exterior orientation were captured by POS(Positioning and Orientation System), then the rotation angle O0 could by proposed an pre-matching method to solve the problem. At first, 1/5 key points were selected the in the basis image as features for the consideration of efficiency. Then search all the features in reference image for corresponding points. The threshold for correlation coefficient was set as 0.9 to guarantee the reliable result of matching. Finally the rotation angle
0 ( 1, 2,..., n)
O mean O O O (11) 1, 2
O O for subtraction of principal orientation according to corresponding point, nfor number of corresponding points. The principal orientation constrain is judge by the equation threshold for constrain. In this paper, Tois set as 0.1.
4. EXPERIMENT
4.1 Test Data
In order to compare the improved algorithm with the original one, four groups of low-altitude remote sensing stereo-images
were chosen with four different sensors for the experiments.
Figure 2(a) stereo-image thumbnails from air-ship with big difference in pitch angle and small difference in roll angle and rotation angle. The image size of left image is 300pixel400pixel which is the same for right image.
Figure 2(b) parts of stereo-images from camera hanged on the ballon. This stereo-image has large rotation angle which approximately equals 80 degree. The size of left image is 353 pixel 391 pixel, and the image size of right image is 401pixel321pixel.
Figure 2(c) parts of low-altitude stereo-images with affine distortion because of the change of view point. The image size of left image is 153pixel180pixel, and the image size of right image is 172pixel181pixel.
Figure 2(d) parts of stereo-images from air-ship with none-linear distortion due to the changes of rotation angle and pitch angle. The size of left image is 200pixel201pixel, and the size of right image is 200pixel254pixel.
4.2 Feature Extraction Comparison
In this experiment, four group of stereo images were processed with zero-crossing feature extraction and SIFT feature extraction. Then all the features were matched by same matching algorithm. There are four factors to evaluate the extraction function: number of feature points, feature recurrence rate, matching correct rate and time of feature extraction. The feature recurrence rate
100% min( , )
i j
i j
C C C C
(13)
i
C for set of feature points in left image, Cj for set of feature point in right image. Numerator in this equation stands for repeated points in both images. In this paper it equals to the number of correct matching points. While denominator in this equation represents the minimum number of feature points in the two images. The value of feature recurrence rate can judge the result of feature extraction.
The number of feature points
( i, j)
Nmean C C (14)
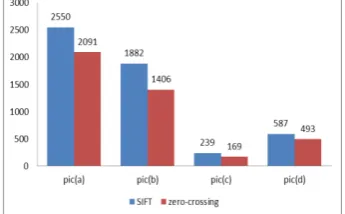
meanfor mean value of feature numbers in the two images. The statistics of the four factors are showed in the chart below. From the Figure 3(a) and Figure3 (b), overall, the zero-crossing
method had fewer number of features and higher feature recurrence rate compared to SIFT algorithm. That represents the zero-crossing has higher efficiency than SIFT because there are more extracted features recurrent in the reference image. According to Figure 3(b), the feature recurrence rate in zero-crossing is approximately three times higher than SIFT algorithm, especially in the picture (b) which nearly four times higher than former one. That reflected the zero-crossing method performed well to the problem of the large rotation angle and the repetitive texture showed in stereo images from balloon.
Figure 3(a) number of features by SIFT algorithm and zero-crossing algorithm. Blue bar for SIFT algorithm and red bar for zero-crossing algorithm. The x-axis showed different group of test images and the y-axis stands for the number of features.
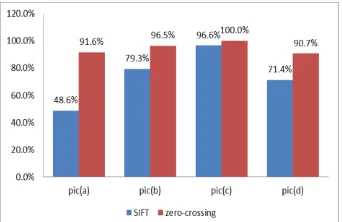
Figure 3(b) feature recurrence rate of SIFT algorithm and zero-crossing algorithm. Blue bar for SIFT algorithm and red bar for zero-crossing algorithm. The x-axis showed different group of test images and the y-axis stands for the feature recurrence rate. With same method of matching, the matching correct rate can also reflect the efficiency of feature extraction. But it is an auxiliary factor compared to feature recurrence rate. Figure 5(c)showed that the zero-crossing method has higher matching correct rate than SIFT method, especially for picture(a) from air-ship, the matching correct rate is 91.6% for zero-crossing, compared 48.8% for SIFT algorithm. It can be concluded that zero-crossing method perform better in the scale difference caused by variant of pitch angle. Moreover, The matching correct rates of zero-crossing are all exceed 90% proved that zero-crossing also did well in the situation of big rotation angle, affine distortion and non-linear distortion. Figure 5(d)showed the time of feature extraction by zero-crossing and SIFT algorithm. It is shown that the time of feature extraction by two algorithm remain relatively same which SIFT algorithm cost a little more time than zero-crossing method.
Taken the four charts together, it can be concluded that, the zero-crossing method showed higher rate of feature recurrence rate and matching correct rate with fewer number of features and extraction time. Towards four kinds of distortions scale difference, rotation difference, affine distortion and non-linear distortion, zero-crossing method performed better than the SIFT algorithm.
Figure 3(c) matching correct rate of SIFT algorithm and zero-crossing algorithm. Blue bar for SIFT algorithm and red bar for zero-crossing algorithm. The x-axis showed different group of test images and the y-axis stands for the matching correct rate.
Figure 3(d) time(second) of feature extraction by SIFT algorithm and zero-crossing algorithm. Blue bar for SIFT algorithm and red bar for zero-crossing algorithm. The x-axis showed different group of test images and the y-axis stands for the time of feature extraction.
4.3 Image Matching Comparison
In this experiment, feature extraction has taken on the four groups of images with the same SIFT algorithm, then the image matching were taken by SIFT matching method based on minimum of Euclidean distance and improved matching method based on correlation coefficient with principal constrain. There are three factors to evaluate the function of matching algorithm: number of result points, matching correct rate and speed of matching.
Figure 4(a)showed that more result points have been found by improved matching method compared to the SIFT matching method. For picture(b) from balloon and picture(d) from air-ship, the number of result features by improved algorithm are more than twice as many as the result features by SIFT algorithm, which proved that the improved algorithm perform much better in occasion of large rotation angle and none-linear distortion.
Figure 4(a)number of result points by SIFT algorithm and improved algorithm. Blue bar for SIFT algorithm and red bar for zero-crossing algorithm. The x-axis showed different group of test images and the y-axis stands for the number of result features.
Figure 4(b) showed that the improved algorithm has higher matching correct rate, approximately 97%, than the SIFT algorithm approximately 80%. The biggest difference went for picture(a) from air-ship with scale difference by pitch angle, which has a sharp increase from 72.7% by SIFT algorithm to 100% by improved algorithm. That reflected the improved algorithm performed better dealing with scale difference. The rise of matching correct rate is mainly caused by correlation coefficient as similarity measure instead of Euclidean distance. Because correlation coefficient has high tolerance in image noise and distortion, thus the matching result show better with correlation coefficient.
Figure 4(b) matching correct rate by SIFT algorithm and improved algorithm. Blue bar for SIFT algorithm and red bar for zero-crossing algorithm. The x-axis showed different group of test images and the y-axis stands for the matching correct rate. Figure 4(c)showed the improved algorithm has higher speed of matching than SIFT algorithm. The matching speed vrefers to the matching point per second
I v
t
(15)
I for the number of matching result, t for time of matching(second).
It is shown that there is an sharp increase of matching speed by improved algorithm, especially in picture(c) from low altitude images which matched nearly 370 points per second, 30 times faster than before. For picture(a), the speed of matching has increased nearly 29 times than before. The significant rise in matching speed owing to the principal orientation constrain which short the search space thus enhancing matching speed.
Figure 4(c) speed of matching by SIFT algorithm and improved algorithm. Blue bar for SIFT algorithm and red bar for zero-crossing algorithm. The x-axis showed different group of test images and the y-axis stands for the number of result features.
4.4 Overall Algorithm Comparison
In this experiment, the four groups of stereo-images were processed by two different feature extraction and matching algorithm the SIFT algorithm and the improved algorithm with zero-crossing based feature extraction and correlation coefficient based matching with principal orientation constrain. Figure 5 showed that improved algorithm has more corresponding points, which distributed around car. Moreover,
there are minor matching errors in Figure 5(a), however, the matching result corresponding points are all correct in Figure 5(b).
Figure 5 (a) matching result by SIFT algorithm, red cross for corresponding point, blue cross for one pair of corresponding point
Figure 5 (b) matching result by improved algorithm, red cross for corresponding point, blue crosses for one pair of corresponding points
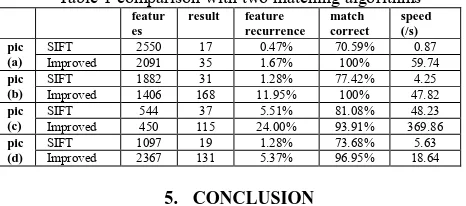
In this experiment, seven factors have been calculated to evaluate the improved algorithm with the SIFT algorithm which are number of features, number of result points, feature recurrence rate, matching correct rate, extraction time and speed of matching. Table 1 showed the comparison with SIFT algorithm and improved algorithm. From the table, the improved algorithm has more features and corresponding points as well as higher rate of feature recurrence and matching correct. For the efficiency of the algorithm, the improved algorithm took less time than before and the speed of matching has been greatly enhance by improvement. It can be concluded that several improvements has increase the effect and efficiency of the algorithm, especially in feature recurrence rate, matching correct rate and speed of matching.
Table 1 comparison with two matching algorithms
featur es
result feature recurrence
match correct
speed (/s) pic
(a)
SIFT 2550 17 0.47% 70.59% 0.87 Improved 2091 35 1.67% 100% 59.74
pic (b)
SIFT 1882 31 1.28% 77.42% 4.25 Improved 1406 168 11.95% 100% 47.82
pic (c)
SIFT 544 37 5.51% 81.08% 48.23 Improved 450 115 24.00% 93.91% 369.86
pic (d)
SIFT 1097 19 1.28% 73.68% 5.63 Improved 2367 131 5.37% 96.95% 18.64
5. CONCLUSION
In this paper three improvements were made to the original SIFT operator for image matching with low-altitude remote sensing. Firstly, zero-crossing theory was applied in feature extraction. Then, correlation coefficient replaced Euclidean distance as similarity measure. Finally, principal orientation constrains was used during the image matching.
In this paper, experiment went on with four low-altitude remote sensing stereo pairs from different sensors and with different distortions. There are three groups of experiments to compare the feature extraction, image matching and overall algorithm with the improved algorithm and the SIFT algorithm. Result showed that improved algorithm has higher feature recurrence rate, matching correct rate and speed of matching towards four different distortions which are different scale, rotation angle large, affine distortion and nonlinear distortion.
However, there are shortcomings in the improved algorithm. Firstly, sometimes the features are not uniformly distributed in the image. Thus if the image has no evident texture features, the number of feature points may decrease. Moreover, the matching result could be greatly affected by the precision of rotation angle calculation. In the future, more experiments will be done with large size of remote sensing image to test the applicability of the algorithm.
References
David G. Lowe, 1999.Object recognition from local scale-invariant features. In International Conference on Computer Vision, Corfu,Greece,pp. 1150-1157
David G. Lowe,2004. Distinctive Image Features from Scale-Invariant Keypoints. Internatioanl Journal of Computer Vision,60(2):91-110.
Mikolajczyk K and Schmid C, 2005. A performance evaluation of local descriptors. IEEE Transaction on Pattern Analysis and Machine Intelligence, 27(10) 1615-1630
Yan Ke, Rahul Sukthankar, 2004. PCA-SIFT: A More Distinctive Representation for Local Image Descriptors. Computer Vision and Pattern Recognition CVPR2004 Proceedings of the 2004 IEEE Computer Society Conference on,2:506-5131.
Bay, H., Tuytelaars, T., Gool, L.V., 2006. "SURF: Speeded Up Robust Features", Proceedings of the ninth European Conference on Computer Vision.
J.M. Morel and G.Yu, 2009. ASIFT: A New Framework for Fully Affine Invariant Image Comparison, SIAM Journal on Imaging Sciences, vol. 2, issue 2.
Sirmacek, B. Unsalan, 2009. Urban area and building detection using SIFT keypoints and graph theory, IEEE Transactions on Geoscience and Remote Sensing, vol. 47, no. 4, pp. 1156–1167.
Beis, J.; Lowe, David G.,1997. "Shape indexing using approximate nearest-neighbour search in high-dimensional spaces". Conference on Computer Vision and Pattern Recognition, Puerto Rico: sn. pp. 1000–1006.
Se, S.; Lowe, David G.; Little, J.,2001. "Vision-based mobile robot localization and mapping using scale-invariant features". Proceedings of the IEEE International Conference on Robotics and Automation (ICRA). 2. pp. 2051.
Iryna Gordon and David G. Lowe, 2006. "What and where: 3D object recognition with accurate pose," in Toward Category-Level Object Recognition, (Springer-Verlag), pp. 67-82 Lindeberg, T. 1994. Scale-space theory: A basic tool for analysing structures at different scales. Journal of Applied Statistics, 21(2):224-270.
D.Marr, E.Hildreth. Theory of Edge Detection,1980. Proceedings of the Royal Society of London.Series B, Biological Sciences, 207(1 167) 187-217.
A.Witkin. Scale Space Filtering, 1983. Proc. Int. Joint Conf. Artif. Intell., Karlsruhe, Germany.