MULTI-LEVEL BUILDING RECONSTRUCTION FOR AUTOMATIC ENHANCEMENT
OF HIGH RESOLUTION DSMS
Hossein Arefi and Peter Reinartz
Remote Sensing Technology Institute, German Aerospace Center – DLR, D-82234 Wessling, Germany E-Mail: [email protected]
Commission II, WG II/2
KEY WORDS:Digital Surface Models(DSM), Generalization, Levels of Detail (LOD), Approximation, Building, prismatic, paramet-ric DSM Enhancement
ABSTRACT:
In this article a multi-level approach is proposed for reconstruction-based improvement of high resolution Digital Surface Models (DSMs). The concept of Levels of Detail (LOD) defined by CityGML standard has been considered as basis for abstraction levels of building roof structures. Here, the LOD1 and LOD2 which are related to prismatic and parametric roof shapes are reconstructed. Besides proposing a new approach for automatic LOD1 and LOD2 generation from high resolution DSMs, the algorithm contains two generalization levels namely horizontal and vertical. Both generalization levels are applied to prismatic model of buildings. The hor-izontal generalization allows controlling the approximation level of building footprints which is similar to cartographic generalization concept of the urban maps. In vertical generalization, the prismatic model is formed using an individual building height and continuous to included all flat structures locating in different height levels. The concept of LOD1 generation is based on approximation of the building footprints into rectangular or non-rectangular polygons. For a rectangular building containing one main orientation a method based on Minimum Bounding Rectangle (MBR) in employed. In contrast, a Combined Minimum Bounding Rectangle (CMBR) ap-proach is proposed for regularization of non-rectilinear polygons, i.e. buildings without perpendicular edge directions. Both MBR-and CMBR-based approaches are iteratively employed on building segments to reduce the original building footprints to a minimum number of nodes with maximum similarity to original shapes. A model driven approach based on the analysis of the 3D points of DSMs in a 2D projection plane is proposed for LOD2 generation. Accordingly, a building block is divided into smaller parts according to the direction and number of existing ridge lines. The 3D model is derived for each building part and finally, a complete parametric model is formed by merging all the 3D models of the individual parts and adjusting the nodes after the merging step. In order to pro-vide an enhanced DSM, a surface model is propro-vided for each building by interpolation of the internal points of the generated models. All interpolated models are situated on a Digital Terrain Model (DTM) of corresponding area to shape the enhanced DSM. Proposed DSM enhancement approach has been tested on a dataset from Munich central area. The original DSM is created using robust stereo matching of Worldview-2 stereo images. A quantitative assessment of the new DSM by comparing the heights of the ridges and eaves shows a standard deviation of better than 50cm.
1 INTRODUCTION
Automatic building reconstruction from Digital Surface Models (DSMs) with or without using other data sources is still an ac-tive research area in Photogrammetry and GIS institutions. In this context, providing a 3D CAD model which represents the overall shape of the building and containing the most significant parts has boosted many applications in the GIS area such as ur-ban planning. In the past few years, several algorithms have been proposed for automated 3D building reconstruction. The algo-rithms comprises methods that only employ elevation data such as high resolution airborne LIDAR for model generation while some methods use other additional sources of data. An additional data source plus DSM is usually employed when the quality or resolution of the elevation data is not appropriate for model gen-eration. Segmentation based approaches for a 3D building model generation from grid data are proposed by Geibel and Stilla (2000) and Rottensteiner and Jansa (2002) to find planar regions which determine a polyhedral model. Gorte (2002) employed another segmentation approach using TIN structures for the data and the segments are generated by iteratively merging the triangles based on similarity measurements. Rottensteiner (2006) described a model for consistent estimation of building parameters, which is part of the 3D building reconstruction. Geometric regularities were included as soft constraints in the adjustment of the model. Robust estimation can then be used to eliminate false hypotheses about geometric regularities. A comparison between data- and
LOD1 and LOD2 generation has been already reported (Arefi, 2009) by the author. In contrast to LIDAR data, the DSMs gener-ated by stereo matching of satellite imagery have a lower quality, particularly on the building ridge lines and boundaries. There-fore, a method which solely employs stereo-matched DSMs for 3D building reconstruction often produces lower geometric ac-curacy especially on the building walls. Accordingly, the other data sources such as ortho rectified high resolution satellite im-age such as Worldview–2 imim-age can be used to enhance the model accuracy (Arefi et. al., 2011).
2 METHODS
In this paper, the term of “Generalization” is defined based on in-cluding or exin-cluding different building parts in horizontal (2D) or height (3D) levels to the primary 3D model. Accordingly, the building model is improved hierarchically which can be em-ployed in different GIS applications. 2D and 3D generalization steps are explained separately in following sub-sections.
2.1 2D Generalization
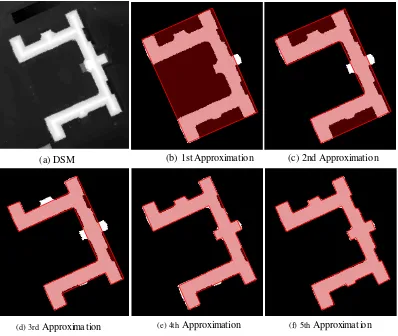
In this section we propose a method for generalization or approxi-mation of the building outlines in different LODs. Figure 1 repre-sents the idea behind the proposed method for 2D generalization levels. Here, the objective is to provide second level of detail (LOD1) according to standard definition of CityGML (Kolbe et al., 2005) by hierarchically adding different 2D details to the pri-mary model. For this purpose, 2D approximation is started by fitting a simple polygon, e.g., rectangle (cf. Figure 1(b)). The further details can be included to the 1st approximation model by changing some parameters in program which corresponds to a desired level-of-detail. Arefi (2009) proposed an approach for
(a) DSM (b) 1st Approximation (c) 2nd Approximation
(d) 3rd Approximation (e) 4th Approximation (f) 5th Approximation
Figure 1: 2D generalization; different approximation levels
approximation and regularization of building outlines. Two algo-rithms are proposed for approximation based on the main orien-tation of the buildings Arefi et al. (2007). The algorithms are se-lected according to the number of main orientations of the build-ings and implemented as follows:
• If the building is formed by a rectilinear polygon, i.e., sides
are perpendicular to each others from the top view, a method based on Minimum Bounding Rectangle (MBR) is applied for approximation. This method is a top-down, and model-based approach that hierarchically optimizes the initial rec-tilinear model by fitting MBR to all details of the data set. Principles of MBR based polygon approximation is presented
(e) New regions produced by subtraction of (c) and (d)
(f) Superimposed final rectilinear polygons (red) on DEM
Figure 2: MBR based polygon approximation
in Figure 2. Accordingly, after determination of the main orientation, the building polygon is rotated to the main ori-entation, as shown in Figure 2(a). In the next step the MBR image (cf. Figure 2(b)) is subtracted from the rotated build-ing region. After subtraction, new regions will be produced (cf. Figure 2(c)). For any of those regions a MBR will be calculated (Figure 2(d)). They are again subtracted from their corresponding regions produced in the previous step (cf. Figure 2(e)). As illustrated in Figure 2(e) some small regions are created. The process is followed by comput-ing new MBR regions and subtracts them from their cor-responding regions. This hierarchical procedure is contin-ued until ”no regions” are produced any more. That means the progress stops when either no new regions created any more or the size of produced regions is less than predefined threshold. After convergence the final polygon is rotated back to original orientation ( cf. Figure 2(f)). In this figure the red lines highlight the rectangular polygons.
• If the building is not rectilinear, i.e., at least one side is not
perpendicular to the other sides, a method based on RAn-dom Sample Consensus – RANSAC (Fischler and Bolles, 1981) is applied for approximation.
RANSAC was originally devised to robustly fit one single model to noisy data. It turns out, however, that it can also successfully be used to fit a beforehand unknown number of models to the data: In the case of the ground plan bound-aries the number of line segments is initially unknown. We simply apply the method repeatedly – always deleting the already fitted given points from the input data – until either: a) we consider the lines found so far sufficient to construct the ground plan completely or
b) the number of points fitting to the best line segment with respect to the current iteration step falls below a chosen
thresholdt.
the same building represented in Figure 2.
Figure 3: Approximation of polygon obtained using RANSAC
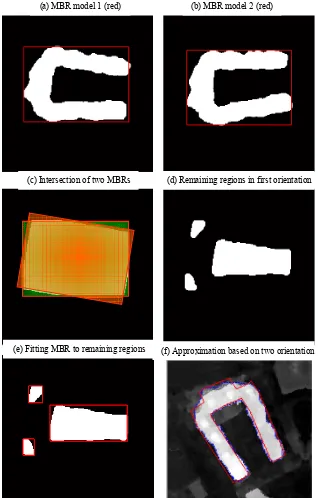
As an alternative to the RANSAC based approximation algo-rithm, a method similar to MBR-based is proposed for the build-ings containing several orientation directions. The method called Combined Minimum Bounding Rectangle (CMBR) based algo-rithm for hierarchical approximation of non-rectangular polygons. In this method, based on each orientation a MBR (rectangle) polygon is estimated as first approximation level, as shown in Figure 4(a and b). Intersection of the rectangles
correspond-(a) MBR model 1 (red) (b) MBR model 2 (red)
(c) Intersection of two MBRs (d) Remaining regions in first orientation
(e) Fitting MBR to remaining regions (f) Approximation based on two orientations
Figure 4: CMBR based polygon approximation
ing to each orientation produces the first approximation of non-rectangular building (cf. Figure 4(e), yellow region). The first approximation area is subtracted from original binary region to generate the remaining regions which should be approximated. The process is continued, similar to the MBR-based method but using all orientation directions, until no more regions remain or remaining regions contain small number of pixels. Figure 4(f) il-lustrates the final approximation result of the sample building by using two main orientations. The approximation result could be
improved by taking into account more significant orientations. All the approximation methods are containing the parameters as “stopping criteria” which could be tuned to provide desired level-of-detail for 2D approximation. The MBR- and CMBR-based methods are both iterative algorithms and in each iteration the remaining regions are checked if they have sufficient number of pixels for approximation or they can be neglected. Figure 2(b) provides first approximation level of the building which is an op-timal rectangle. After generating remaining details (cf. Figure 2(c) or Figure 2(e)) the size of the regions are compared to the predefined minimum size of accepted detail for further process-ing. The same procedure is included in CMBR-based method for further processing from Figure 4(c) to Figure 4(e). Likewise in RNASAC algorithm several parameters and thresholds are in-cluded which assists to determine specific straight lines contain-ing different consensus ( number of inliers) or line size.
Accordingly, different approximation or 2D generalization levels as defined in this section and illustrated in Figure 1 can be created. Each approximation level can be employed for generating LOD1 (prismatic model) by shaping corresponding wall and roof poly-gons. The height of the building in each level is determined by computing average height values inside the polygon which could be further employed for 3D prismatic model generation as pro-posed in (Arefi, 2009).
The proposed algorithms for approximation of the building out-lines and finally, generating 3D prismatic models have been im-plemented in a city area containing flat roof buildings in Tunis (cf. Figure 5). For this experiment, two approaches of MBR- and CMBR-based, have been utilized to approximate buildings con-taining rectangular and non-rectangular outlines. Figure 5 shows
Figure 5: Building outline approximation (green polygons)
the approximation results of the extracted building outlines. As stated before, for a final 3D reconstruction, an average height is estimated for each building to shape prismatic model. For each building, the prismatic model is shaped using average height and polygon nodes which are extracted by approximation approaches. The polygons are merged to form prismatic models as illustrated in Figure 6. Additional 3D representation is provided by super-imposing the ortho rectified image of corresponding area to the 3D prismatic models models (cf. Figure 7).
2.2 3D Generalization
pri-Figure 6: 3D prismatic models
Figure 7: Superimposing of ortho rectified image on 3D prismatic models – zoomed to a smaller region
mary model. Here, both prismatic (LOD1) and parametric (LOD2) models are considered with evaluation of height pixels for 3D generalization purpose. Accordingly, the generalization comprises following steps which corresponds to LOD1 and LOD2 sepa-rately:
2.2.1 3D generalization of flat roof buildings In this section the aim is to enhance the prismatic model by including 3D models corresponding to the building parts located in different height lev-els. As defined, in prismatic model generated for LOD1 a single height value is representative for the elevation of a building. This value is evidently not a proper value for many buildings is reality. Most of the buildings particularly in urban regions contain many parts in different height levels. In this section an approach is pro-posed for hierarchically enhancing prismatic models by including 3D models of building part in different elevation level. For this purpose all individual building parts located in different height levels should be first extracted. An approach for automatic ex-traction of building segments hierarchically by Arefi (2009). The approach is additionally able to extract building parts in different elevation levels (cf. Figure 8). The geodesic based segmentation of the high resolution DSM employs a height offset parameter which assist to extract the 3D segment in specific height level (for detail see (Arefi, 2009)). Figures 8(a) to 8(d) illustrate the segmentation results corresponding to the building parts located in similar height levels. The overall segmentation boundary of the building block (cf. Figure 8(e)) and corresponding detail regions (cf. Figure 8(f)) are visualized in this figure as well. As explained in Section 2.1 corresponding boundary regions of each segmen-tation level can be approximated and included into the primary prismatic model for a optimized LOD1 generation (cf. Figure 9).
2.2.2 3D reconstruction of buildings with tilted roofs In this section the LOD2 containing 3D models of parametric roof
struc-(a) Segmentation Level 1 (b) Segmentation Level 3
(c) Segmentation Level 6 (d) Segmentation Level 8
(e) Block segments (f) Detail height segments
Figure 8: Hierarchical segmentation of different height levels of building
(a) Detail height segments (b) Approximation on block segment
(c) Approximation on detail height segments (d) Final approximation on detail height segments
Figure 9: Enhanced prismatic model by including different height levels of building into LOD1
tures defined as additional level of generalization in 3D. Accord-ingly the building structures containing tilted roofs are modeled automatically and included as an enhanced height level of gener-alization into 3D model. The automatic 3D building reconstruc-tion algorithm proposed in this secreconstruc-tion comprises the following three major steps:
1. Ridge-based decomposition of building parts
2. Projection-based reconstruction of parametric roofs
3. Merge parametric models
corresponding pixels of each building part onto a 2D plane that is defined based on the orientation of the ridge line. Based on roof type, a predefined 2D model is fitted to the data and in the next step, the 2D model in extended to 3D by analyzing the third dimension of the points. A final model regarding the parametric roof structures of the building block is defined by merging all the individual models and employing some post processing refine-ments regarding the coinciding nodes and corners to shape the appropriate model (more details can be found in Arefi(2009 and 2011)). Figure 10 shows the 3D prismatic and parametric
mod-(a) DSM
150 200 200
250 300
(b) Approximation
(c) Prismatic model (d) Prismatic model + DSM
(f) Parametric model + DSM (e) Parametric model
Figure 10: LOD1 and LOD2 as defined in CityGML
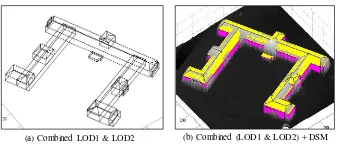
els extracted from a building block. As shown, the structures of the building shaped by tilted roofs are modeled separately and merged together for final LOD2 generation (cf. Figure 10(e) and 10(f) ) Figure 11 is generated by analyzing the prismatic and
para-(a) Combined LOD1 & LOD2 (b) Combined (LOD1 & LOD2) + DSM
Figure 11: Merging LOD1 and LOD2
metric models of the building block. In order to include the flat structures into the merged parametric model, the ground plan of the merged model is compared with final approximation result of building outline. The overall area of the approximated poly-gon is subtracted from the corresponding area of the parametric models. The positive pixels belong to protrusions and the nega-tive pixels are related to indentations. Corresponding areas to the protrusions and indentations are again approximated. The aver-age of the heights of the internal points of protrusion area is used as height of the building part. Although, this does not mean that the protrusion parts have always flat roofs, but since their cor-responding roof types cannot be distinguished by the proposed algorithm, a prismatic model is fitted to the points.
2.3 DSM Enhancement
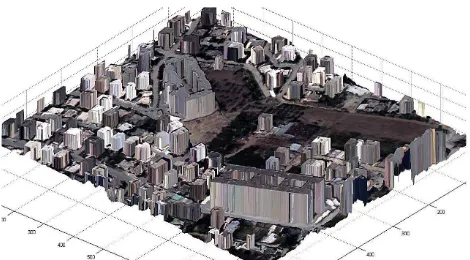
In order to provide an enhanced digital surface model based on 3D models generated in this above mentioned sections, corre-sponding 3D building models should be replaced to the building pixels in DSM. Therefore, the corresponding pixels of the build-ing segments are first eliminated from the original DSM and pro-duced gaps are filled by appropriate interpolation method. For a vector to raster conversion of the 3D polygons, the internal points of each 3D polygon should be interpolated using the corner 3D information. Figure 12 illustrates the DSM generated from stereo
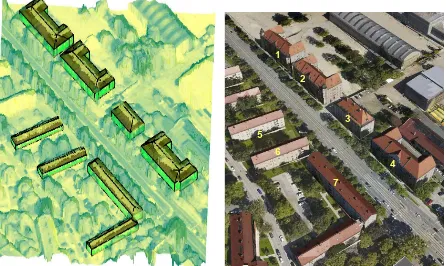
Figure 12: 3D Model of sample buildings in Munich city, Ger-many
Worldview–2 imagery. It contains several buildings with tilted roof in central Munich in Germany. As shown, the buildings models are generated by ridge-based method proposed in this pa-per. Accordingly, corresponding enhanced DSM is generated and visualized in Figure 13 A quantitative evaluation is performed to
Figure 13: Merging LOD1 and LOD2
Building Wall (GT) Wall (Model) Ridge (GT) Ridge (Model)
1 15.00m 14.88m 20.40m 20.06m
2 15.00m 14.48m 20.40m 20.00m
3 14.28m 13.65m 22.78m 23.57m
4 15.00m 14.33m 20.40m 19.83m
5 11.15m 11.30m 14.25m 14.50m
6 11.15m 10.20m 14.25m 14.20m
Mean mean(h1)=0.45m mean(h2)=0.05m
Std. Dev. sigma(h1=0.40m) sigma(h2)=0.50m
Table 1: Ground Truth (GT) vs. estimated values from 3D model
the differences between GT and model values are computed and added extra rows in Table 1. It shows that the quality of 3D model on the ridge points are much higher where the mean of the height differences is about 5cm. The average between the height dif-ferences on the walls is about 45cm. Due to a lower quality and smoothed behavior of the building walls in DSMs, a lower quality of the location of the eave lines comparing to the ridge lines were expected. However a standard deviation of about 40-50cm for eave and ridge lines extraction from Worldview–2 DSMs, proves that the methodology leads to very good results.
(a) 3D representation of parametric models superimposed on DSM tex-turized by orthoimage
(b) Google earth – Corresponding to the test area
Figure 14: final representation of the 3D models (a) comparing to the Google Earth image (b)
3 SUMMARY AND CONCLUSIONS
An algorithm for 3D reconstruction of buildings in different 2D and 3D generalization levels is proposed. High resolution DSMs such LIDAR and DSMs generated from high resolution satellite imagery could be employed as input data. The generalization steps are divided into two major algorithms namely 2D and 3D. In 2D generalization, the 2D details of the building segments are an-alyzed to be included into approximated polygon. The details are neglected if they are smaller than the predefined threshold which corresponds to the minimum size of the remained sub-region. In 3D generalization, the method focuses on both LOD1 and LOD2. In LOD1, the building parts located in different elevation levels are hierarchically extracted and modeled. Each individual model receive a corresponding height value to shape prismatic models of the internal parts. Finally they are merged into the primary pris-matic model to form an enhanced prispris-matic model. In this paper, generating LOD2 is defined as extra level of generalization but in 3D, as also defined in CityGML. 3D parametric models are ex-tracted using a ridge-based decomposition approach. According to each ridge information the building block is decomposed into several parts depending on the number of ridge lines. Based on
each ridge line, a projection based algorithm is defined to sim-plify and speed up the 3D modeling procedure. Additionally an enhanced DSM is generated according to extracted 3D models in each generalization level. The internal points of the 3D polygons are filled using proper interpolation method and replaced in the building pixels in original DSM to shape enhanced DSM.
References
Arefi, H., 2009. From LIDAR Point Clouds to 3D Building Mod-els. PhD thesis, Bundeswehr University Munich.
Arefi, H., Engels, J., Hahn, M. and Mayer, H., 2007. Approxi-mation of building boundaries. In: Urban Data Management Systems (UDMS) Workshop, Stuttgart, pp. 25 – 33.
Arefi, H., Engels, J., Hahn, M. and Mayer, H., 2008. Levels of Detail in 3D Building Reconstruction from LIDAR Data. In: International Archives of the Photogrammetry, Remote Sens-ing and Spatial Information Sciences, Vol. 37 (B3b), pp. 485 – 490.
Fischler, M. A. and Bolles, R. C., 1981. Random sample consen-sus: A paradigm for model fitting with applications to image analysis and automated cartography. Communications of the ACM 24(6), pp. 381–395.
Geibel, R. and Stilla, U., 2000. Segmentation of laser-altimeter data for building reconstruction: Comparison of different pro-cedures. In: International Archives of Photogrammetry and Remote Sensing and Spatial Information Sciences, Vol. 33 (B3), pp. 326 – 334.
Gorte, B., 2002. Segmentation of TIN-structured surface mod-els. In: International Archives of Photogrammetry and Remote Sensing and Spatial Information Sciences, Vol. 34 (4).
Kada, M. and McKinley, L., 2009. 3D Building Reconstruction from Lidar Based on a Cell Decomposition Approach. pp. 47– 52.
Kolbe, T. H., Gr¨oger, G. and Pl¨umer, L., 2005. CityGML - Inter-operable Access to 3D City Models. In: International Sympo-sium on Geo-information for Disaster Management, Springer Verlag.
Rottensteiner, F., 2006. Consistent estimation of building pa-rameters considering geometric regularities by soft constraints. In: International Archives of Photogrammetry, Remote Sens-ing and Spatial Information Sciences, Vol. 36 (3), pp. 13 – 18.
Rottensteiner, F. and Jansa, J., 2002. Automatic extraction of buildings from LIDAR data and aerial images. In: Interna-tional Archives of Photogrammetry, Remote Sensing and Spa-tial Information Sciences, Vol. 34number 4, pp. 569–574.