INTEGRATED SURVEY FOR ARCHITECTURAL RESTORATION: A
METHODOLOGICAL COMPARISON OF TWO CASE STUDIES
G. Bianchi a, N. Bruno a, E. Dall’Asta a, G. Forlani a, C. Re b, R. Roncella a *, M. Santise a, C. Vernizzi a, A. Zerbi a
a Università degli Studi di Parma, Dipartimento di Ingegneria Civile, dell’Ambiente, del Territorio e Architettura, Parco Area delle
Scienze 181A, 43124, Parma, Italy - [email protected], (gianfranco.forlani, chiara.vernizzi, andrea.zerbi)@unipr.it, [email protected], (nazarena.bruno, elisa.dallasta, marina.santise)@studenti.unipr.it
b INAF –Astronomical Observatory of Padova, Vicolo dell’Osservatorio 5, 35122, Padova, Italy [email protected]
Commission V, WG V/2
KEY WORDS: Cultural Heritage, Comparison, Photogrammetry, Laser scanning, Restitution, Integration
ABSTRACT:
A preliminary survey campaign is essential in projects of restoration, urban renewal, rebuilding or promotion of architectural heritage. Today several survey techniques allow full 3D object restitution and modelling that provides a richer description than simple 2D representations. However, the amount of data to collect increases dramatically and a trade-off between efficiency and productivity from one side and assuring accuracy and completeness of the results on the other must be found. Depending on the extent and the complexity of the task, a single technique or a combination of several ones might be employed. Especially when documentation at different scales and with different levels of detail are foreseen, the latter will likely be necessary. The paper describes two architectural surveys in Italy: the old village of Navelli (AQ), affected by the earthquake in 2009, and the two most relevant remains in Codiponte (MS), damaged by the earthquake in 2013, both in the context of a project of restoration and conservation. In both sites, a 3D survey was necessary to represent effectively the objects. An integrated survey campaign was performed in both cases, which consists of a GPS network as support for georeferencing, an aerial survey and a field survey made by laser scanner and close range photogrammetry. The two case studies, thanks to their peculiarities, can be taken as exemplar to wonder if the integration of different surveying techniques is today still mandatory or, considering the technical advances of each technology, it is in fact just optional.
* Corresponding author.
1. INTRODUCTION
The survey of cultural heritage sites is a truly interdisciplinary activity, where surveyors, historians, architects, town planners, structural engineers, etc. are involved. The goal might be just the documentation – consider for example the establishment and population of 3D digital libraries in order to ensure that heritage sites are (digitally) available to future generations (http://www.cyark.org, Balletti et al., 2015) – rather than preservation, restoration (Günay, 2011; Oreni et al., 2014), promotion (Barazzetti et al., 2015), rebuilding, maintenance and monitoring (Brumana et al., 2013a), etc.
In this context, 3D survey and 3D restitution are particularly significant since they give a higher number of information than the 2D representation and make it possible to have a global view of the object under investigation in one illustration, being able to manage all components simultaneously. 3D survey techniques allow acquiring, rapidly and with a fair automation level, a great deal of real world data at high resolution. Thus, the 3D models obtained by restitution increasingly correspond to reality, being however the user able at any time to reduce the complexity of the information returned, according to the scale of representation or the aim of the survey.
Moreover, 3D survey is particularly fitting to represent and investigate urban areas when drawing urban or architectural projects (Visintini et al, 2007), in order to convey the spatial perception of the object within the landscape and to perform simulations for visual impact analysis.
In recent years, the need to store, organize, retrieve information and use it for further analysis led to the development of GIS and lately of Building Information Models (BIMs, Eastman et al, 2011; Murphy et al, 2011) for the management, respectively, of territory and architectural heritage (Achille et al. 2012). So the creation of 3D models (suitable for the implementation in such systems) is becoming a requisite.
Attention is also paid to the time domain, with specialised modelling software that accounts for the historical developments of the site. Also the fruition of such products, thanks to webGIS and web-based interfaces to a dataset, is open to a larger public (Agugiaro et al, 2011). In these cases, the possibility of visualizing a 3D model is more suitable to the need and the expectations of the public, since its comprehension is immediate and closer to reality.
Many authors (Remondino, 2011; Grussenmeyer et al., 2012; Brumana et al., 2013; Fassi et al., 2013; Balletti et al., 2015; Kersten et al., 2015; Rodríguez-Gonzálvez et al., 2015) in recent years dealt with these topics but the discussion is not concluded and many questions are still open. All these researches underline that to reach the best result in terms of accuracy and completeness of the models it is important to perform an integrated survey, which takes into account topographic measurement, laser scanning and close range photogrammetry techniques combined together. Integration allows overcoming the specific limitations of each technique, having more complete results.
However, nowadays, laser scanners and photogrammetric software are more and more performing and have improved
their capabilities, overcoming many of their respective traditional drawbacks and points of weakness. For instance, laser scanners integrated cameras became more and more sophisticated allowing acquiring high resolution/high quality images of the object and providing colours for the point cloud. Photogrammetric software, on the other hand, in the last few years improved constantly the automation of all the orientation and dense matching procedures, which made the technique viable also for non-expert users, and specialized the matching algorithms toward multi-image block geometry, which in many cases reduces consistently all the drawbacks connected to point stereo-visibility (i.e. occlusions).
In other words, are integrated surveys still necessary today? When a single technique should be employed and when, on the other hand, should many be used concurrently to provide an adequate result? From a practitioner point of view, the choice to integrate several surveying techniques always comes at a price: the most obvious resides in the need of acquiring/renting different (often costly) equipment, but users should also take into consideration the costs of the technical training, of the logistics and so on. If skills and equipment can be easily found in surveying companies, often, in the context of small/medium architectural restoration projects, the surveying activities are assigned to a more general-purpose professional.
To put the previous questions in a context, in the following two case studies of architectural surveys in Italy are presented. The first concerns the old village of Navelli (AQ), affected by an earthquake in 2009. The second one is devoted to the documentation of the two most relevant remains in Codiponte (MS): the castle and the bridge. Both surveys were executed in the context of a project of restoration and conservation. Like many medieval or even older Italian villages, also Navelli and Codiponte have been built on hills or mountain slopes. Today, although partly inhabited and with increasing deterioration of buildings and walls, thanks to their narrow stone paved streets, the staircases, the arcs, they offer a unique atmosphere and represent an exceptional and challenging environment for a modern 3D survey.
Building on the remarks on the survey results, the second part of the article deals with the methodological issues concerning the integration of different techniques. The aim is to understand if today the different indirect survey techniques, i.e. laser scanner and photogrammetry, are still to be considered complementary or alternative and so, if their integration, as the case, is mandatory or optional.
2. NAVELLI CASE STUDY
The town of Navelli (AQ) rises about 700 meters above sea level, on the south-west side of Mount San Nicola.
On 6th April 2009 a strong earthquake measuring 5.9 on the Richter Scale shook L'Aquila and most of his province, causing severe damage throughout the territory. As a result of this tragic event, the Italian central government implemented a series of policies for reconstruction activities, transferring to the municipalities of L’Aquila province both the tasks of arranging the planning instruments for the area and of defining strategic guidelines to ensure socio-economic recovery, settlements retraining and harmonious reconstruction of the urban centres. In 2011 the Municipality of Navelli charged the Department of Civil and Environmental Engineering and Architecture (DICATeA) – University of Parma, with providing an urban planning project for the reconstruction and valorization of the old town centres of Navelli and of its fraction Civitaretenga. Navelli’s old town center, founded during the Middle Ages, still shows clearly the different eras of the urban settlement. The
area of the original settlements, characterized by narrow building blocks bordered by roads that run parallel to the contour lines, shows many buildings now reduced to ruins or in very bad preservation status. The urban structure is typically medieval, i.e. characterized by narrow streets and buildings built according to the typical shape of the “lotto gotico”, that here is varied due to the slope of the terrain.
Instead, the part of the old town center, located outside the medieval walls, is less affected by the terrain grade, and the
“lotti gotici” are replaced by more regular plan of the buildings,
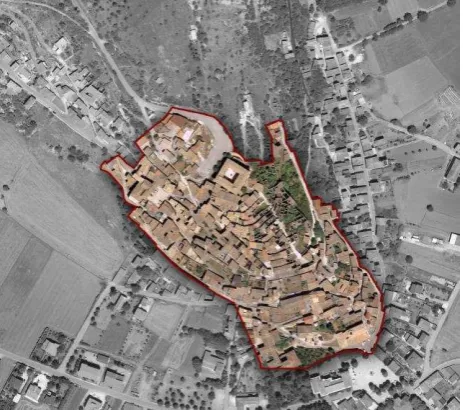
some of which are true renaissance palaces. In this area the blocks are more compact, though morphologically very articulate and quite varied in size. The need to adapt blocks and buildings to the shape and slope of the land resulted in clear differences between the east and the west areas of the town. These few considerations highlight the complexity of the historical context and built environment that urban planners faced. The main survey operations have been restricted to the old historical center (see Figure 1), built on the hill, since the modern town expansion took place at the hill foot and, not having been damaged, is not part of the restoration plan. Considering its unique features (small streets, staircases, arches etc.), even if the overall area to survey was quite limited, from the very early stages of the survey design the need of adapting several techniques to the specific requirements was already evident.
The survey activities were, first of all, devoted to the digital mapping of the historical settlement, in order to provide the urban planners with a topographic DataBase to support the design of reconstruction intervention in a GIS environment. Besides the building footprint, the identification of all the technological network elements (sewer and power grid) and the street network (in many cases made by staircases) were considered essential.
In old historical city centres, conservation constraints prevent new constructions and only allow maintenance or reconstruction of buildings: however, in order to increase the appeal of living in the old city centre, renovation and improvements of standards of houses has been foreseen in the plan. To promote joint effort from owners of adjacent buildings, the blocks were divided in smaller sections. Car traffic is not really a problem in the city centre: many streets are too narrow to let them in. To the contrary, carrying heavy goods can be a problem due to fact that most uphill street are realized by stairs
Figure 1. Orthophoto with the survey area highlighted.
or contain at least same section with steps. For the above reasons and to facilitate the process of communication and discussion of the plan with the population, the possibility to display the proposed changes in a easy-to-understand 3D visualization was considered worth the effort of producing a 3D city model. Therefore, a dedicated aerial photogrammetric survey has been foreseen.
Moreover, given the historical and artistic relevance of some buildings and of some architectural elements, a detailed documentation of this selected heritage was foreseen as the basis for future promotion of the ancient village which, in the last decades, suffered a progressive depopulation. Particular attention has been devoted to building entrance doors and to some squares and corners with peculiar juxtaposition of architectural elements.
2.1 Survey campaigns
Overall, the area of interest is roughly enclosed in a rectangle of 400 m by 200 m, with a height difference of 80 m from top (the Castle) to the church square at the bottom. Two scales of intervention were considered: the city scale for the entire village and the architectural scale for some prominent buildings. The necessary connection between the two surveys, carried out by different personnel, has been ensured by providing common reference points.
The survey has been thus carried out with a straightforward hierarchical schema: a GPS network providing the Ground Control Points (GCP) for the photogrammetric aerial survey and the reference coordinates to adjust the network of traverses along the village streets. The survey was produced in UTM-WGS84 (ETRS89) coordinates with orthometric heights; the adjustment of the photogrammetric block has been performed in a local Cartesian reference system. most cases the points lie at the border of the surveyed area and at the southern side because inside the village the streets are too narrow and the few squares are too small to ensure an acceptable PDOP. Overall the average accuracy of the GPS points is about 2 cm in (E, N) coordinates and about 3 cm in elevation. Whenever feasible, pairs of inter-visible GPS points have been set, to allow independent orientation of traverses. Moreover, additional points were measured on a larger area to be used as GCP for the photogrammetric flight.
A photogrammetric survey was performed mainly to provide the information layer of the rooftops and to complete the mapping of the village areas (especially near the north-eastern border, but also in some block) that were inaccessible from the ground for safety reasons. The images were taken from a Robinson helicopter by an operator with a Nikon D3x high resolution camera with a calibrated 35 mm lens, flying around midday to minimize the shadows. The execution of the flight plan was to some extent perturbed by strong winds; however, most of the planned parallel strips were flown correctly, ensuring high longitudinal and side overlap. Since the images were taken by the operator leaning out of the cabin window, they are inclined with respect to the nadir by about 30°- 40°. This prevents in many images the stereo coverage of the streets at ground level, but allows studying the residential area morphology as well as the building facades, that are usually occluded by the roofs in nadir images. Overall fourteen strips were performed to cover
the built up area and the neighbouring upstream lands, but only four were actually used to perform the block orientation and the photogrammetric restitution. The first three strips have North-East to South-West direction and a distance between flight lines of about 100 m; the fourth has been taken in the opposite direction at a larger distance (160 m) from the third flight line. For the restitution of some details, additional pictures were taken by other strips with flight direction perpendicular to the previous and added to the block.
The flight line elevations range from 850 m to 915 m, while the complementary images are taken at higher altitudes up to 1050 m.Because of high depth changes on the ground, together with the use of non nadir images, the image scale varies from about 1:5.000 to about 1:10.000. The average image scale is 1:6.400, corresponding to an average distance of about 230 m, with the 36.3 mm lens; the Ground Sampling Density (GSD) ranges from 3 cm to 6 cm.
About 1500 tie points for the bundle adjustment were automatically extracted with the in-house software EyeDEA that implements Structure From Motion algorithms, while 14 signalized ground control points were measured manually. Due to the high overlap between the images, the average multiplicity for the tie points is equal to 5 and to 12 for the ground control points. The bundle block adjustment has been performed with the commercial software Photomodeler. The RMS of the residual of the collinearity equations is about 0.6 pixels, corresponding to about 2.5 cm on the ground. The residuals on the GCP, which also depend on the coherence between the block structure and the control network, are on average 1.5 pixels, corresponding to about 5 cm on the ground. The estimated average accuracy of the tie points coordinates is 4 cm on X, 7 cm on Y and 7 cm on Z, with the worst value equal to 26 cm in the three coordinates.
The photogrammetric restitution was carried out again using Photomodeler, exporting points, lines, polylines and surfaces in dxf format. The following objects classes were considered: road edges, main walls, roofs slopes, abandoned buildings and ruins and, finally, unsafe areas.
The building footprints were obtained with a field survey by measuring a network of 3D closed traverses, executed with the classical scheme of the three tripods with forced centering. In a few cases open traverses bound to the extremes by GPS points have been used; mostly the traverses enclose a block or move along the main streets, linking the stations of the traverse outgoing from the side street. Whenever possible, the traverses include and are oriented on GPS points. All the metric and dimensional data necessary for the construction of the three-dimensional model of the town and for the realization of the two-dimensional plans have been collected. The traverses have been adjusted together with the GPS points, introduced in the network adjustment as pseudo-observations with precision provided by the GPS measurements. The average accuracy of two different levels: at the junction between the perimeter walls and the ground, and at the intersection of the same perimeter walls with the roof. The field survey has also allowed the measurement of points located on the eaves of buildings and to provide a precise spot height map of the entire area.In addition, data on technological networks were collected, through the survey and classification of manholes covers, light points and storm drains. Finally, the anchor points necessary to connect the
tape measurements of all the architectural elements surveyed directly were determined. A total of 150 stations were used for the survey, with more than 4000 points measured overall. By joining the photogrammetric restitution to the topographic restitution from the fieldwork with total station, the base map skeleton in vector format (dwg) has been obtained. By extrusion and 3D modelling, the three-dimensional model of the entire town (see Figure 2) has been produced. Besides 3D visualization, two-dimensional plans and cross sections along were drawn.
The cadastral map has also been added as a layer to the map, in order to account also for property ownership in the urban planning and to highlight possible the discrepancies with respect to the new map.
2.1.2 Architectural and detail survey: The elements that characterize the urban center at the architectural scale (such as stairs, walls, curbs, ramps and stairs to access to the buildings) were accurately measured by direct survey, performed with the typical, simple instruments such as laser distance meters, measuring tapes, etc., since a survey with total station would have been too time consuming.
These elements have been later added to the general urban drawing to complete the map. In this way all the connecting
elements between public and private space were also documented.
Concurrently with the field measurements, for each housing unit, a report containing all the information needed to characterize the building (localization, consistency, building type, building function, construction type, decorative apparatus, etc.) has been compiled. All geometric and thematic data acquired during the survey campaigns were inserted in a GIS environment to assist the urban planners in the project elaboration and to produce thematic maps of the actual and planned status of the historical city centre.
In addition, in order to be able to reconstruct at high resolution the most interesting part of the village, a Terrestrial Laser Scanner (TLS) and a close-range photogrammetric survey was performed on the staircase of Via dei Macelli. Though its current state is not the original one, this stairway has great relevance for its size and architectural quality. It runs uphill for over 100 m, climbing about 30 m of height difference. It is an element with high urban relevance since it passes through a sequence of places belonging to the various phases of construction of the village and creates a beautiful perspective view.
The TLS survey was performed with a Leica C10 time-of-flight Scan-station. The staircase is made of sections of different slope Figure 2. Cartographic restitution and general view of the 3D city model.
Figure 3. Navelli’s main staircase. Orthophoto and laser scanner point cloud.
and width, while at both sides narrow passages, buildings reduced to ruins, articulated facades, arcs and other stairs make it difficult to avoid occlusions in data acquisition. Overall forty scan stations were therefore necessary to avoid gaps in the point cloud (see Figure 3). The scans were registered through common targets surveyed by total station and referred to the general reference system.
A close range photogrammetric survey of the staircase was performed as well to provide high resolution/high quality images to texturize the point cloud acquired by the C10 scanner, whose integrated camera did not provide satisfactory results in this case. At the same time the photogrammetric survey allowed to evaluate the effective drawbacks and strengths of this approach compared to TLS survey. Over 300 images were taken on both sides of the staircase and oriented in the general reference system thanks to natural and artificial targets surveyed by total station. The photogrammetric DSM was generated with Agisoft Photoscan. The mesh models were then completed with the TLS data and used for the orthophoto production (see Figure 3).
Many building portals are architectural elements of true artistic relevance and were therefore to be considered in case the building is included in a restoration plan. A detailed survey was hence performed using both TLS and photogrammetry. As can be seen from Figure 4, that shows the color-coded discrepancies of the two models after ICP registration, the different techniques agree well within 2 mm for most of the surface. An overall systematic behaviour of the differences can be noticed, perhaps due to a scale error. The discrepancies on the edges (e.g. on the wooden door fissure) might depend to some extent from the different GSD of the original data and from interpolation. The lighting condition and shadows might be the cause of other discrepancies (e.g. below the arch key). Overall, data acquisition by photogrammetry in this case is much faster and easier to execute compared to TLS, while data processing time and the quality of results are really comparable.
Figure 4. a. Portal photogrammetric model. b. Map comparison [m] between the photogrammetric DSM generated with
Photoscan and C10 laser scanner point cloud.
3. CODIPONTE CASE STUDY
Codiponte is a village in the municipality of Casola in Lunigiana (Tuscany, Italy). It is located in the Province of Massa and Carrara at about 250 metres above sea level. It takes its name from the ancient bridge (“Ponte” in Italian), set over the River Aulella, still open to traffic and important and distinctive feature of the village. The village rises up on the Via
Francigena and has been an important settlement since the 7th century BC. The present settlement dates back to Middle Ages and is placed on the slope of the hill.
The bridge and the castle represent the most significant elements of the village, both for their history and for their architectural and artistic features. The bridge dates back to 11th - 12th centuries, is a three-span bridge and the masonry is of bricks and stones depending on the time of construction. In fact, the bridge underwent numerous reconstructions and reinforcement because of collapses and damages due to flooding of the river.
The castle, which would represent the focus point of Codiponte but now it is in ruins and is largely collapsed and damaged by weed, overlooks the entire village. Due to its advanced state of decay, its original structure is not well recognizable anymore. Originally, it had a square perimeter with many internal elements, with stairs and vaults, and was subdivided in two levels. On 21st June 2013 a big earthquake hit the village and the castle was further damaged. Due to its current preservation state, the goal of a complete recovery for its reuse is unrealistic. However, the local administration has required a project of promotion of the entire village, with emphasis on the restoration and conservation of the ancient castle, to preserve, at least, its state of ruin and avoid collapses that could jeopardize the houses below, and a project of reinforcement of the bridge, which is damaged in particular in correspondence of the arch and the abutment near the road.
The project has been awarded to DICATeA and so an accurate preliminary survey campaign, of the village and specifically of the castle and the bridge, was performed.
3.1 Survey campaigns
The aims of the survey campaign were essentially two: collecting all the information on the artefacts (such as geometry, structure, materials, state of damage, crack system and so on), in order to address the restoration project, and, at the same time, providing a BIM of the castle as useful instrument to evaluate the restoration choices and plan the maintenance actions. For these reasons, a 3D survey was performed and the models obtained were used to extract the two-dimensional required documents (orthophotos, plans and cross-sections) and to implement the BIM system.
Differently from Navelli, the object of the survey was more circumscribed and the range of survey scales was more limited, corresponding to architectural and detail scale. Despite this, since the general recovery project must cover the entire village, a large scale survey of location was performed through UAS (Unmanned Aerial Systems) photogrammetry. As in the previous case study, a GPS network was realized to provide the GCP to which anchor both the aerial survey and the architectural survey of the castle and the bridge. In this way, all the measurements are referred to the same reference system in UTM-WGS84 (ETRS89) coordinates with orthometric heights.
3.1.1 The survey of the village: The terrestrial survey started with the creation of a GPS network made of 16 stations along the village streets. This allowed the creation of a stable reference system according to which all data were registered. In this case, many of the locations chosen to provide good GCP coverage of the area are at the edges of the urban settlement near (or inside) the surrounding woods. A good satellite constellation geometry was therefore required, with quite long static measurement sessions, which in turn required a careful schedule of the survey.
b a
On the basis of these GCPs the photogrammetric survey of the village was carried out. Due to the small size of the area under investigation (ca. 380 x 280 m) and the need to complete the survey in short time and with low cost, a UAS survey seemed to be the optimal solution. The drone used was the fixed-wing Swinglet CAM produced by SenseFLY. It is particularly functional because, being realised in Expanded Polypropylene (EPP) foam and carbon structure, it is very lightweight which makes it able to fly up to 30 minutes with a single battery and so, in this case, to complete the planned mission with just one flight. The Swinglet CAM was equipped with a Canon IXUS 125 HS camera with 4 mm focal length optics (35 mm equivalent focal length is 24 mm) and a resolution of ca. 16 Mpixels. Unfortunately, previous experience showed that often the quality of the images acquired by this platform is not optimal if compared with higher quality but heavier cameras. During the flight planning, this issue was taken in consideration opting for a much smaller GSD than the one strictly required for the desired mapping scale (1:500).
Overall 124 images arranged in 12 strips cover the entire area and the neighbouring lands on the opposite bank of the river. They were flown at 120 m of relative elevation, with a longitudinal overlap of about 80% and a sidelap of 60% and a GSD (Ground Sampling Distance) of 4 cm/pixel. The GCPs had been materialized on the ground using black and white targets. The block was adjusted with the commercial software
PhotoScan. The residuals on Ground Control Points, which depend on the coherence between the block structure and the control network, are on average of 1.8 pixels, corresponding to about 7.2 cm on the ground.
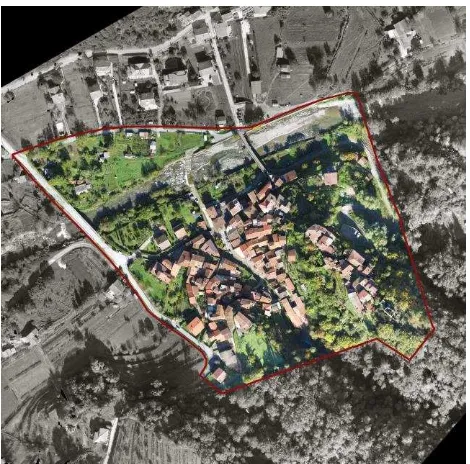
The photogrammetric DSM and orthophoto generation (see Figure 5) was carried out again using PhotoScan.
3.1.2 Bridge survey: The survey of the bridge was rather simple. The object has a linear structure that allows measuring all parts without occlusions and is easily accessible especially in summer time and in the first months of autumn, when the riverbed is almost empty and the flow rate negligible.
As far as the choice of the surveying technique is concerned, the advantages and disadvantages in the use of TLS or photogrammetry in this case are comparable. The bridge is indeed accessible both to position the scanning stations and to take the images even under the arches; moreover, the texture, the light conditions and the object dimensions did not favour a technique rather than the other.
Nevertheless, having the possibility of using both techniques and considering the advantages that an integrated survey generally produces, a survey with each was executed.
The bridge survey was supposed to deliver a complete and deep knowledge of the object status in order to assist the restoration project. In this respect, photogrammetry was particularly efficient in producing orthophotos as base for surface deterioration analysis. Moreover, the bridge was affected by weed, in particular bushes in correspondence of the abutment near the road. At the time of the survey campaign, the vegetation was still present and so was necessary to update the 3D model after weed removal in order to have the possibility to observe cracks in the masonry. With progress in the restoration works, additional surveys were required to update the model. Again, in this regard photogrammetry was more suitable than TLS, thanks to its flexibility and possibility to add new images to the original block.
However, terrestrial photogrammetry was not sufficient for the complete acquisition of the bridge, being impractical for the survey of the extrados. A drone being not available at the time of the bridge survey (performed later than the village survey), a laser scanner has been used to this aim.
Seven scans were performed with a Leica C10 scanner over and all around the bridge in order to have points in common with the photogrammetric model and co-register them.
The photogrammetric survey was performed with a Nikon D3x camera with calibrated 35 mm optics. Overall 131 images were taken and processed with PhotoScan. A bundle block adjustment was performed using some points gathered from the laser point cloud as GCP, so that the two models were generated in the same reference system. The comparison of the two DSM
Figure 6. Comparison map [m] between the TLS point cloud and the photogrammetric model of the bridge. Figure 5. Orthophoto with the survey area highlighted.
(photogrammetry-based and TLS-based) (Figure 6) showed minimal differences, in the range of TLS expected accuracies (ca. 5 mm). The upper part of the bridge, acquired by the TLS, was used to integrate the missing parts in the photogrammetric DSM. From the assembled model, all the traditional products, such as orthophotos and cross-sections, were obtained (Figure 7).
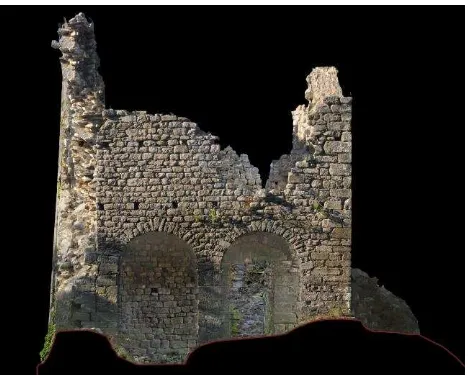
3.1.3 Castle survey: The castle stands on steep, very rugged terrain covered with vegetation that infests the castle. It was in fact necessary to remove a large part of vegetation to carry out the survey.
As already mentioned, the castle is in ruins, with many collapsed parts reduced to heaps of stones. Performing a complete and time consuming direct survey with tapes and range finders of the less damaged parts was dangerous for the safety of the surveyors, due to the precariousness of the structure. So, as far as the architectural survey is concerned, the direct survey of the accessible and less unstable areas had been
integrated with a TLS and terrestrial photogrammetry survey (Figure 8), the latter much faster (and consequently much safer), as far as data acquisition time is concerned.
Also in this case, an integration of the two techniques was not strictly required: both approaches provide satisfactory results with comparable overall workload. The photogrammetric acquisition is much faster but requires a careful planning of the block geometry to provide a complete reconstruction. Its integration with UAV acquisition of the top parts of the castle (such as the top of the walls or the extrados of the vault, non-visible from the ground) is straightforward, and DSM and orthophoto generation (Figure 9) can be successfully operated with automatic Structure from Motion and Dense Matching algorithm implemented in commercial software. The survey of GCP is mandatory and requires additional field operations. On the other hand, TLS survey requires longer measurement sessions on site, but provides immediate reconstruction with lower chance of incompleteness. If georeferencing is not required, TLS does not need the survey of GCP if a strong network of scan stations can be set.
The survey campaign was organized as summarized in Table 10; the final model was obtained integrating terrestrial and UAS photogrammetry, while the TLS point cloud was used as term of comparison and for selection of the GCPs.
TLS
Scanner Leica C10 time-of-flight Scan-station # Scans 11
Resolution High: 1 point/5 mm at 100 m Restitution Leica Cyclone 3D
T
er
re
str
ial
P
hotogr
amm
etr
y Camera Nikon D3x
Resolution 6048x4023 pixel Focal lens 18 mm # Images 329
# GCPs 18
Adjustment Agisoft PhotoScan
UA
S
P
hotogr
amm
etr
y Drone DJI Phantom 3
Camera Sony EXMOR Resolution 12Mpixel
Focal lens 20 mm (35 mm format equivalent) # Images 43
Height of flight 25 m
Overlap Longitudinal 80%, sidelap 80%
# GCPs 16
Adjustment Agisoft PhotoScan
Table 10. Survey techniques summary.
4. FINAL CONSIDERATIONS AND CONCLUSIONS
In the first half of 2000, with TLS spreading fast, photogrammetry seemed to lose ground and surveyors split between the opposing factions. After some time, in most paper a settlement for "integration is better" seemed to prevail. Then, "the comeback of photogrammetry" (Haala, 2009) opened again the discussion on which technique is the best. There is little chance that the debate will see the end and certainly this is not Figure 7. Orthophoto of the bridge.
Figure 8. Castle photogrammetric model.
Figure 9. Orthophoto of the Castle.
the goal of this paper. However, there is no doubt that progress in DSM generation from images has greatly improved in recent years, both in completeness and accuracy of the survey. So, if the self-employed professional that occasionally is involved in small architectural surveys has a background in photogrammetry, in our opinion he should opt for photogrammetry, less expensive and highly versatile. On the other hand, the scope and variety of characteristics of more demanding surveys at architectural or urban scale can only be faced by surveying companies. They have the expertise and the incentive to use, as single or integrated techniques on a case by case judgment, both techniques.
5. REFERENCES
Achille C., Fassi F., and Fregonese L., 2012. 4 Years history: From 2D to BIM for CH - The main spire on Milan Cathedral. Proc. of the 2012 18th Int. Conf. on Virtual Systems and Multimedia, VSMM 2012: Virtual Systems in the Information Society, 377-382. DOI: 10.1109/VSMM.2012.6365948
Agugiaro G., Remondino F., Girardi G., Von Schwerin J., Richards-Rissetto H., and De Amicis R., 2011. Queryarch3D: querying and visualizing 3D models of a Maya archaeological site in a Web-based interface. Proceedings of XXIII CIPA Symposium - Prague, Czech Republic - 12/16 September 2011
Balletti, C., Guerra, F., Scocca, V., and Gottardi, C., 2015. 3D integrated methodologies for the documentation and the virtual reconstruction of an archaeological site, Int. Arch. Photogramm. Remote Sens. Spatial Inf. Sci., XL-5/W4, 215-222, doi:10.5194/isprsarchives-XL-5-W4-215-2015.
Barazzetti, L., Banfi, F., Brumana, R., Oreni, D., Previtali, M., and Roncoroni, F.: HBIM and augmented information: towards a wider user community of image and range-based reconstructions, 2015. Int. Arch. Photogramm. Remote Sens. Spatial Inf. Sci., XL-5/W7, 35-42, doi:10.5194/isprsarchives-XL-5-W7-35-2015.
Brumana, R., Oreni, D., and Raimondi, A., 2013a. From survey to HBIM for documentation, dissemination and management of built heritage: The case study of St. Maria in Scaria d'Intelvi. Digital Heritage International Congress (DigitalHeritage), Vol.1, pp. 497-504.
Brumana, R., Oreni, D., Van Hecke, L., Barazzetti, L., Previtali, M., Roncoroni, F., and Valente, R., 2013b. Combined geometric and thermal analysis from UAV platforms for archaeological heritage documentation, ISPRS Ann. Photogramm. Remote Sens. Spatial Inf. Sci., II-5/W1, 49-54, doi:10.5194/isprsannals-II-5-W1-49-2013.
CyArk Project. http://www.cyark.org
Eastman, C. M., Teicholz, P., Sacks, R., and Liston, K., 2011. BIM Handbook. A Guide to Building Information Modeling for Owners, Managers, Designers, Engineers, and Contractors. John Wiley & Sons.
Fassi, F., Fregonese, L., Ackermann, S., and De Troia, V., 2013. Comparison between laser scanning and automated 3d modelling techniques to reconstruct complex and extensive cultural heritage areas, Int. Arch. Photogramm. Remote Sens. Spatial Inf. Sci., XL-5/W1, 73-80, doi:10.5194/isprsarchives-XL-5-W1-73-2013
Grussenmeyer, P., Alby, E., Landes, T., Koehl, M., Guillemin, S., Hullo, J.-F., Assali, P., and Smigiel, E., 2012. Recording approach of heritage sites based on merging point clouds from high resolution photogrammetry and terrestrial laser scanning. In: The International Archives of the Photogrammetry, Remote Sensing and Spatial Information Sciences, Melbourne, Australia, Vol. XXXIX-B5, pp. 553-558.
Günay, S., 2011. From data to information: methodology for a gis based historic building conservation project. Proceedings of XXIII CIPA Symposium - Prague, Czech Republic - 12/16 September 2011
Haala, N. 2009. Comeback of digital image matching. In Photogrammetric Week, vol. 9, pp. 289-301.
Kersten, T., Mechelke, K., and Maziull, L., 2015. 3D model of al Zubarah Fortress in Qatar - terrestrial laser scanning vs. dense image matching, Int. Arch. Photogramm. Remote Sens. Spatial Inf. Sci., XL-5/W4, 1-8, doi:10.5194/isprsarchives-XL-5-W4-1-2015
Murphy, M., McGovern, E., and Pavia, S., 2011. Historic Building Information Modeling - Adding Intelligence to Laser and Image based Surveys. The International Archives of the Photogrammetry, Remote Sensing and Spatial Information Sciences. Vol 38-5/W16, pp 5
Oreni, D., Brumana, R., Della Torre, S., Banfi, F., Barazzetti, L., and Previtali, M.: Survey turned into HBIM: the restoration and the work involved concerning the Basilica di Collemaggio after the earthquake (L'Aquila), 2014. ISPRS Ann. Photogramm. Remote Sens. Spatial Inf. Sci., II-5, 267-273, doi:10.5194/isprsannals-II-5-267-2014.
Remondino F., 2011. Heritage recording and 3D modeling with photogrammetry and 3D scanning. Remote Sensing, 3(6), pp. 1104-1138.
Rodríguez-Gonzálvez, P., Nocerino, E., Menna, F., Minto, S., and Remondino, F. 2015. 3D surveying & modeling of underground passages in wwi fortifications, Int. Arch. Photogramm. Remote Sens. Spatial Inf. Sci., XL-5/W4, 17-24, doi:10.5194/isprsarchives-XL-5-W4-17-2015.
Tucci, G., Algostino, F., Bonora, V., and Guidi, G., 2010. 3D modeling of Boccaccio’s hometown throught a multisensor survey. The International Archives of the Photogrammetry, Remote Sensing and Spatial Information Sciences, Kyoto, Japan, Vol. XXXIV Part 5/W10, pp. 1-6.
Yin, X., Wonka, P., and Razdan, A., 2009 Generating 3d building models from architectural drawings: a survey. IEEE Comp. Graph. Appl., 29(1), pp. 20-30.
Visintini, D., Guerra, F., Adami, A., and P. Vernier, 2007. A 3D Virtual model of the Gorizia downtown (Italy) by matching historical maps with aerial and terrestrial surveying techniques. e_Perimetron, n.3 vol. 2 p.117-133, ISSN1790-3769, Tessaloniki.