AN AUTOMATIC AND MODULAR STEREO PIPELINE FOR PUSHBROOM IMAGES
Carlo de Franchis⋆, Enric Meinhardt-Llopis⋆, Julien Michel†, Jean-Michel Morel⋆and Gabriele Facciolo⋆ ⋆
CMLA, Ecole Normale Supérieure de Cachan, France - [email protected] †CNES - DCT/SI/AP, France
Commission III, WG III/3
KEY WORDS:3D reconstruction, stereo, digital elevation models, remote sensing, pushbroom geometry
ABSTRACT:
The increasing availability of high resolution stereo images from Earth observation satellites has boosted the development of tools for producing 3D elevation models. The objective of these tools is to produce digital elevation models of very large areas with minimal human intervention. The development of these tools has been shaped by the constraints of the remote sensing acquisition, for example, using ad hoc stereo matching tools to deal with the pushbroom image geometry. However, this specialization has also created a gap with respect to the fields of computer vision and image processing, where these constraints are usually factored out. In this work we propose a fully automatic and modular stereo pipeline to produce digital elevation models from satellite images. The aim of this new pipeline, calledSatellite Stereo Pipelineand abbreviated ass2p, is to use (and test) off-the-shelf computer vision tools while abstracting from the complexity associated to satellite imaging. To this aim, images are cut in small tiles for which we proved that the pushbroom geometry is very accurately approximated by the pinhole model. These tiles are then processed with standard stereo image rectification and stereo matching tools. The specifics of satellite imaging such as pointing accuracy refinement, estimation of the initial elevation from SRTM data, and geodetic coordinate systems are handled transparently by s2p. We demonstrate the robustness of our approach on a large database of satellite images and by providing an online demo of s2p.
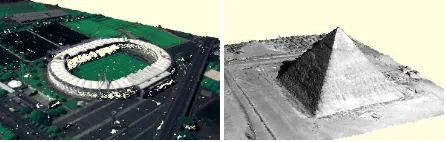
Figure 1: 3D point clouds automatically generated from Pléiades stereo datasets, without any manual intervention, with the s2p stereo pipeline. Its implementation can be tested online through a web browser.
1 INTRODUCTION
This paper presents an automatic 3D reconstruction pipeline for satellite images, meant to be modular and generic. This work is motivated by the recent availability of high resolution images from new satellites with stereo capabilities such as Pléiades. Even if most of the experiments described here were carried on Pléi-ades images, our work also applies to images from other satellites such as WorldView, Quickbird, Spot and Ikonos.
The Pléiades constellation is composed of two Earth observation satellites able to deliver images with a resolution of70cm and a swath width of20km. Their unique agility allows to capture multiple views of the same target in a single pass. This permits the nearly simultaneous acquisition of two or three images for stereo reconstruction with a small base to height ratio, ranging from0.15to0.8. Pléiades, as many other Earth observation satel-lites, acquires images with a pushbroom sensor, which captures them line by line as the satellite moves. The calibration infor-mation describing the camera system is provided for all Pléiades images under the form of RPC functions. RPC stands for Ratio-nal Polynomial Cameramodel. Details about these functions are given in appendix A.
The philosophy of the s2p pipeline is to isolate the 3D recon-struction problem from the complexities associated to satellite imaging. To that aim the satellite images are processed by small tiles. This permits to locally approximate the pushbroom geom-etry with a pinhole model, which in turn allows to stereo-rectify the tiles using standard computer vision tools (Hartley and Zisser-man, 2004). The rectification error obtained on the tiles is below the tenth of pixel (de Franchis et al., 2014c), improving the state of the art by one order of magnitude (Oh et al., 2010). Each rec-tified tile is then processed using off-the-shelf stereo matching algorithms.
The pipeline deals transparently with inaccuracies of the sensor attitude (Hanley et al., 2002, Grodecki and Dial, 2003, Fraser and Hanley, 2005), by estimating relative corrections for each tile without needingground control points(de Franchis et al., 2014b). These local corrections are then combined in a global correction for the entire image, which is used to perform a consistent 3D triangulation. The SRTM information (Shuttle Radar Topography Mission, see section 3.3) is automatically incorporated to identify corresponding regions in both images.
The s2p pipeline also handles three-view stereo datasets. In this case two stereo pairs are processed independently, then the re-sulting elevation models are merged to increase the coverage (see figure 12 for an example). This fully automatic pipeline is avail-able online for testing (de Franchis et al., 2014a).
1.1 Related works
these works, s2p does not include a particular stereo matching al-gorithm. Instead the main contribution of our work is a complete framework to evaluate any stereo matching algorithm (that works with stereo-rectified images) on satellite pushbroom images.
In the next section we give an overview of the whole pipeline, and in sections 3 to 5 we detail each of its blocks. In section 6 we validate our approach with extensive experimentation carried out using images from Pléiades and WorldView-1.
2 S2P OVERVIEW
The s2p pipeline deals with pairs or triplets of images. Pairs and triplets are the standard stereo products proposed by the main commercial providers of satellite images such as DigitalGlobe and Airbus Defense and Space (formerly Astrium).
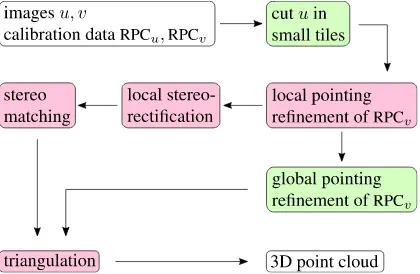
In case of a stereo triplet, each pair out of the six possible pairs is processed independently, and the resulting 3D point clouds are then merged. The merging procedure is not discussed in this pa-per. Figure 2 gives an overview of the processing pipeline for a stereo pair of images. The input images are cut in small tiles, to allow a very precise stereo image rectification. The optimal size of the tiles is discussed in section 3. Then for each tile the calibration data is refined (section 4) and the images are stereo-rectified (section 3). Each stereo-stereo-rectified tile pair is matched using some standard stereo matching algorithm (section 5). The local refinements from all the processed tiles are combined to compute a global correction of the calibration. The triangulation uses the globally corrected calibration data, which is the same for all tiles. This ensures a perfect continuity between the 3D points computed from different tiles.
Figure 2: s2p overview. The input is a pair of images with their respective rational polynomial camera models, and the output is a digital elevation model given as a georeferenced 3D point cloud. Green blocks are applied to the whole images, while pink blocks are applied on small independent tiles. They can be processed in parallel.
3 LOCAL STEREO-RECTIFICATION OF PUSHBROOM IMAGES
Stereo image rectification is a common technique used in 3D re-construction algorithms. It permits to simplify the search of cor-responding points between the images of a stereo pair. However, only images taken with a pinhole camera can be rectified. Push-broom cameras produce images that are not rectifiable. In this section we study to what extent it is possible to stereo-rectify pushbroom images anyway, in order to use standard matching algorithms from the image processing and computer vision com-munities for processing satellite stereo pairs. The approach pre-sented here considers the rectification as an auxiliary step for the
Figure 3: In the pinhole case the epipolar plane defines a cor-respondence between epipolar lines. In the pushbroom case the projection of a 3-space ray on the secondary view generates a ruled quadric. The projection of this quadric on the reference view contains many epipolar curves: epipolar curves are not con-jugate.
computation of stereo correspondences, not as a final product. Images are thus processed in small tiles by locally approximating the pushbroom camera with an affine camera model. The explicit modeling of the approximation allows to quantify and control the rectification errors without needing ground control points. Ex-periments on Pléiades and WorldView-1 images of many kinds of scenes (urban, mountainous, flat) demonstrate that rectifica-tion errors can be reduced to one tenth of pixel.
3.1 The stereo image rectification problem
Stereo image rectification permits to restrict the search for cor-responding image points from the entire image plane to a single line. For any pointxin a view of the pair, the corresponding point x′in the other view, if it exists, lies on theepipolar lineofx de-noted byepix
. Converselyxlies onepix′
. The rectification aims to resample the images in such a way that corresponding points are located on the same row, thus simplifying the matching task and permitting to use all classic stereo matching algorithms.
For images taken with pinhole cameras there is a correspondence between the epipolar lines of the two views. All the pointsx′of the second view lying on the epipolar lineepix
share the same epipolar line in the first view. Epipolar linesepix
andepix′ are said to beconjugate. Figure 3 illustrates the conjugacy of epipo-lar lines. It is well-known (Hartley and Zisserman, 2004) that images can be resampled in order to produce a rectified pair in which the epipolar lines are horizontal and match up between views. Matching rectified images is much simpler than match-ing the original images, because the search of correspondences is performed along horizontal lines only (Ohta and Kanade, 1985).
Satellite images however can’t be rectified because they are taken with pushbroom sensors, for which the pinhole model is invalid. Using various pushbroom camera models (Orun and Natarajan, 1994, Hartley and Gupta, 1997), it can be shown that pushb-room image pairs have non-straight epipolar curves and that these curves are not conjugate, making rectification impossible (Kim, 2000, Habib et al., 2005).
Many solutions have been proposed to circumvent the non rec-tifiability of pushbroom images. We may group them into three categories:
However, non-straight epipolar curves may prevent from ap-plying stereo matching optimizations and from using off-the-shelf correlators.
2. Affine camera approximation (Ono, 1999, Fraser et al., 2004, Morgan et al., 2006, Wang et al., 2011): other au-thors propose to approximate the pushbroom sensor with an affine camera model. This approach often uses Ground Con-trol Points (GCP) to estimate the affine model for each im-age, and the overall achieved precision is on the order of one pixel on images from Spot and Ikonos satellites.
3. Polynomial epipolar resampling (Oh et al., 2010, Christophe et al., 2008): Ohet al. show that even if pairs of epipolar curves don’t exist in the pushbroom case, for small altitude ranges of the scene one may assume with small error that curve pairs exist. Thus they build whole epipolar curve pairs on Ikonos stereo images by putting together small pieces of corresponding curves. Then they resample the images to transform these curves into straight horizontal lines. They report a maximal error of one pixel. Since their resampling procedure is non-linear, it can’t guarantee that straight lines are preserved.
It is important to note that errors in the rectification are critical as they may result in a vertical disparity between corresponding points in the rectified images, which may hurt the performance of the stereo matching. We refer to this vertical disparity asepipolar error. The epipolar error is the ultimate performance measure for the different methods. Current state of the art methods attain errors on the order of one pixel. The method proposed in this section lowers this error by one order of magnitude.
3.2 In defense of the affine approximation
A large-scale stereo-rectified pair is not needed for applying a stereo matching algorithm. Thus we propose, like Morganet al. (Morgan et al., 2006), to approximate the sensor by an affine cam-era model. But, unlike Morgan, our approximation is made only on small image tiles. This limits the discrepancy between epipo-lar curves (Oh et al., 2010). It leads in practice to an almost perfect rectification, with a very small epipolar error.
For each locally rectified tile a standard off-the-shelf stereo al-gorithm can be applied to estimate a horizontal disparity map, with high chances of success thanks to the high precision of the stereo image rectification. The computed correspondences are then transferred back to the coordinate system of the original ages. This eliminates the need for stereo-rectifying the full im-ages all at once.
While Morganet al. use GCPs to estimate the affine camera mod-els, we use the standard computer vision approach for stereo im-age rectification (Hartley and Zisserman, 2004): first estimate the affine fundamental matrix between the two views, then compute a pair of affine transformations to rectify the images. The funda-mental matrix estimation requires only image matches, eliminat-ing the need for GCPs and manual intervention.
The suitability of the affine camera model in approximating a satellite pushbroom sensor can be attributed to Okamotoet al. (Okamoto et al., 1993). Their main arguments are all applicable to Pléiades and WorldView images:
• Altitude differences in the photographed terrain are small in comparison with the flying altitude of the satellite, whose mean is 694 km for Pléiades.
• The angular field of view of the sensor is narrow. For a full Pléiades image it is less than2◦, and it is much less if one considers only a small tile.
• The acquisition time of such a tile is less than one second, thus the sensor may be assumed to have the same attitude and speed while capturing the scene.
Our locally affine rectification is presented in Algorithm 1, and its main steps are explained in the next subsections. More details and quantitative experiments about this procedure can be found in (de Franchis et al., 2014c).
3.3 SRTM data
The Shuttle Radar Topography Mission (SRTM) is an interna-tional research effort (Farr et al., 2007) that obtained digital ele-vation models on a near-global scale at a resolution of three arc-seconds,i.e. 90 m. The SRTM data is used, together with the RPC functions, to estimate the altitude range[hm, hM]of the 3-space points imaged in a given tile. This estimation is needed for the computation of the virtual matches used for stereo image rectification.
3.4 Virtual correspondences generation
A natural way to compute correspondences between two views is to extract feature points, compute descriptors and match them, as done by SIFT (Lowe, 2004). But this may lead to a set of key-points all lying on the same plane,i.e. on the ground. This con-figuration is degenerate and❋cannot be computed from it. Even if the keypoints do not exactly lie on the same plane, as relief re-duces to zero, the covariance of the estimated❋increases (Hart-ley and Zisserman, 2004). A safer way to estimate❋is to use the calibration data (Oh et al., 2010, Tao and Hu, 2001) to generate virtual correspondences between the two views.
Given a regionΩin the reference image and an estimated alti-tude range[hm, hM]for the associated 3-space points (i.e.points that were imaged intoΩ)Ωis back-projected on the Earth surface thanks to RPC−1. Let denote byΓ =RPC−1(Ω×[hm, hM])⊂
R3 the back-projected domain, and by(Xi)i=1,...,N a regular sampling ofΓ. Each 3-space pointXi is projected on the two images using the associated RPCs, leading to a virtual correspon-dence(xi,x′i). The images contents at locationsxiandx′imay not correspond, butx′iis located on the epipolar curve ofxi, and that is enough to estimate a fundamental matrix.
Algorithm 1:Locally affine rectification of pushbroom images. Data: RPC1,RPC2: RPC’s of input images;x, y, w, h∈R:
coordinates of ROI in image 1; SRTM data (when available)
Result:❍1,❍2: rectifying homographies
1 estimate altitude range; ✴✴ ❢r♦♠ ❘P❈s ♦r ❙❘❚▼
2 computeNvirtual matches(xi,x′i); ✴✴ s❡❝t✐♦♥ ✸✳✹ 3 estimate❋from(xi,x′i); ✴✴ ●♦❧❞ ❙t❛♥❞❛r❞ ❛❧❣♦r✐t❤♠ 4 compute❍1and❍2from❋
It is important to note that this approximation is limited to satel-lite images. Aerial pushboroom images such as from Leica’s ADS 40 or 80 cannot be rectified in that way since a plane cannot fly in a straight line like a satellite.
4 POINTING CORRECTION
There is a noticeable bias of a few pixels in the RPC func-tions (Fraser and Hanley, 2005, Hanley et al., 2002, Grodecki and Dial, 2003). This is inevitable due to the limited precision of the camera calibration. For many purposes, this bias can be ignored, since it typically results in a global offset of the results. How-ever, for stereo matching, the epipolar constraints derived from the parameters of the cameras have to be as precise as possible. The local stereo image rectification algorithm proposed in sec-tion 3 relies entirely on the RPC funcsec-tions. Thus the relative bias between the RPC functions of the images of a stereo pair must be corrected before applying rectification. In this section we pro-pose a method to correct this bias relative to a given reference image. Our method does not rely on ground control points, but on the relative consistency of the image contents; thus, it can be implemented as an automatic pre-processing of the input images.
The knowledge of the projection function RPC and the associated inverse RPC−1for two imagesuandvallows to define epipolar curves. Ifxis a point in imageu, then the function
epix
uv :h7−→RPCv(RPC−
1
u (x, h)) (1)
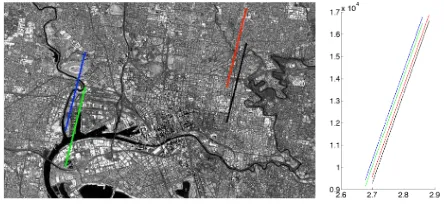
defines a parametrized curve in the domain of imagevcontaining all the possible correspondences of xfor different altitudesh. This curve is called theepipolar curveof the pointx. In practice, we observe that these curves are straight line segments which are almost parallel (see figure 4).
Figure 4: The RPC functions allow to draw the epipolar curves for a pair of imagesuandv(approx.16000×40000pixels). The left image shows four epipolar curves plotted in the domain of im-agev, they correspond to four points located near the edges of the imageu. The range of altitudes considered ish∈[−200,3000] meters. The right image shows the same epipolar curves placed closer to facilitate the comparison.
The epipolar curves are used to compute the altitudes of 3-space points which are visible in two images. Suppose thatxis the pro-jection of a point in imageu, andx′is the projection of the same point in imagev. Then the epipolar curve ofxpasses throughx′ and the valuehfor whichx′ = epix
uv(h)is the altitude of the 3-space point. An algorithm to computehis presented in section 5.
4.1 The relative pointing error
Given a pair of corresponding pointsxandx′in two images, the epipolar curve ofxmay not pass through the pointx′ (see fig-ure 5). We call this error therelative pointing error. It is not negligible at all, being often of the order of a few pixels.
Figure 5: This pair of views of a road intersection highlights the effect of the satellite relative pointing error. Two corresponding pointsxandx′ are shown, and the epipolar curve of pointxas traced by the RPC doesn’t pass through the corresponding point x′. Therelative pointing error, denoted bye, is the distance from the point to the epipolar curve. The altitude of the 3-space point corresponding toxandx′is approximated by the parameterhfor which the epipolar curve passes through the projection ofx′. Given two images u, v and a set of correspondences (xi,x′i)i=1...N, the relative pointing error betweenuandvis for-mally defined by
1 N
N
X
i=1
d(x′i,epixuvi(R)). (2)
Here epixi
uv(R)is the epipolar curve of point xi, anddis the distance, in pixels, between a point and a subset ofR2
. The set of correspondences between two images can be determined using SIFT (Lowe, 2004). Table 1 gives values for the relative pointing error measured on several Pléiades stereo pairs.
4.2 Correction of the relative pointing error
4.2.1 Not absolute but automatic correction The bias af-fecting the RPC is well known (Fraser and Hanley, 2005). Actu-ally it comes from the sensor attitude estimation, thus also affects the rigorous model, and the RPC approximation is not to blame for it (Fraser and Hanley, 2005). This bias is absolute. It can be evidenced with a single imageuand a unique ground control point (GCP)Xby observing that RPCu(X)is not exactly located on the actual image ofX. Several authors have modeled this ab-solute bias and proposed methods to compensate it (Fraser and Hanley, 2005, Hanley et al., 2002, Grodecki and Dial, 2003). All these methods need GCPs and manual interactions, thus are not suitable in a fully automatic 3D reconstruction pipeline such as s2p.
The relative pointing error can be corrected without any control points. This will not remove the absolute bias affecting the RPC, but will allow to perform efficient stereo matching between the views by following the epipolar curves.
4.2.2 Local relative pointing error Errors within the direct measurement of sensor orientation reside mainly in sensor at-titude (Fraser and Hanley, 2005). For an image tile of size 1000×1000pixels, covering a scene of size500×500m on the ground (with Pléiades resolution), we can assume that the scene is located at infinity with respect to the satellite. The error can then be modeled in image space as a translation.
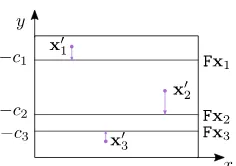
Figure 6: For a tile of size1000×1000, the epipolar curves are well approximated by parallel lines (see section 3). On this figure the lines are assumed to be horizontal. For each correspondence (xi,x′i)there is a vertical shift between the pointx′iand the line ❋xi. The median of all these shifts minimizes the relative epipolar error defined by formula 2.
on the epipolar curveepixi
uv(R). The desired translation❚∗ min-imises the relative pointing error defined by equation 2:
❚∗= arg min
❚
1 N
N
X
i=1
d(❚x′i,epixuvi(R)). (3)
From section 3 we know that the epipolar curveepixi
uv(R)is ap-proximated up to 0.05 pixels by the straight line❋xi, where❋is the affine fundamental matrix between the two views for the con-sidered tile. As this fundamental matrix is anaffine fundamen-tal matrix, all the lines❋xiare parallel. Without any additional restriction, we may assume that these lines are horizontal (other-wise just do a change of coordinates). The horizontal line❋xican be written, in homogeneous coordinates, as
❋xi=0 1 ci⊤. (4) With these notations, for each point correspondence(xi,x′i)we have
d(x′i,❋xi) =|y′i+ci|, (5) where x′i = (x′i, yi′,1)⊤. The situation is illustrated in fig-ure 6. This error is invariant to any horizontal translation, thus the search for a translation minimizing the relative pointing error of formula 3 can be restricted to vertical translations only. With a vertical translation of parametert, the error becomes
1 N
N
X
i=1
d(❚x′ i,❋xi) =
1 N
N
X
i=1
|yi′+t+ci|. (6)
The translation that minimizes this sum is given by the geometric median (Weiszfeld, 1937) of the vectors(−yi′−ci)i=1...N. The relative pointing error can thus be minimized in a tile by applying a translation to one of the images. Note that the median is robust against outliers, thus this correction procedure works well even in the presence of false matches.
Table 1 gives values of the relative pointing error measured on several Pléiades stereo pairs before and after correction. Figure 7 shows the effect of the corrective translation❚∗on the error vec-tors of a small tile. More details about the proposed procedure can be found in (de Franchis et al., 2014b).
4.2.3 Global relative pointing error model The model we use to correct the pointing error on a tile relies on the validity of the affine approximation. From section 3 we deduce that this model is valid on image regions of size smaller than1000×1000 pixels. For bigger regions, the local pointing correction model may not be valid. Several authors (Fraser and Hanley, 2005, Grodecki and Dial, 2003, d’Angelo and Reinartz, 2012) reported that the global RPC bias can be corrected with an affine trans-formation in image space. A simple way to estimate the optimal
(a) (b)
Figure 7: Error vectors for some keypoints on a1000×1000tile of a Pléiades image. (a) Error vectors before correction. (b) Error vectors after correcting the position of the second image by the optimal translation❚∗.
Figure 8: A global pointing correction is estimated for the whole processed region of interest from the local corrections that were computed in each tile. In this example, the region was cut into 6 tiles. In each tile a corrective translation was computed and is represented by an arrow starting from the center of the tile. The 6 corrective translations are used to estimate an affine transforma-tion that corrects the relative pointing error on the whole region.
affine transformation is to use the local corrections computed for each tile. An example of this procedure is given in figure 8.
5 STEREO MATCHING AND TRIANGULATION
For each rectified tile we compute the disparity by applying an off-the-shelf stereo matching algorithm. Because of its perfor-mance, we use here the implementation of SGM (Hirschmüller, 2008) included in OpenCV1. However, any other stereo match-ing algorithm can be used instead. The disparities are then in-terpreted as point correspondences with the coordinates of the original (non rectified) images, as illustrated in figure 9. From these correspondences the 3D position of the point is triangulated
1
StereoSGBM module in OpenCV 2.4.8 (❤tt♣✿✴✴♦♣❡♥❝✈✳♦r❣✴), with default parameters. To filter more outliers we compute a second disparity map reversing the reference and secondary images and enforce the consistency of both maps (Hirschmüller, 2008).
Dataset Alt. range pointing residual width (m) error (pix) error (pix) ❝❛♥♥❡s 151 4.33 0.12
❣✐③❛ 57 0.63 0.09 ♠❡r❛ 1097 8.47 0.29 ♠♦♥t❴❜❧❛♥❝ 466 2.23 0.15 ♠♦♥t❡✈✐❞❡♦ 18 0.16 0.09 ♥❡✇❴②♦r❦ 40 0.17 0.10 t♦✉❧♦✉s❡ 4 0.92 0.14 ✉❜❛②❡ 220 0.27 0.17 ♠❡❛♥ – 2.15 0.14
using the refined RPC camera models. The SRTM data is used to estimate the initial disparity range, together with the point corre-spondences that were used to correct the local pointing error.
reference secondary
locally rectified tile
Figure 9: A match on a rectified tile is interpreted as a point cor-respondence in the coordinate systems of the original images.
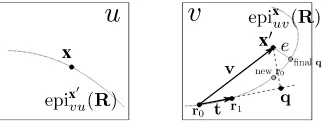
Triangulation with RPC functions. As studied in section 4, the limited precision of the RPC data may cause a pointx′ to be displaced from the epipolar lineepix
uv(R)of the correspond-ing pointsx. The Algorithm 2 determines iteratively the altitude of the 3-space point defined by the point correspondence(x,q), whereqis the projection ofx′on the epipolar curveepix
uv(R). The algorithm updates an altitude hypothesishfor the pointxin such a way that its correspondent pointr0is as close as possible
to the matchx′. The altitude hypothesis is updated by linearly approximating the epipolar curve. Figure 10 illustrates the sim-ple rationale behind this algorithm. As the epipolar lines are very smooth the stephST EPcan be large. We set it to1.
Figure 10: Illustration of one iteration of Algorithm 2. The im-agesuandv, two corresponding pointxandx′, and the epipolar curveepix
uv(R).
Algorithm 2:Altitude of a point from a correspondence using RPC.
Data:x,x′∈R2
: corresponding points in imagesuandv; RPCu,RPCv: the respective RPC’s.
Result:(h, e): The altitudehof the imaged point and the distanceefromx′to the epipolar curveepix
uv(R).
The stereo image rectification method proposed in section 3 is evaluated by measuring the epipolar error, which is completely determined by the fundamental matrix❋. This error is measured
500 1000 1500 2000 2500 3000 3500 4000 4500 5000 Tile size (pix)
Figure 11: Dependence of the epipolar error with the tile size. A tile of size ranging from500×500to5000×5000pixels was selected in the middle of a Pléiades reference image. Virtual matches were computed using altitude ranges given by SRTM data.
Dataset Scene dim. (km) RPC altitude validity (m) ❝❛❧❛♥q✉❡s 25×24 40 – 1090
Table 2: Pléiades datasets used for the experiments.
by obtained as described in section 3.4. This error is the maximal distance between a point’s epipolar line and the matching point in the other image (computed for both points of the match). The distanced(x′i,❋xi)between a pointx′iand the epipolar line it is
Numerical results. From a geometric viewpoint, the locally affine rectification method described in section 3 amounts to ap-proximate the two pushbroom sensors with affine camera models. The validity of this approximation relies on the dimensions of the 3-space domain on which it is used. These dimensions are given by the tile size and the altitude range. To understand the influence of these two parameters, we measured the epipolar error on the Pléiades datasets listed in Table 2.
(a) left image (b) right image (c) nadir image
(d) DEM from nadir-left pair (e) DEM from nadir-right pair (f) fused DEM
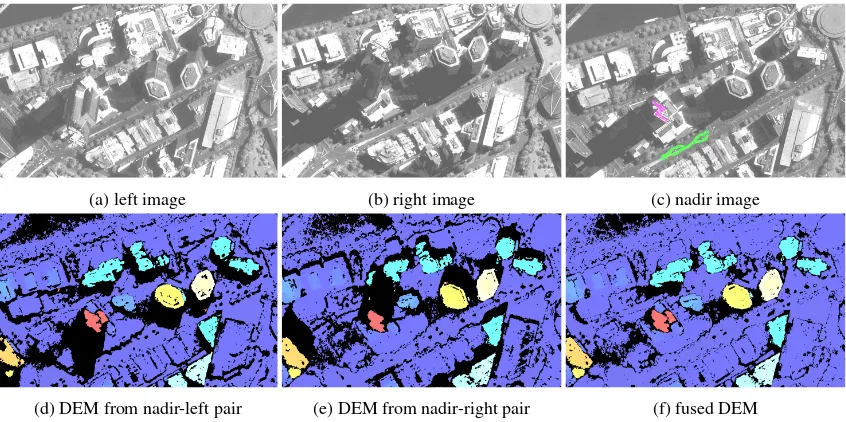
Figure 12: Three Pléiades images of Melbourne (a-c), the roof and street areas used for the evaluation are highlighted in (c). The elevation maps obtained by taking only two images are shown in (d) and (e), while (f) corresponds to the fusion with outlier filtering. Black areas represent rejected pixels.
Figure 13: The summit of Mont Blanc, as computed by s2p. To obtain this point cloud, the user clicked a single time on the ap-propriate place of the map.
Pléiades dataset it is always possible to stereo-rectify tiles of size 1000×1000pixels with an epipolar error lower than0.05pixels.
6.2 Pipeline validation
As a validation of the s2p pipeline we processed a region from a three-view stereo dataset of Melbourne. Our validation does not include ground control points. Thus we evaluated the rela-tive precision by measuring the height of a known building. The Eureka Tower is a297.3-metre skyscraper located in the South-bank precinct of Melbourne, which has been highlighted in fig-ure 12(a-c). The altitude estimates were computed by averaging the heights at the street level (yielding16.15±0.23meters) and on the roof (yielding312.97±0.49meters). Thus our estimated height of the Eureka Tower is296.82±0.72meters.
Figure 12(d-f) shows the elevation models obtained from the nadir-left and nadir-right pairs for the Melbourne dataset. Note that both images contain significant occluded regions in the vicin-ity of tall structures, however these regions are complementary.
The fusion of both models exploits this complementarity to pro-duce a much denser elevation model.
As an illustration of the automatic power of s2p, Figure 13 shows the summit of Mont Blanc. This point cloud was obtained after a single click on a Pléiades image. These and other reconstruc-tions can be performed online on the web page associated to this article (de Franchis et al., 2014a).
7 CODE AND ONLINE DEMO
The s2p stereo pipeline described here is completely imple-mented and will be released as open source software. It can be tested online (de Franchis et al., 2014a) thanks to the demo frame-work of the IPOL journal (IPOL, 2010). Several stereo datasets from Pléiades and a stereo pair from WorldView-1 are available for testing. The implementation is compatible with all the stereo datasets provided by Airbus DS and DigitalGlobe, and thus could be tested on images from WorldView-2, QuickBird-1 and Spot-6.
8 CONCLUSIONS
Thorough experimentation on numerous Pléiades datasets has shown that using tiles of size1000×1000pixels allows a stan-dard stereo rectification of pushbroom images with a precision of 0.05pixel, regardless of the altitude range of the scene. The rec-tification is performed thanks to the RPC data, whose accuracy is locally refined on each tile. This enables standard stereo match-ing algorithms to be used and tested. An online demo implements the whole s2p pipeline for one-click testing.
ACKNOWLEDGEMENTS
REFERENCES
Astrium, 2012. Pléiades Imagery User Guide version 2.0.
Baltsavias, E. and Stallmann, D., 1992. Metric information ex-traction from SPOT images and the role of polynomial mapping functions. Int. Arch. Photogramm. Rem. Sens. 29, pp. 358–364.
Christophe, E., Inglada, J. and Giros, A., 2008. Orfeo toolbox: a complete solution for mapping from high resolution satellite images. Int. Arch. Photogramm. Remote Sens. Spatial Inf. Sci 37, pp. 1263–1268.
d’Angelo, P. and Kuschk, G., 2012. Dense multi-view stereo from satellite imagery. In: IGARSS 2012, IEEE, pp. 6944–6947.
de Franchis, C., Facciolo, G. and Meinhardt-Llopis, E., 2014a. s2p online demo.❤tt♣✿✴✴❞❡✈✳✐♣♦❧✳✐♠✴⑦❝❛r❧♦✴s✷♣✴.
de Franchis, C., Meinhardt-Llopis, E., Michel, J., Morel, J.-M. and Facciolo, G., 2014b. Automatic sensor orientation refinement of Pléiades stereo images. In: IGARSS 2014, IEEE.
de Franchis, C., Meinhardt-Llopis, E., Michel, J., Morel, J.-M. and Facciolo, G., 2014c. On stereo rectification of pushbroom images. In: ICIP 2014, IEEE.
d’Angelo, P. and Reinartz, P., 2012. DSM based orientation of large stereo satellite image blocks. Int. Arch. Photogramm. Re-mote Sens. Spatial Inf. Sci 39(B1), pp. 209–214.
Farr, T. G., Rosen, P. A., Caro, E., Crippen, R., Duren, R., Hens-ley, S., Kobrick, M., Paller, M., Rodriguez, E., Roth, L. et al., 2007. The shuttle radar topography mission. Rev. Geophys.
Fraser, C. and Hanley, H., 2005. Bias-compensated RPCs for sen-sor orientation of high-resolution satellite imagery. Photogramm. Eng. Remote Sensing 71(8), pp. 909–915.
Fraser, C., Dare, P. and Yamakawa, T., 2004. Digital surface modelling from SPOT 5 HRS imagery using the affine projective model. In: XXth ISPRS Congress, Vol. XXXV, pp. 385–388.
Grodecki, J. and Dial, G., 2003. Block adjustment of high-resolution satellite images described by rational polynomials. Photogramm. Eng. Remote Sensing 69(1), pp. 59–68.
Habib, A. F., Morgan, M., Jeong, S. and Kim, K.-O., 2005. Anal-ysis of Epipolar Geometry in Linear Array Scanner Scenes. The Photogrammetric Record 20(109), pp. 27–47.
Hanley, H., Yamakawa, T. and Fraser, C., 2002. Sensor orienta-tion for high-resoluorienta-tion satellite imagery. Int. Arch. Photogramm. Remote Sens. Spatial Inf. Sci 34(1), pp. 69–75.
Hartley, R. I. and Gupta, R., 1997. Linear Pushbroom Cameras. In: IEEE Trans. Pattern Anal. Mach. Intell., pp. 963–975.
Hartley, R. I. and Zisserman, A., 2004. Multiple View Geometry in Computer Vision. Second edn, Cambridge University Press.
Hirschmüller, H., Scholten, F. and Hirzinger, G., 2005. Stereo Vision Based Reconstruction of Huge Urban Areas from an Air-borne Pushbroom Camera (HRSC). In: W. Kropatsch, R. Sablat-nig and A. Hanbury (eds), Pattern Recognition, Lecture Notes in Computer Science, Vol. 3663, Springer Berlin, pp. 58–66.
Hirschmüller, H., 2008. Stereo Processing by Semiglobal Match-ing and Mutual Information. IEEE Trans. Pattern Anal. Mach. Intell. 30(2), pp. 328–341.
IPOL, 2010. Image processing on line.❤tt♣✿✴✴✇✇✇✳✐♣♦❧✳✐♠.
Kim, T., 2000. A study on the epipolarity of linear pushbroom images. Photogramm. Eng. Remote Sensing (8), pp. 961–966.
Kuschk, G., 2013. Large scale urban reconstruction from remote sensing imagery. In: 3D-ARCH 2013 - 3D Virtual Reconstruc-tion and VisualizaReconstruc-tion of Complex Architectures, Vol. XL-5/W1, Int. Arch. Photogramm. Remote Sens. Spatial Inf. Sci.
Lee, H.-Y., Kim, T., Park, W. and Lee, H. K., 2003. Extraction of digital elevation models from satellite stereo images through stereo matching based on epipolarity and scene geometry. Image and Vision Computing 21(9), pp. 789–796.
Lowe, D. G., 2004. Distinctive image features from scale-invariant keypoints. Int. J. Comput. Vis. 60(2), pp. 91–110.
Morgan, M., Kim, K.-O., Jeong, S. and Habib, A., 2006. Epipo-lar Resampling of Space-borne Linear Array Scanner Scenes Us-ing Parallel Projection. Photogramm. Eng. Remote Sens. 72(11), pp. 1255–1263.
Oh, J., Hee Lee, W., Toth, C. K., Grejner-Brzezinska, D. A. and Lee, C., 2010. A Piecewise Approach to Epipolar Resampling of Pushbroom Satellite Images Based on RPC. Photogramm. Eng. Remote Sens. 76(12), pp. 1353–1363.
Ohta, Y. and Kanade, T., 1985. Stereo by intra- and inter-scanline search using dynamic programming. IEEE Trans. Pattern Anal. Mach. Intell. 7(2), pp. 139–154.
Okamoto, A., Akamatu, S.-I. and Hasegawa, H., 1993. Orienta-tion theory for satellite CCD line-scanner imageries of hilly ter-rains. Int. Arch. Photogramm. Remote Sens. 29, pp. 217–222.
Ono, T., 1999. Epipolar resampling of high resolution satellite imagery. Int. Arch. Photogramm. Remote Sens.
Orun, A. B. and Natarajan, K., 1994. A modified bundle ad-justment software for SPOT imagery and photography: Tradeoff. Photogramm. Eng. Remote Sensing 60(12), pp. 1431–1437.
Tao, C. and Hu, Y., 2001. A comprehensive study of the rational function model for photogrammetric processing. Photogramm. Eng. Remote Sensing 67(12), pp. 1347–1357.
Wang, M., Hu, F. and Li, J., 2011. Epipolar resampling of linear pushbroom satellite imagery by a new epipolarity model. ISPRS J. Photogramm. Remote Sens. 66(3), pp. 347–355.
Weiszfeld, E., 1937. Sur le point pour lequel la somme des dis-tances denpoints donnés est minimum. Tôhoku Math. J. 43, pp. 355–386.
Wohlfeil, J., Hirschmüller, H., Piltz, B., Börner, A. and Suppa, M., 2012. Fully automated generation of accurate digital sur-face models with sub-meter resolution from satellite imagery. Int. Arch. Photogramm. Rem. Sens. Spatial Inf. Sci 34-B3, pp. 75–80.
A THE RATIONAL POLYNOMIAL CAMERA MODEL
Each Pléiades image (Astrium, 2012) is accompanied by a pair of functions, called RPC (Baltsavias and Stallmann, 1992, Tao and Hu, 2001). These functions allow to convert from image coordi-nates to coordicoordi-nates on the globe and back. The projection from object space to image plane is denoted by RPC : R3 → R2, (ϕ, λ, h) 7→ (x, y), where 3-space points are represented by their spheroidal coordinates in the World Geodetic System (WGS 84). In that system a point of 3-space is identified by its latitude ϕ ∈ [−90,90], longitude λ ∈]−180,180]and altitudeh, in meters, above the reference ellipsoid. Its inverse, with respect to the first two components, is denoted by RPC−1 : R3 → R3, (x, y, h) 7→(ϕ, λ, h). It takes a pointx= (x, y)in the image domain together with an altitudeh, and returns the coordinates of the unique 3-space pointX= (ϕ, λ, h)whose altitude ishand whose image isx.
For the sake of clarity, we shall denote by RPCu:R
3
→R2the projection function of the RPC model associated to imageu, and by RPC−1
u :R
3 →R3
the corresponding inverse function. Ide-ally, these functions should verify RPC−u1(RPCu(ϕ, λ, h), h) = (ϕ, λ, h)and RPCu(RPC−
1
u (x, y, h)) = (x, y), but as any model the rational polynomial projection has a limited precision. In par-ticular the two RPC functions are not exact inverses of each other. The errors due to concatenating the projection and inverse func-tions are negligible, being of the order of10−7
degrees in WGS 84 coordinates, and 1
100 of pixel in the imagei.e.about 1 cm on
the ground.