CHAPTER III
RESEARCH METHODOLOGY
A. Research Method and Design
Research method and research design this study will be described in following as:
1. Research Method
Research method that is used in this study is quasi experiment. According to Creswell (2012) quasi-experiments include assignment, but not random assignment of participants to groups. This was because the experimenter cannot artificially create groups for the experiment. This research needs to use intact groups. Quasi-experiment is an experimental design which can assess the effect of interventions or treatments in research. That is related to the purpose of this study which is to investigate the effect of educational card game towards students’ mastery concept and creativity in learning excretory system.
Select Control Group Pretest No Treatment Posttest
Select Experimental Group Pretest Experimental Treatment Posttest Figure 3.1 Quasi-Experimental Design
(Creswell, 2012)
2. Research Design
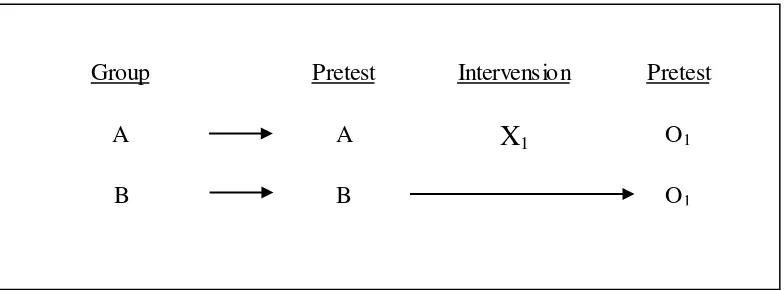
The research design used in this study is non-equivalent-groups pretest-posttest design. According to McMillan (2012), in this design there are two groups of participants (A and B). One group (A) takes the pretest (O1), receives the intervention (X1), educational card game is used as an intervention in this study, and then group A takes the posttest (O1); while the other group (B) takes the pretest, receives no intervention, and takes the posttest. In In this diagram, group A is considered as experiment group while group B is considered a
“control” group because it does not receive any type of intervention.
In this study, actually control group still receives intervention. But, the treatment of intervention is different with the treatment done in experiment group. As it has been mentioned previously, educational card is used as intervention in experiment class, while in control class there is no implementation of educational card game.
The intervention used in control class is actually almost similar with the intervention used in experiment class. While the students in experiment class are asked to make educational card and play the game afterwards, the students in control class are asked to make question-answer poster and conduct a group presentation in front of the class. Both of experiment and control class are required to write some questions related to the excretory system and answer those questions themselves. Experiment class consists of 13 students, while control class consists of 18 students. Figure 3.2 will present non-equivalent-groups pretest-posttest design:
Figure 3.2 Non-equivalen-groups Pretest-posttest Design
Figure 3.2 Non-equivalent-groups Pretest-posttest Design
(McMillan, 2012)
B. Research Location and Subject 1. Research Location
The research was conducted in Secondary School Madania, Parung, Bogor, which applied National Curriculum 2013 and Cambridge Curriculum in the learning process. The class of this school is conducted in English as instructional language.
Group A
B
Pretest A B
Intervension
X
12. Population and Sample
The population in this research were all the students on 8th grade students of secondary level. Actually in that school where this research was conducted, there were four classes on 8th grade of secondary level. But, in this study, the classes which were taken as sample were only two classes, they are 8N and 8R. Class of 8N was chosen as the experiment class, while 8R was chosen as the control class.
The sampling technique of this research is Cluster Random Sampling. Fraenkel and Wallen (2007) stated that cluster random sampling is where one obtained by using groups as the sampling unit rather than individuals.
C. Operational Definition
In order to conduct the research in accordance with the expected aims and avoid misunderstanding, operational definitions need to be elaborated as follows: 1. Educational card game
In this study, educational card is created by students with teacher’s guidance. The topic learnt by students using educational card game is excretory system. The students will use the educational card in learning activity as learning tools. The educational card is a group of two-dimensional cards which contain of pictures and brief information of excretory system that will be played by the students in order to learn excretory system. Specifically, the educational card in this study has front and back side. In front side, structured questions related to excretory system will be displayed, while the answer of the question will be displayed in the back side of the card.
2. Creativity
In this study, creativity is measured based on the products that created by the students. The product is assessed by “Creative Product Analysis Matrix” (CPAM) that considers three categories such as novelty, resolution, elaboration, and synthesis as the aspects of assessment (Munandar, 2009).
3. Conceptual Understanding
functions of excretory system, human urinary system, and kidney dialysis & kidney transplants (Cambridge Secondary 1, Science Curriculum Framework). This part has an objective to measure how effective educational card game in
assisting the students’ thinking ability to reach the cognitive level domain. In this research, conceptual understanding is measured by objective test. The objective test consists of 25 multiple choice questions. The questions of that test involve the questions from C1-C5. According to revised Bloom’s Taxonomy, the questions on that test are measured by level cognitive of remembering (C1), understanding (C2), applying (C3), and analyzing (C4), and evaluating (C5).
4. Impression
Impression in this study means the students’ impression towards the teaching
strategy, here is game-based learning by using educational card game as the media in learning excretory system. The students’ impression will be identified by using questionnaire that consists of several statements about students’ impression. This questionnaire was spread only in experiment class, since control class did not use educational card game in their learning activity.
5. Excretory system
Excretory system is chosen as the chapter that learnt in this study. The topic focuses on human excretory system which divided into three sub-chapters, namely organ structuresand functions of excretory system; Human urinary system; and kidney dialysis & kidney transplants (Cambridge Secondary 1, Science Curriculum Framework).
D. Assumption
The assumption as the foundation of this study as follow:
2. Educational card games as a learning tool could enhance the direct interpersonal interactions in learning process. The students can enhance the communication skills which occur between the student between teachers and students as well as among students.
3. Educational card game is found to be more effective than traditional teaching learning method in enhancing understanding of biological concepts. It is also a learning process which is very good as a supplemental material for reinforcing acquired knowledge and skills. Besides that, educational card game can help the students in the formation of higher conceptual abstractions.
E. Statistical Hypothesis
Hypothesis that is tested in this study are as follow.
H0 : There is no difference of students’ creativity and conceptual understanding in learning excretory system between using educational card game and question-answer poster.
H1 : There is difference of students’ creativity and conceptual understanding in learning excretory system between using educational card game and question-answer poster.
F. Research Instrument
In this research, instrument is necessary to be used for gaining data. Those instruments are described below:
1. Objective Test
The objective test is use to evaluate students’ conceptual mastery in learning
excretory system. Objective test in this study is conducted in a form of multiple
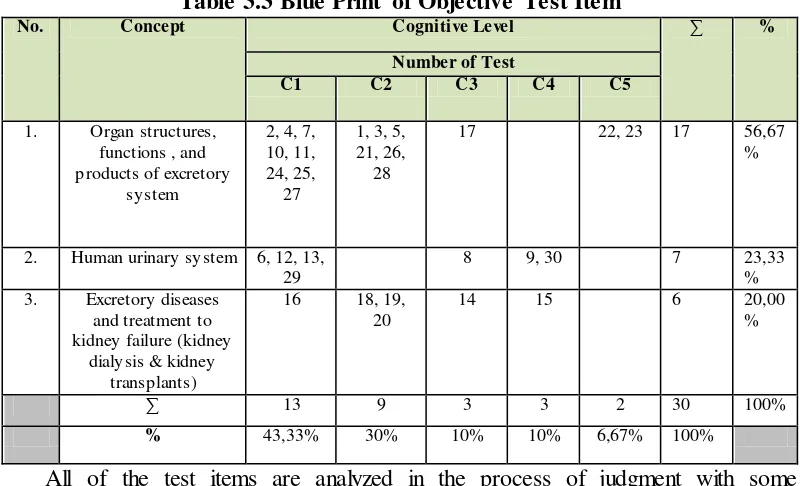
This objective test in this study aims to measure result of students’ conceptual mastery in cognitive level of remembering (C1), understanding (C2), applying (C3), analyzing (C4), and evaluating (C5). This objective test is analyzed by using ANATES version 4.9.0 statistical software. The blue print of instrument before analysis is described in Table 3.3.
Table 3.3 Blue Print of Objective Test Item
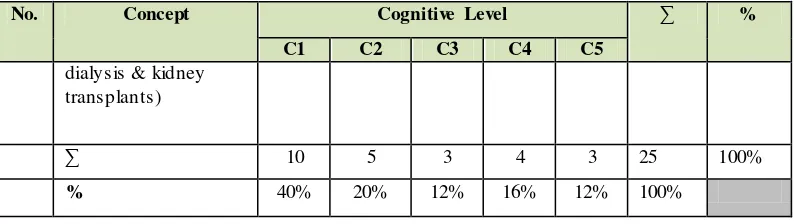
No. Concept Cognitive Level ∑ % in appendix. After conducting instrument analysis, new blueprint of objective test is gained and used as research instrument. From 30 questions that have been judged and revised, 25 questions are used. The blue print of test items after instrument analysis are shown in Table 3.4.
Table 3.4 Blue Print of Objective Test after Instrument Analysis
No. Concept Cognitive Level ∑ %
2. Creative Product Analysis Matrix (CPAM)
The students’ creativity is the qualitative data of this research. It is obtained through measurement of students’ product using Creative Product Analysis
Matrix (CPAM) rubric. The rubric will have some indicators that show the
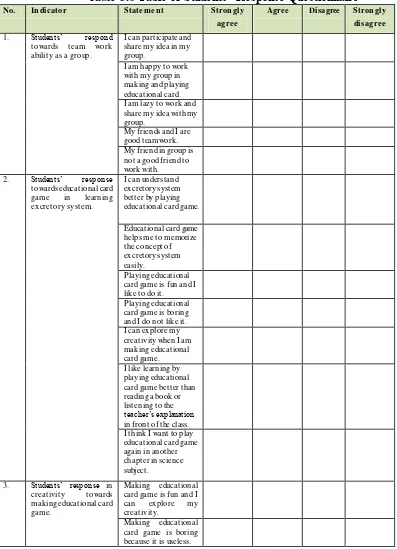
percentage of students’ creativity. The CPAM blue print is shown in Table 3.5 Table 3.5 Rubric to Measure Students’ Creativity (Blue Print)
No percentage. The percentage is interpreted using Purwanto (2008) index to determine its creativity level.
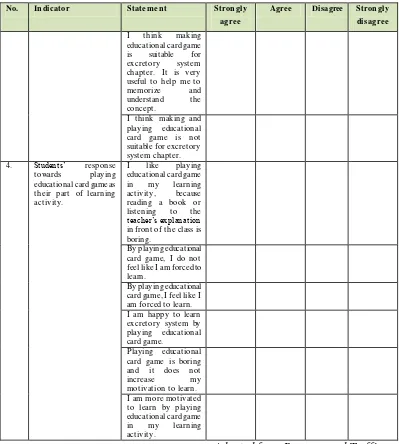
3. Questionnaire of Students’ Response
the questionnaire is giving mark on the available space which represents strongly agree, agree, disagree, and strongly disagree. The table of students’ response questionnaire is presented in Table 3.6.
No. Indicator State me nt Strongly
Table 3.7 Table of Students’ Response Questionnaire
No. Indicators Category and Number Total
1. Students’ respond towards team work ability as a
group.
Positive statement: 1, 2, 4 3
No. Indicators Category and Number Total
2. Students’ response towards educational card game in learning excretory system.
Positive Statement: 6, 7, 9, 11, 12, 13 6
Negative Statement: 8, 10 2
3. Students’ response in creativity towards making educational card game.
Positive Statement: 14, 16 2
Negative Statement: 15, 17 2
4. Students’ response towards playing educational card game as their part of learning activity
Positive Statement: 18, 19, 20, 22 4
Negative Statement: 21, 23 2
Total 23
G. Instrument Development and Instrument Analysis Result
The objective test that was used to measure students’ conceptual mastery was
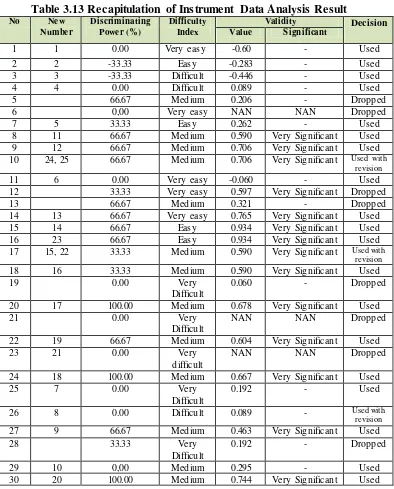
tested before it was used for pretest and posttest instrument. The instruments development started by analyzing the curriculum applied at the involved school. Afterwards, the researcher formulates the objective test to be used as an instrument of pretest and posttest. In preparation stage, conceptual mastery instrument is designed and validated to the class that has already learnt excretory system concept which is 9th grade of students in a private school in Bogor in April 2015. The objective test formulated in this research consist of 25 multiple choice questions. Analysis of instrument consisted of the discriminating power, level of difficulty, validity, and realibility.
1. Discriminating Power
power. The formula which use to analyze discriminating power based on Arikunto (2012) as follow:
Dp =
-
=P
A-P
BWhere,
D = Discriminating power JA = Amount of high achiever JB = Amount of low achiever
BA = Amount of high achiever who answers question with the right answer BB = Amount of low achiever who answers question with the right answer PA = Proportion of high achiever who answers question with the right answer PB = Proportion of low achiever who answers question with the right answer
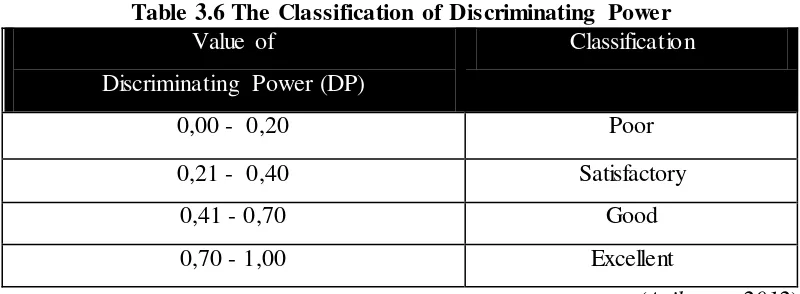
To determine whether the discrimination index is good or not, it can be checked in the Table 3.6.
Table 3.6 The Classification of Discriminating Power Value of
Discriminating Power (DP)
Classification
0,00 - 0,20 Poor
0,21 - 0,40 Satisfactory
0,41 - 0,70 Good
0,70 - 1,00 Excellent
(Arikunto, 2012) Table 3.7 presents discriminating power result from analysis test.
Tabel 3.7 Discriminating Power Result in Limited Test
No. C ate gory Fre que ncy Q ue stion Numbe r
Sum Pe rce ntage
1. Negative 2 6,67% 2, 3,
2. Poor 10 33,33% 1, 4, 6, 11, 19, 21, 23, 25, 26, 29 3. Satisfactory 5 16,67% 7, 12, 17, 18, 28 4. Good 10 33,33% 5, 8, 9, 10, 13, 14, 15, 16, 22, 27
5. Excellent 3 10% 20, 24, 30
2. Difficulty Level
Level of difficulty means level of difficulty of the student’s ability to answer questions, but it is not from the perspective of a teacher. Good questions are the question which is not too esay or too difficult to be answered (Arikuto, 2012). According to Arikunto (2012), the questions which are too easy will not stimulate the students to try harder to solve it, while too difficult questions will make students give up. The proportion of three categories based on the normal curve. It means that most of the problems are in the medium category, some are included into the category of easy and difficult with balanced proportions. The formula based on Arikunto (2012) that is used to determine the level of difficulty in the question is shown as below.
P =
Where,P = Difficulty level
B = Number of students who answer correctly N = Total number of students
The smaller index obtained, the more difficult questions. Otherwise, the greater index gained, the easier of question The difficulty index criteria is shown in Table 3.8.
Table 3.8 Difficulty Level Criteria
Value Criteria
0 – 0,30 Difficult
0,31- 0,70 Middle
0,71 - 1,00 Easy
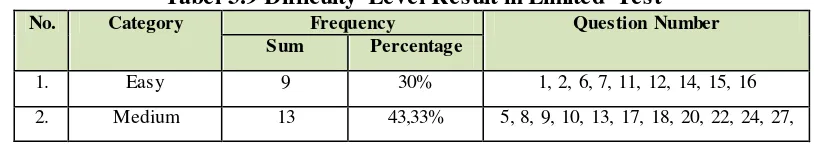
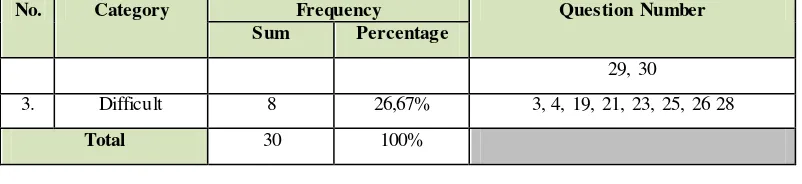
(Arikunto, 2012) The difficulty level result after analysis test is shown in Table 3.9.
Tabel 3.9 Difficulty Level Result in Limited Test
No. Category Frequency Question Number
Sum Percentage
1. Easy 9 30% 1, 2, 6, 7, 11, 12, 14, 15, 16
No. Category Frequency Question Number
Sum Percentage
29, 30
3. Difficult 8 26,67% 3, 4, 19, 21, 23, 25, 26 28
Total 30 100%
3. Validity
Scarvia B. Anderson stated that a test is valid if it measured what it purposed to measure in Encyclopedia of Educational Evaluation (Arikunto, 2003). In other word, a test can be categorized as valid if that test can measure what should be measured.
The validity test is conducted by comparing the student’s score on a test to
some external measure of the same trait that the test measures (Jacob & Chase, 1992). To determine the suitability of the instrument with the material, it is done with the product moment correlation equation as follows.
∑ [ ∑ ∑ ]
√[ ∑ ∑ ][ ∑ ∑ ]
Where,
rxy = correlation coefficient between x and y variable
x = total score in test item y = total score of student n = amount of student
Interpretation about rxy divided into different categories can be seen on Table
3.10.
Table 3.10 Validity Interpretation
C orre lation C oe ficie nt Validity C rite ria
0,80 ≤ rxy ≤ 1,00 Very high validity
0,60 ≤ rxy < 0,80 High validity
0,40 ≤ rxy < 0,60 Enough validity
0,20 ≤ rxy < 0,40 Low validity
0,00 ≤ rxy < 0,20 Very low validity rxy < 0,00 Invalid
In this study, instruments were validated by the experts. The validity test result is shown in Table 3.11.
Table 3.11 Validity Test Result
No. Category Frequency Question Number
Sum Percentage
1. Not valid 7 23,33% 1, 2, 3, 6, 11, 21, 23
2. Very Low 4 13,33% 4, 19, 26, 28
3. Low 4 13,33% 5, 7,13, 29
4. Medium 5 16,67% 8, 12, 17, 18, 27
5. High 8 26,67% 9, 10, 14, 19, 20, 22, 24, 30
6. Very high 2 6,67% 15,16
Total 30 100%
4. Reliability
Reliability test means assessment measurement which states about consistence of the measurement tools that is used (Arikunto, 2012). Arikunto (2010) stated that reliability tends to a definition about trusted instrument which is used as collecting data tools because of that instrument has already good. The technique that is used is K-R 20 and the answer that has scale which is true (1), wrong (0). The formula is explained as follow:
r11 = (
)(1-∑
)
Where,
r11 = Instrument reliability n = Amount of question
∑ = Amount of Varian score in each item = Varian total
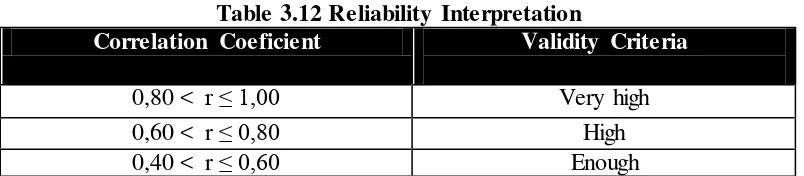
(Arikunto, 2012) The table of reliability level to interpret realibility calculation result is show in Table 3.12.
Table 3.12 Reliability Interpretation
Correlation Coeficient Validity Criteria
0,80 < r ≤ 1,00 Very high
0,60 < r ≤ 0,80 High
Correlation Coeficient Validity Criteria
0,20 < r ≤ 0,40 Low
0,00 <rxy < 0,20 Very low
(Arikunto, 2012) From the data obtained, the result of reliability test in instrument analysis test in this study is 0,78. It means that test items have high reliability. The
Reliability test: 0.78 (High degree of reliability)
Table 3.13 Recapitulation of Instrument Data Analysis Result No New
both quantitatively and supported by qualitative data. Explanation of data processing techniques are obtained as follows:
1. Test Data Analysis towards Students’ Conceptual Mastery a. Scoring of Test Item
The first step to process data is scoring the test item. The test item is provided in the 40 number of questions. All of the score is processed using Microsoft excel. b. Calculation of Gain score and N-Gain Score
Gain is calculated to know the differences between pretest score and posttest score, so that the improvement of learning can be seen. In other word, it can show the changes which happened before and after the implementation of treatment, in this study is the implementation of educational card game in learning excretory activity. After the data of the test item score is gotten, then the data is processed through gain score and normalize score.
According to Hake (1998), gain score is obtained from the differences between pretest and posttest. It is assumed as the effect of the treatment itself.
And normalized gain test itself is to determine the categories of student’s
achievement improvement. The formula below is the formula to get the gain score:
G = S
f -S
iWhere,
G = Gain score Sf = Post test score Si = Pre test score
(Hake, 1998)
The effectiveness of educational card game in increasing students’ conceptual mastery of global excretory system is seen from the result of the normalized gain that achieved by students during the learning process. For the calculation of the normalized gain value and its classification uses equations (Hake, 1998) as follows:
Where,
<g> = Normalized gain G = Actual gain
Gmax = Maximum gain possible Sf = Post test score
Si = Pre test score
Average of normalized gain (<g>) which is formulated as:
Where,
<g> = Normalized gain <G> = Actual gain
<G>max = Maximum gain possible <Sf> = Average of post-test score <Si> = Average of pretest score
(Hake, 1998)
Then, normalized gain which already obtained is categorized according to N-gain classification. The classification of N-Gain provided in Table 3.14.
Table 3.14 N-Gain score Classification Normal Gain <g> Category
<g> > 0,7 High
0,3 ≤ <g> ≤ 0,7 Medium
<g> < 0,3 Low
(Hake, 1998)
c. Normality Test
normality test uses statistic test from SPSS 18.0, Kolmogorov-Smirnov with
significancy level (α) is 0,05. When significance value > 0,05, H0 will be accepted and H0 will be rejected or denied if significance value < 0,05 (Sarwono, 2013). d. Homogenity Test
Homogenity Test is used to determine a sample from population that is originated from two classes that homogenous. Homogeneity test that is done in
this research is Test of Homogenity of Variance Levene’s test in SPSS 18.0.
Significancy level (α) is 0,05. When significancy value < 0,05, H0 will be retained and H0 will be rejected (Santoso, 2010). If two samples which are taken have homogenous variance so the difference of both means can be done by using t test. But if the test which are taken have non homogenous variance, so the difference
of both means can be done by using t’ test. The hypotheses are:
H0 : There is no difference variance between experiment and control class. H1 : There is difference variance between experiment and control class. e. Testing Hypotheses
In testing hypotheses, t test is used to determine also differentiate between average control class and experiment result. This test is tested based on the result of pretest and post-test student in experiment and control class. It can be done if the calculation of gain score has been done. The formula of t-test is described below:
√( ∑ ∑ )
(Arikunto, 2010) Where,
Mx = mean from the difference of pretest and post-test in experiment class My = mean from the difference of pretest and post-test in control class
∑X2
= the total of deviation square in experiment class
∑Y2
Moreover, SPSS 18.0 can be used in calculating the result of test hypotheses. The results of tcalculation are compared to ttable by using SPSS 18.0. Criteria of this test is when tcalculation > ttable, so H0 will be rejected. If tcalculation < ttable, so H0 will be retained (Santoso, 2010). The hypotheses of the difference of average pretest result in experiment class and control class:
H0A : there is no significant difference result of the students’ conceptual mastery between experiment and control class.
H1A : there is significant difference result of the students’ conceptual mastery between experiment and control class.
2. Data Analysis towards Students’ Creativity
The qualitative data is obtained from both creativity rubrics of final product and questionnaire. The rubrics assess the educational card in experiment class and
question-answer poster as the final product. The analysis of rubrics is conducted by converting the raw score into percentage form. Further, the result of percentage can be classified into several categories. The technique of converting score into precentage is used formula as follows:
NP =
x 100%
Where,
NP = percentage R = raw score SM = maximum score
(Purwanto, 2008)
The interpretation of score percentage of students’ creativity is categorized into certain criteria as shown in Table 3.15.
Tabel 3.15 Percentage Interpretation of Students’ Creativity
Percentage (%) Criteria
86-100 Very good
76-85 Good
60-75 Enough
55-59 Lack
<54 Very lack
100% All of them
3. Data Analysis of Students’ Impression towards the Implementation of Educational Card Game
The Likert-scale is classified into certain raw score criteria. Data processing is done by calculating the number of response of the answer and it is multiplied by the standard score of the Likert-scale, divided by the maximum score of the response answer, and the converted into percentage. The scoring guideline is shown in Table 3.16.
Table 3.16 Scoring Guideline of Students’ Response Statement Strongly
Agree
Agree Disagree Strongly Disagree
Positive Statement 4 3 2 1
Negative Statement 1 2 3 4
The percentage data will be calculated by using the following formula:
Percentages =
(Sugiono, 2011) The percentage is used to determine how many students who give response strongly agree, agree, strongly disagree, and disagree. To interpret the gained data, the average of the total score of students in every category is used. If the average of score from the result of likert-scale is more than 3, it means that the students have positive response (Nurlailiyah, 2013). But, if the average score of likert-scale is less than 3, it means that the students give negative result
I. Research Procedures
In order to make this research arranged systematically, there are three stages of procedure that had been conducted in this research, including preparation stage, implementation stage, and analysis and conclusion stage. Those stages will be explained as follow:
1. Preparation Stage
a. Formulate problem that is investigated. b. Determine focus of variable research.
c. Arrange literature review of educational card game, conceptual mastery, creativity, and excretory system.
d. Arrange the research proposal which including chapter I, chapter II, and chapter III which is presented in proposal seminar
e. Revise of research proposal after having suggestions and critics from lecturers.
f. Design teaching-learning process which will be conduct in implementation stage.
g. Report research instrument.
h. Revise instrument after having validation. i. Prepare research license.
j. Determine research subject. 2. Implementation Stage
This stage explains how this research is implemented, and the stages will be described as follow:
a. Experiment and control class determination.
b. To get initial condition of students, the same pretest is given to both experiment and control class.
c. Conduct research activity by implementing the intervention of educational card game in experiment class with following scenarios:
1) First meeting
of paper. Each group had to write minimum twenty questions. After that, the third step is answering the questions that had been asked, it means that after they had finished writing of all those questions, they were also asked to write the answer of the questions by themselves. The last step is making the educational cards. After they had finished writing all of questions and answers, they were given materials and tools to make the cards. The students had to re-write the questions and answers in the cards. An example of educational card and the rules of making the card were given and explained by the teacher.
In control class, the class began with the same first, second, and third steps as it had done in experiment class. What make the activity different in control class occurred in fourth step. When in experiment the students were asked to make educational card game, the students in control class were asked to create question-answer poster. Question-answer poster here means that they have to put the questions and answers they had written in a small card and glue them in a cardboard, which make the product looks like a poster. Example and rules also were given in control class by the teacher. The students were allowed to explore and make creations or innovation to the products. They were expected to be creative as much as they could. This meeting focused only at creating the products both in experiment and control class.
2) Second meeting
In experiment class, educational card game is played in this meeting. The rules of how to play educational card game in excretory system concept is explained as follows:
a) Time approximately ten minutes is given for the students to read both the questions and answers stated in the educational cards in order to review the concept first, before the game is started and the card is played.
b) Shuffle the educational cards and ensure the cards are all facing the same way. The front (question) side must be seen, while the back (answer) side should never be seen.
d) After reading the question, she or he has to memorize the concept which has been learnt by reviewing the concept before the game started. If that student can answer the question correctly, the she or he gets one point (score). But if she or he cannot answer the question or if the answer is not correct, and then she or he is allowed to read the answer and also tell other member the answer. When the student cannot answer the question correctly, she or he will not get a point.
e) The second until the last player has to repeat the same action like what has been explained above. The rule is exactly the same.
f) The repetition here should be done in order to help the students to memorize the concept of excretory system.
g) In the end, the point surely should be calculated. The winner in this game is the player who gets the highest point. She or he should be the one who answers at the most.
In control class, the situation is quite different. Some of students have not taken pretest and some of them also have not finished their poster. So the students were finishing their assignment first of making question-answer poster. After that, each group had to come to front of class to do group presentation. Then some students were allowed to ask some questions to the group who did the presentation in front of class and those questions had to be answered by the members of that group. For the last step was doing the posttest. So, the class ended up with taking posttest both in experiment and control class. This research was done only in two meetings.
h) Give posttest to both experiment and control class.
i) Give likert-scale to know students’ impression towards educational card game in experiment class.
3. Analysis and Conclusion Stage
This stage is the final of research procedure. There are several steps conducted in this stage. Those stages are explained as follow:
c. Arrange the report of the research. J. Research Scheme
Nisa Nur Azizah, 2015
Effect Of Educational Card Game On Students’ Creativity And Conceptual Collect Research Data
Process of Analysis Data
Result and Conclusion
Report the Result
Dropped/ Revised
Applying different treatment
Experiment Class Control Class
Making Question-Answer Poster and Do Group
Presentation Making and Playing
Educational Card Game
Literature Review (all variables)
Research Proposal
(designing instrument)
Objective Test CPAM Rubrics Questionnaire (Likert-scale)
Test and Validation
Valid Invalid
Preparation Stage
Implementation Stage