CHAPTER III
METHODOLOGY
A. Location and Subject 1. Location of Research
This research is implemented in Private Junior High School in Bandung on April 2014. The school is using National Curriculum of 2006 Kurikulum Tingkat SatuanPendidikan(KTSP)
2. Population and Sample
Population of this research is all of junior high school students‟ ability in scientific creativity and cognitive achievement. The sample of the student is one class of 7th grader. The sampling method that is carried out is convenient sampling the sampling technique based on soliciting due to the possibility of sampling availability in the field. (Hultsch, Macdonald, Hunter, Maitland, Dixon, 2002)
B. Research Method and Design 1. Research Method
2. Research Design
Considering the number of classes that is given treatment is only one class in the absence of comparable classes and control class, the research design used in this study is one group post-test design. the observations made after the treatment given is called the post-test. Hence, the research design will be the effect of a treatment in form of teaching-learning process using Numbered Heads Together (NHT), and eventually the results of the treatment will be investigated using the post-test and compare the results with the school standard score.
C. Research Instrument
The research instruments to collect the data in this research was adapted from the scienctific creativity test for secondary school as developed by Hu & Adey (2002), mastery concept test both group and individual using the cognitive domain developed by Anderson et. al (2001), unstruced questionnaire and rubrics from Sejati (2013). And It consist of:
1. Scientific creativity test, in form of scientific creativity test for secondary school students to measure students scientific creativity in learning ecosystem. 2. Mastery Concept test in a form of multiple choice question is used to measure students‟ mastery concept before and after treated byNumber Heads Together in ecosystem concept.
3. Problem based test is used to measure students cognitive and scientific creativity in a group as the implementation of stage ”heads together” as the part of the implementation of Number Heads Together.
4. Unstructured questionnare form, this instrument also used for analyzing the students‟ response towards implementation of Number Heads Together in ecosystem concept.
a) Mastery Concept Test (Pretest and Posttest)
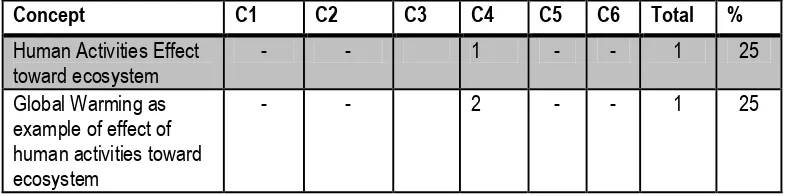
The students‟ mastery concept is the quantitative data that will be gained from this research. The data will be collected through mastery concept test in form of multiple choice consist of 20 questions. The students‟ mastery concept that will be measured is only in learning global warming. The result will be collected then analyzed using the normalized gain formula.
Table 3.1 Mastery Concept Test (Pretest and Posttest) Item Specification
Concept C1 C2 C3 C4 C5 C6 Total %
b) Mastery Concept Test (Group Test)
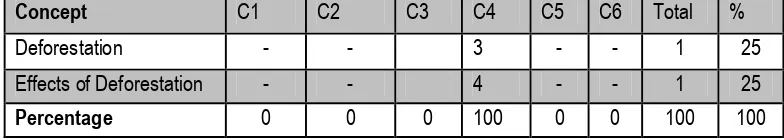
The second data on this research is the results of group test. The group test data will be gained through four modified essays questions. The answers of students‟ group will be analyzed using revised cognitive level taxonomy. The results will show the results of “heads together” stage in the number heads together.
Table 3.2 Mastery Concept Test (Group Test) Item Specification
Concept C1 C2 C3 C4 C5 C6 Total %
Deforestation - - 3 - - 1 25
Effects of Deforestation - - 4 - - 1 25
Percentage 0 0 0 100 0 0 100 100
c) Scientific Creativity
The third data of this research is students‟ scientific creativity. The data will be gained using the adaption of scientific creativity test for junior high school developed by Hu and Adey (2002). Students‟ scientific creativity will be determined using specific table of measurement. This following table below will show the result of students‟ scientific creativity based several specific indicators as shown.
Table 3.3 Scientific Creativity Test Item Specification
Indicator Number
Of Item
Percentage (%)
Unusual use of object
1 25
Sensitivity to science problem
1 25
Improvement of Technical product
1 25
Science Problem Solving
1 25
d) Questionnaire of Students‟ Responses
Table 3.4 Students‟ Response Item Specification
Indicators Category and Number
Students‟ response toward team work ability as a group
Positive statement: 1, 3 Negative statement: 2, 4 Students‟ response toward Number
Heads Together in learning Global Warming.
Positive statement: 5, 7,9,11,13 Negative statement: 6, 8,10,12,14 Students‟ response in scientific
creativity test
Positive statement: 15,17,19 Negative statement: 16,18,20 Students‟ response toward a problem
based activity in group discussion
Positive statement: 21,23 Negative statement: 22,24
e) Rubrics of Numbered Heads Together Implementation
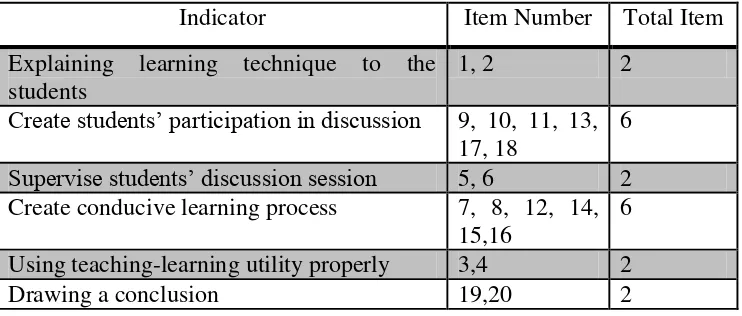
Rubrics will be used by observer to observe the implementation process of Numbered Heads Together in learning process from both teacher and students point of view. The data obtained from the rubricis a secondary instrument, and it is processed by a percentage calculation. The rubric will include some indicators such as explained in Table 3.5
Table 3.5 Teacher‟s Numbered Heads Together Implementation Rubric
Indicator Item Number Total Item
Explaining learning technique to the students
1, 2 2
Create students‟ participation in discussion 9, 10, 11, 13, 17, 18
6 Supervise students‟ discussion session 5, 6 2 Create conducive learning process 7, 8, 12, 14,
15,16
6
Using teaching-learning utility properly 3,4 2
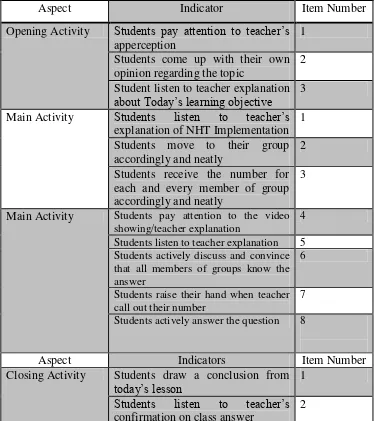
Table 3.6 Students‟ Numbered Heads Together Implementation Rubric
Aspect Indicator Item Number
Opening Activity Students pay attention to teacher‟s apperception
1
Students come up with their own opinion regarding the topic
2
Student listen to teacher explanation about Today‟s learning objective 3 Main Activity Students listen to teacher‟s
explanation of NHT Implementation
Students listen to teacher explanation 5 Students actively discuss and convince that all members of groups know the
Students actively answer the question 8
Aspect Indicators Item Number
Closing Activity Students draw a conclusion from
today‟s lesson 1
Students listen to teacher‟s confirmation on class answer
2
D. Data Processing
1. Quantitative Data Processing
The quantitative data processing is done using Microsoft Excel for pre-test score data and post-test. The value of quantitative data will be gained by the result of normalized gain. The process of calculating data will be explained as follow: a) Data of Test Score
In this research, the data of test scores is used to measure the improvement of students‟ achievement and problem solving skill. The data processing, have been carried out in the following way:
(1) Score of Scientific Creativity Test
The test consists of four essay question that was related with the topic of the learning. The scoring procedure as follows
Table 3.7 Scoring Procedure of Scientific Creativity Test
Indicator Fluency Flexibility
Originality
Total Frequency of the Answers
<5% 5%-10% >10% Unusual use of
object
Sensitivity to science problem Improvement of Technical product Percentage
Table 3.8 Scoring Procedure of Scientific Creativity Test
Indicator
Frequency of The Answer
<5% 5%-10% >10%
3 Point 2 Point 1 Point Science Problem Solving
Total
Students Scientific Imaginationare. Counting all of the separate responses given by the subjects, regardless of the quality is how to obtain the fluency score is obtained simply. Counting the number of approaches or areas used in the answer is how to obtain flexibility score for each task. The originality score is developed from a tabulation of the frequency of all of the responses obtained.Frequencies and percentages of each response are computed. If the probability of a response is less than 5%, we give it 2 points; if the probability is between 5 to 10%, we give it 1 point; if the probability of a response is more than 10%, we give it 0 points. The score of science problem skill is computed again by tabulating all answers of all subjects, and then rating a particular answer for its rarity value. If the probability is less than 5%, it gets 3 points; for probabilities from 5 to 10, it gets 2 points; If the probability is greater than 10, it gets 1 point. We only have one score for each method of division (Hu and Adey, 2002).
(2) Score of Test Item
The tests used in this research are paper and pencil tests consist of 20test items. Each multiple choice correct answers are given 1 score and each incorrect answer was given a score of 0
b) Calculation of Gain Score and Normalized Gain
The difference of pretest score andpost-test score is a way to obtain a gain score (actual gain). The effect of the treatment is assuming fromthe difference in pretest scores and the post-test. “Normalized gain calculations are intended to determine the categories of students‟ achievement improvement.gis the single-student normalized gain, defined as:” (Hake, 2002)
g = (%posttest
–
%pretest) / (100
–
%pretest)
The effectiveness of Numbered Heads Together model in increasing students‟ scientific creativity and mastery concept in learning global warming will be seen from the result of the normalized gain that achieved by students during the learning process. The calculation of the normalized gain value and its classification will use these following equations (Hake, 1999):
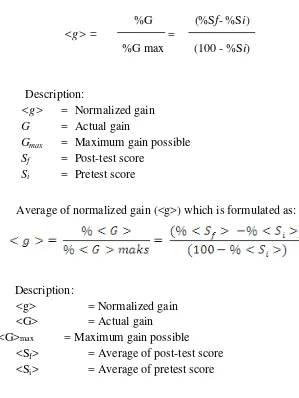
Normalized gain of each student <g> defined as following formula:
Description:
<g> = Normalized gain G = Actual gain
Gmax = Maximum gain possible Sf = Post-test score
Si = Pretest score
Average of normalized gain (<g>) which is formulated as:
Description:
<g> = Normalized gain <G> = Actual gain
<G>max = Maximum gain possible
<Sf> = Average of post-test score <Si> = Average of pretest score
Table 3.9 Interpretation of Normalized Gain Value
%G (%Sf- %Si)
<g> = =
Value g Classification
g 0,7 High
0,7 >g 0,3 Medium
g< 0,3 Low
(Hake, 1999)
c) Normality and Homogeneity test
Using of parametric statistic has a deal with assumption that each variable in this research that will be analyzed form a normal distribution. If, the data is abnormal, the homogeneity variant test cannot be done or the parametric technique cannot be used. Meanwhile if the data is normal and homogen, the parametric technique can be used. Normality test is to know whether the sample comes from population that has normal distribution or not. In this research, Normality test uses statistic test from SPSS 20, Kolmogorov-Smirnov with significancy level (α) is 0,05. When significance value > 0,05, H0 will be accepted and H0 will be rejected or denied if significance value < 0,05 The hypotheses are:
H0 : Sample comes from population that has normal distribution. H1: Sample comes from population that has not normal distribution.
The homogeneity test is also uses statistic test from SPSS 20, with significance level (α) is 0,05. When significance value ≥0,05, the data is considered as homogeny (Sarwono, 2012).
(1) One Sample T-test
the similarity means is used two-tailes hypotheses, the hypotheses is determined as bellow:
H0 : Students‟ mastery concept score in learning global warming concept has achieved the school standard of 75 .
H1: Students‟ mastery concept score in learning global warming concept less than school standard (<75)
2. Qualitative Data Analysis
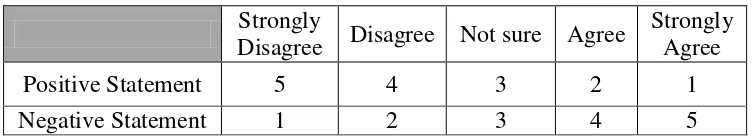
The qualitative data obtained from unstructured questionnaire, group discussion results and rubric of implementation of Numbered Heads Together.Processing is done by calculating Likert scale will be calculated into score and then converted into percentage, the percentage of answers observer to then be evaluated for the next lesson. The scoring guideline will be shown in table 3.10:
Table 3.10 Scoring Guideline of Students‟ Response Strongly
Disagree Disagree Not sure Agree
Strongly Agree
Positive Statement 5 4 3 2 1
Negative Statement 1 2 3 4 5
The percentage data will be gained by calculating through the following formula: P = x 100%
Explanation : P : Percentage
f : score from frequency of the answer n : score from total response
The conversion of raw score into percentage is conducted to analyze the rubrics. Further, the result of percentage can be classified into several categories. The technique of converting score into percentage is using formula written (Sejati, 2013):
Score = � � �
�� � � � � x 100%
E.Instrument Development
Thedevelopment process of instrument begins with of the curriculumanalysis that is applied inschool. The researcher then formulates the questions to be used as an instrument of pretest and post-test. The tests used in this research are writing tests consist of 20 multiple choice questions and four essay questions.
The instrument needs to be consulted (judgment) by the concerned lecturer and some experts in related fields. After being judged, the instrument which is not appropriate enough should be revised. After the instrument revised, it should be tried out on another class which had learned the topic before. Based on the test results, the instrument questions will be analyzed with the following requirements:
1. Instrument Test Requirements a. Validity
The researcher use the Coefficient of Product Moment Karl Pearson to measure the validity of each test item, there is:
= � −
� 2− 2 � 2 − 2
(Sejati, 2013)
With, : correlation coefficient between x and y variable n : amount of student
x : total score in test item y : total score of student
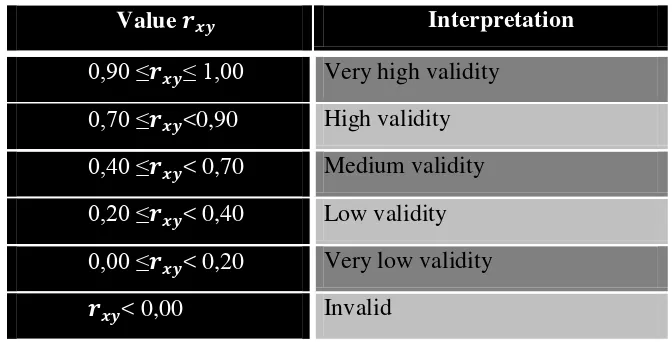
Interpretation about will be divided into different categories based on Guilford quoted by Arikunto (2010) cited by Sejati (2013).
Table 3.11 Classification validity coefficient Value � Interpretation
0,90 ≤� ≤ 1,00 Very high validity
0,70 ≤� <0,90 High validity
0,40 ≤� < 0,70 Medium validity
0,20 ≤� < 0,40 Low validity
0,00 ≤� < 0,20 Very low validity � < 0,00 Invalid
b. Reliability
eventually leads to other characteristics such as predictable and accurate and eventually conclude to be reliable. In another word reliability can be described that the test will resulted the similar results even it is done by different people, times and places. Hence, it can be concluded that the more reliable the research instrument are influenced by greater degree of consistency and stability. Arikunto, (2006) quoted by Sejati (2013).
The value of reliability is determined based on coefficient value which is gained by Alpha formula, as follows:
11
Arikunto(2006) quoted by Sejati (2013)
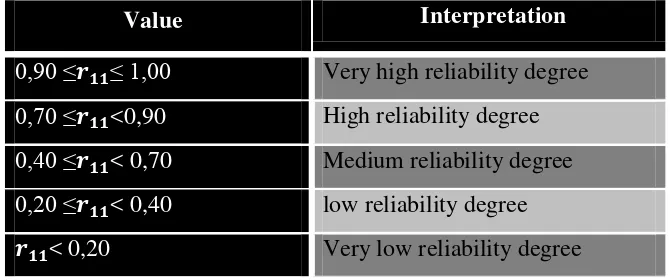
Table 3.12 Classification of Reliability Coefficient Value r11 Interpretation
0,90 ≤� ≤ 1,00 Very high reliability degree
0,70 ≤� <0,90 High reliability degree
0,40 ≤� < 0,70 Medium reliability degree
0,20 ≤� < 0,40 low reliability degree � < 0,20 Very low reliability degree
Explanation:
11
r : reliability coefficient
2
i
s : score variant each test item n : amount of test item
2 ∶
c. Discriminating Power
Another important procedure in item analysis is calculating the item discrimination power (DP) which can be defined an item test discriminates between high achiever students with low achiever students. Arikunto(2006) quoted by Sejati,(2013).Hence, to obtain the discrimination power of the items, the following formula has been used:
T
RL
RU
DP
2 1
Explanation:
DP = Discriminatory power.
RU = The number of tests in the upper group who got the item right. RL = The number of tests in the lower group who got the item right. T = The total of tests included in item analysis.
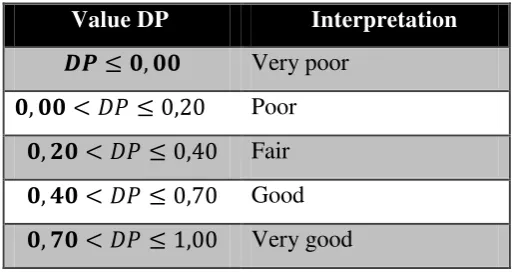
Classification of discriminating power interpretation Arikunto (2006) quoted by Sejati (2013): Table 3.13 Discriminating Power Classification
d. Difficulty Level
After scoring the test papers, the researcher has arranged the scored test in order of scores, from the highest to the lowest score. The researcher, then, separated two subgroups of test papers; an upper group consisting of the top (27%) of the total group who received the highest scores, and a
Value DP Interpretation
�� ≤ , Very poor
lower group including an equal number of papers (27%) who received the lowest scores. The researcher also counted the number of times each response to each item is chosen correctly on the papers of the upper group and does the same separately for the papers of the lower group. In doing so, she intended to calculate the difficultylevel (henceforth DL) or (facility value) of each item.It means as Gronlund (1976) cited by Sejati (2013), revealed that “the percentage of students who got the item right”; so, in order to find out the level of difficulty for each item in the test, the following formula has been used:
Sample the of Number
Total
LC HC
DL
Where:
DL = Difficulty level HC = High correct LC = Low correct
Madsen (1983) quoted by Sejati, (2013)
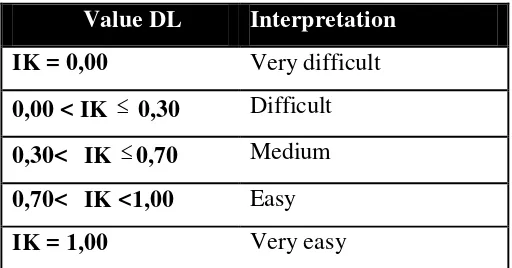
Classification of difficulty level in each test item that used is based on Arikunto, (2010)
Table 3.14 Coefficient classification of difficulty level
Value DL Interpretation
IK = 0,00 Very difficult
0,00 < IK 0,30 Difficult 0,30< IK 0,70 Medium 0,70< IK <1,00 Easy
e. Readability
Readability will be used to analyze essay questions. Readability has two common meanings, one applying to document design, the other to language. Readability as it is applied to document design is concerned with such matters as line length, leading, white space, font type and the like Marnell(2009) quoted by Sejati (2013).
F. Instrument Analysis Result
1) Recapitulation of Students’ Mastery Concept Instrument
The instrument for measuring students‟ cognitive achievement is by giving an objective test in a form of 37 questions. The instrument should be tested in terms of validity, reliability, discriminating power, and difficulty level as explained before. The test was given to 26 students which have learned about the chapter that will be learned for the research. The recapitulation of test item analysis is shown in the following table.
Test item recapitulation:
Reliability test : 0.60 (Medium degree)
Table 3.15 Recapitulation of test item for students‟ mastery concept
Question Number
New Number
Discriminating Power
Validity Difficulty Level Status
1 - Rejected Very Low Rejected Rejected 2 - Rejected Very Low Rejected Rejected
3 - Rejected Invalid Revised Rejected
4 1 Revised Low Accepted Revised
5 - Rejected Very Low Rejected Rejected
6 2 Accepted Low Revised Revised
7 - Revised Very Low Rejected Revised
8 - Rejected Invalid Rejected Rejected
Question
Validity Difficulty Level Status
10 - Rejected Invalid Rejected Rejected
2) Recapitulation of Students’ Scientific Creativity Instrument
about the chapter that will be learned for the research. The recapitulation of test item analysis is shown in the following table.
Essay test recapitulation:
Reliability : 0.76 (High degree)
Table 3.16 Recapitulation of test item for students‟ scientific creativity
No Discriminating Power Validity Difficulty Level
Status
D Notes Rxy Notes P Notes
1 28.57 Revised 0.434 Revised 33.93 Accepted Accepted 2 68.37 Accepted 0.896 Accepted 45.41 Accepted Accepted 3 60.44 Accepted 0.786 Accepted 41.21 Accepted Accepted 4 40.44 Accepted 0.814 Accepted 30.82 Accepted Accepted
2. Instrument Non-Test Requirements
a. Rubrics
The rubrics will be used to observe the implementation of teacher‟s in numbered heads together and students activity during the implementation, the rubrics will be fulfilled both by the observer and the students
b. Questionnaire
G. Research Procedures
In order to arrange the sequence of research systematically, the procedure of research is arranged based on the stage of numbered heads together implementation. There are three stages of procedure consists ofpreparation stage, implementation stage,and analysis and conclusion stage. Those three stages will be explained as follows:
1. Preparation stage
In this stage, the researcher conduct several steps that support the research, there are:
a. Formulate problem that will be investigated b. Determine the focus of variable research
c. Conduct literature review of project-based learning, learning achievement, problem solving skill, and curriculum
d. Arrange the research proposal which is presented in proposal seminar
e. Revised of research proposal after having suggestions and critics from lecturers.
f. Arrange the research instrument and being judged by expert or lecturer. g. Revised of research instrument after having suggestions.
h. Try out of research instrument
i. Revised of research instrument based on instrument try out analysis result
2. Implementation Stage
This stage explain the step of research implementation, it consists of: a. Determination of experimental class
b. Give pretest to the sample class to recognize the initial condition of students.
d. Conduct research activity by implementing NHT in experimental class with following scenarios:
i. First Session
In this first session the implementation of numbered heads learning together teacher is grouping the students consist of 5 persons based on their achievement in pre-test that conducted before. After that teacher distribute the carton and some pictures that will be used as the tool in “head together” stage. After that teacher plays the video that will be used as the material in “heads together” stage. Having finished with the video, teacher gives three questions regarding the mastery concept of global warming with sub concepts: 1. Please exemplify each of them three examples of activity that can influenced positively and negatively to the ecosystem; 2. What is the effect to the environment if those negative activity continue happen? ; 3. What will happen to environment if the condition has changed? Those question then answered by the students „group by attaching the picture on the carton so that they can answer the questions using the arrangement of the pictures that they produce trough the discussion among them.
ii. Second Session
The second session more or less has the same scenario as the first one. Using the same students‟ group, teacher shows different video with different content that will be used as a source of discussion, after that teacher ask students to put their heads together again with two different questions there are:
After that students do the arrangement of pictures so it can help them to answer the questions. Having finished with the “heads together” session, teacher then ask students with their number to present their work to the class. The first number is ask voluntary and after that the numbers is rolling among the group, so that students will have discussion among the group.
Along the session observers are observing the implementation of teacher in numbered heads together, students activity during the learning process. As well as among students they will have peer scoring among their friends during the implementation of the model. e. Give post-test in the sample class to recognize the improvement of
students‟ mastery concept in the sample class.
f. Give questionnaire to know the student‟s response towards implementation of numbered heads together in the whole learning.
3. Analysis and Conclusion Stages
This is the final stage of research design, the step that will be conducted in this stage will be explained as the following steps:
a. Analyze the result of the whole research from based on the instrument result. b. Discuss and conclude for the data analysis result.
H. Research Plot
Analysis of KTSP Curriculum
Literature Review (all variables)
Questionnaire Rubrics Pretest/
Pot-test
Test and Validation
Valid Invalid
Revised
Research Implementation: Numbered Heads Together in learning global warming
Collect research data
Process and analyze data
Result and conclusion
Implementation Stage
Analysis and Conclusion Stage
Figure 3.1 Diagram of Research Plot
Research Proposal
(Designing Instrument)
Report the result