CHAPTER III
METHODOLOGY
A. Research Method and Design
1. Research method
The reasearch method which was applied in this research was
experimental research. In experimental research, the reserachers look at the
effect of least one independendent variable on one or more dependent
variable (Fraenkel et al., 2009). The type of experimental research that is
used in this study is weak experimental design, “weak” here means that
there is no control for threats to internal validity. The dependent variable in
this research are cognitive achievement and creativity, while the
independent variable is learning style. According to the Frankael et al
(2009) state that experimental study is the best type to testing hypothesis.
That statement as one consideration of using this method is to testing
hypothesis whether learning style has an impact in cognitive achievement
or not.
2. Research design
Type of weak experimental design that is used in this research is
one-group Pretest-Posttest Design. In this research design, a single one-group is
measured or observed not only after being exposed to treatment of some sort
but also before (Frankael et al., 2009). A table of this design is as follows:
Tabel 3.1 The One Group Pretest-Posttest Design
O X O
Pretest Treatment Posttest
B. Research Location and Subject
This research was held in one of Boarding School in Subang which is
use KTSP curriculum in teaching-learning process. The data collection was
done in July 2014.
2. Subject
Population of this research is all of student’s ability in concept mastery
and creativity that belongs to all 8 (eight) grade in the middle school. The
sample of this research is one class of students’ ability in concept
comprehension and creativity on optic instrument. The simple random
sampling is used as sampling technique. Simple random sampling is one of
the population has an equal and independent chance of being selected
(Frankel et.al., 2011)
C. Operational Definition
In order to conduct the research in accordance with the expected aims
and avoid misunderstanding, therefore an operational definition need to be
describe as follows:
1. Learning Style is a student’s preference of how student catch, organize
and then processed the information by their sensory (visual, aural,
read/write, and kinesthetics) based on Fleming. Student were given a
learning style questionnaire that was developed by Fleming, then
student were grouped based on their prefference learning style.
2. Cognitive Achievement is a student cognitive accomplishment which is
taken by pre and post test. The learning achievement that conduct in
this research is achieved by cognitive aspect from revised taxonomy
Bloom by Anderson (2011) which covers C1 until C4 in learning optics
instrument.
3. Creativity is a product of creative thinking from group or individual
perceive and create new combinations. Students’ creativity is assesed
creativity based on Munandar. There are Fluently, Flexibility,
Originality, and Elaboration. Optic instrument is a topic that is chosen
to make a product. Class will divided into several group based on their
learning style.
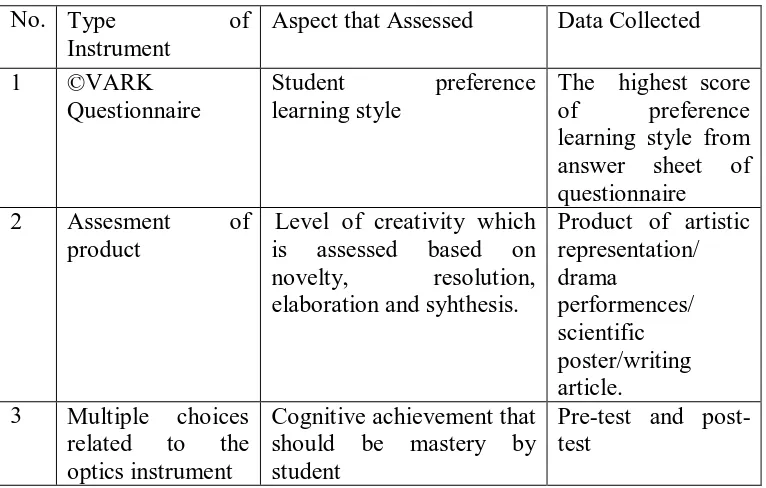
D. Research Instrument
Research instrumen is a tool that is used to collect research data.
Instrumen used in this research are, rubric for creativity product (Scientific
Poster, Artistic Representation, writen article, and drama presentation) and
multiple choice related to the creativity product made by students.
The instruments used in this research are illustrated in table, as follows:
Table 3.2 Instrument Research Used
No. Type of
Instrument
Aspect that Assessed Data Collected
1 ©VARK
Pre test were conducted in the beginning of learning. It was intended
to know the students; prior knowledge toward optics intrument concept. In
this pre test consist of 20 multiple-choice questions. Those questions only
be conducted in this research is about cognitive aspect; there were C1
(remembering), C2 (understanding), C3 (applying), C4 (analyzing)
according to Revised Taxonomy Bloom.
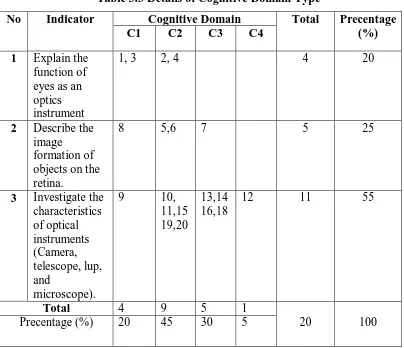
Table 3.3 Details of Cognitive Domain Type
No Indicator Cognitive Domain Total Precentage
(%)
Posttest was conducted at the end of learning. All questions were same
with pre test questions. Post tes was given intention of knowing the
development of student cognitive achievement towards optics instrument
concept.
Assesment rubric was used to asses the creativity based on the product
that has been made by student. Rubric was made by adapted the existing
rubric and developed subsequently based on the needed and objective of the
research. Level of students’ creativity classified into categories, very high,
high, medium, low, and very low. As illustrated table below :
Table 3.4 blueprint of Student Creativity Product
No. Indicator of
1 Fluency Graphics Theme Performances Variation of
material
2 Flexibility Elements Elements Elements Elements
3 Originality Attractiveness Attractiveness Attractiveness Attractiveness 4 Elaboration Answering
problem a with
There are 4 types of rubric scale of product. First, rubric scale product of
poster, presentation, writting scenario, and last, rubric scale product for artistic
representation.
E. Instruments Development
The instruments that would be judged consist of questions of pretest
and postest, the rubric sclae of product, rubric scale of creativity. The whole
instruments were judged by 3 experts. Two of them are lectures of
university and one of them is the official scence teachers of SMP Al-Azhar
Syifa Budi Parahyangan.
Number of quetions that was related to the concept were tested to find
out the feasibility as an instrument of the research. Form of product
assesment onl tested and validated by teacher or lecturer. While for
student. Further analysisi were needed to find out good or bad some test,
covers validity, realibility, discriminating power, level of difficulty, and
distractor by using dsoftware Anates ver.4.
1. Validity
The validity test is used to measure the validity of item test that will be
used to measure students concept comprehension. Based on Arikunto,
validity test is a measurement that confirm the instrument whether it is valid
or not and can measure that will be measured (Arikunto, 2010).
Because of that, the validity test was implemented by compared the
content of the subject matter which is students taught. To determine the
appropriateness of the instrument with the material, it was done with the
product moment correlation formula are given:
Where,
rxy = items correlation coefficient.
X = items scores
N = amount of subject
(Arikunto, 2010)
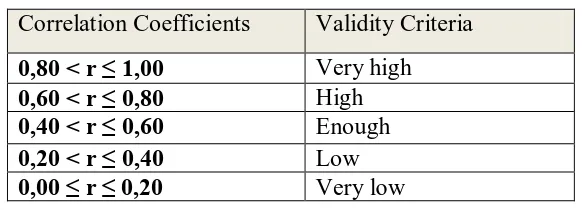
The table of interpretation of validity criteria compare to the result, are
given:
Table 3.5 Validity Interpretation
Correlation Coefficients Validity Criteria
0,80 < r ≤ 1,00 Very high
0,60 < r ≤ 0,80 High
0,40 < r ≤ 0,60 Enough
0,20 < r ≤ 0,40 Low
0,00 ≤ r ≤ 0,20 Very low
(Arikunto, 2010) ∑ [ ∑ ∑ ]
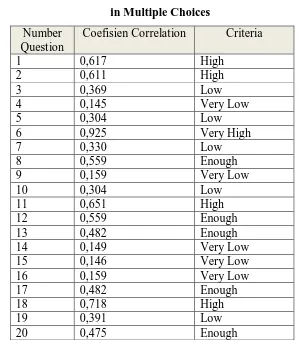
Based on the criteria above, the item test are validated and classify it
whether it belongs to very high, high, enough, low and very low. According
to the calculation by using Anates ver.4 it was obtained 20 question of
multiple choices which have criteria very high, high, enough , low, and very
low. that will be used as a instrument
Table. 3.6 Recapitulation of Validity Testing
in Multiple Choices
Reliability is used to measure the consistency of instrument to measure
that was used. Based on Arikunto (2010) reliability tends to tool that is used
to data collection instrument whether it has been good or yet. The formula
could be used to answer which has the scales dichotomy as such true (1),
false ()). Split-half method formula given:
r11 = (
)(1-∑
)
Where,
r11 = Instrument reliability
n = Amount of question
∑ = Amount of Varian score in each item = Varian total
(Arikunto,2010)
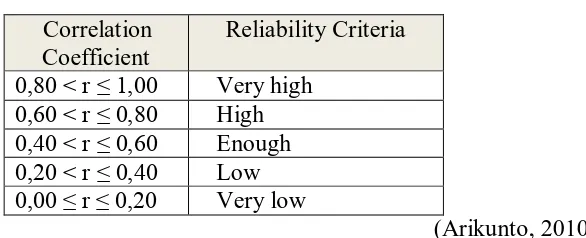
The instrument can be called reliable if the reliability coefficient
(R11)> 0.6, or can be compared with r table (product moment). The table to
interpret reliability is given:
Table 3.7 Reliability Interpretation
Correlation Coefficient
Reliability Criteria
0,80 < r ≤ 1,00 Very high
0,60 < r ≤ 0,80 High
0,40 < r ≤ 0,60 Enough
0,20 < r ≤ 0,40 Low
0,00 ≤ r ≤ 0,20 Very low
(Arikunto, 2010)
Based on the calculation by using software Anates ver.4, the reliabiity
of the test was 0,62. Hence , it can be conclude that the test have a high
criteria . means that the test was acceptable.
The discriminating power is used to measure whether the student
belongs to higher or lower achiever category through item test. the
question or problem which have a good discrimination power will have
higher result , so if it is given to the high achiever student rather than it
is given to the low achiever student (Arikunto, 2010). Means that the
problem can be determine which student belongs to. The formula that is
use to discriminating power of an item test are given:
Where,
D = Discriminating power
JA = Amount of high achiever
JB = Amount of low achiever
BA = Amount of high achiever who answers question with the
right answer
BB = Amount of low achiever who answers question with the right
answer
PA = Proportion of high achiever who answers question with the
right answer
PB = Proportion of low achiever who answers question with the
right answer
(Arikunto, 2012)
To classify it then the criteria are given below:
Table 3.8 Classification of Discriminating Power
Discriminating Power Classification
0,00 – 0,20 Poor
0,21 – 0,40 Satisfactory
0,41 – 0,70 Good
0,71 – 1,00 Excellent
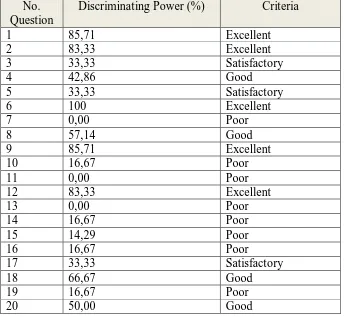
Based on the calculation was done by software anatest ver.4. the
analysis of the discrimination power was obtained and criteria were given
based on the table 3.8. as follows:
Table 3.9 The Classification Result of Discriminating Power
No. Question
Discriminating Power (%) Criteria
1 85,71 Excellent
17 33,33 Satisfactory
18 66,67 Good
19 16,67 Poor
20 50,00 Good
Generally, question was good enough to use as instrument. But for a
few question that belongs to poor criteria are revised, so it can be used.
4. Level of Difficulty
The good item test it should be not too easy or difficult of item test,
but it should be balance. Students’ capability in answered difficult
question is not determine by teacher perspective, but there are some
requirements that should be consider determining the difficulty level of
easy, medium and difficult of item test should be same. The second is the
B = Number of students who answer correctly
N= Total number of students
(Arikunto, 2010)
Table of each criteria are given as below:
Table 3.10 Difficulty Level
Index of Difficulty Level Criteria
0 – 0,29 Difficult
0,30- 0,69 Middle
0,70 - 1,00 Easy
(Arikunto, 2010)
Based on the calculation was done by software anatest ver.4. the
analysis of the discrimination power was obtained and criteria are given
based on the Table 3.10. as follows:
Table 3.11 Result of Difficulty Level
No. Question
Index Level of Difficulty Criteria
No. Question
Index Level of Difficulty Criteria
10 95,24 Easy
11 28,00 Difficult
12 61,90 Middle
13 84,00 Easy
14 95,24 Easy
15 52,00 Middle
16 92,00 Easy
17 52,00 Middle
18 71,43 Easy
19 95,24 Easy
20 76,19 Middle
F. Technique Data Collection and Analysis
Data was collected using creativity rubric scoring for product, pretest
and posttest that covers concept of optics instrument. Each data processed
and analyzed by following way:
1. Data Processed and Analyzed of Creative Product
Data collected using rubric scale. Furthermore data is processed by
calculating each score then convert to the form scale value from 1 – 100
Where,
NP = value look for (%)
R = Raw score obtained by students
SM = Maximum ideal score
100 = Fixed number
(Purwanto, 2008)
To determine level of students’ creativity, obtained value is interprated
in percentage form. Based on Purwanto (2008), the precentage value result
can be grouped into crirtia such as very high, high, medium, low, and very
Table 3. 12 Category of Creativity Level based on Product
Value (%) Criteria
86 – 100 Very High
76 – 85 High
60 – 75 Medium
55 – 59 Low
≤ 54 Very Low
2. Data Processing and Analysis of Pretes and PostTest
Data was collected from pretest and post was obtained from student,
which covered material about optics instrumen then being rocessed by
calculating score of students’ pretest and posttest that formed in multiple
choice. Each correct answer was given a score one, while a wrong answer
was given a score zero. Then, to find out final score with scale 100 from
multiple choice done by using formulation, as given:
Where,
SS = Score obtained by student
SM = Maximum Score
FS = Final Score
After getting the final score, pretest and posttest being analyzed for the
effectiveness of their instruction by finding the value of N-Gain. The value
of N-gain were categorized as high, medium and low. As follows :
a. Average Normalized Gain
in obtaining the average normalized gain score in this research was
done by ©Microsoft Office Excel 2007. Average normalized gain is a
method to assess the effectiveness of instruction. The average normalized
gain is commonly used to assess students’ performence in pre- and post-test. the average or normalized could be calculated by using average scores of
different product. The properties of two result were explored for several
ideallized situations. The results indicated that it might be able to utilize the
the difference between the two results to extract information about how
population may have changed as a result of instruction. Average normalized
gain (g) describe as the ratio of the average improvement in
participantscores from pre-test to the post-test rescpectly to the maximum
possible improvement. G can be calculated, as follows :
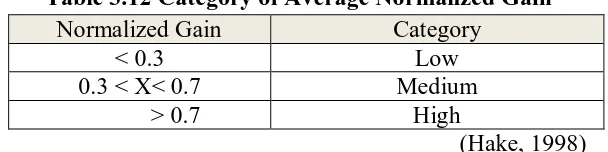
Hake (1998) noted that the normalized gain has a significant
measurement of how well a course though topics of physics to students.
Hake regarded normalized gain in the category of high, medium and low.
As illustrated in table below :
Table 3.12 Category of Average Normalized Gain
Normalized Gain Category
< 0.3 Low
0.3 < X< 0.7 Medium
> 0.7 High
(Hake, 1998)
3. Research Scheme
Research scheme is a view of how the research is conducted. Starting
from the preparation stage, following by implementation stage until a
conclusion is made based on the formulation issued raised. Detailed the plot
Figure 3.2 Research Scheme
Test of reliability, discrimination power, and difficulty level of instrument (Cognitive Test)
Pre-test & VARK Questionnaire
Post-test
Analyzing data
Conclusion
Material given and make a project Designing lesson plan
Literature study of Learning style creativity, cognitive achievement, and
optics concept Preliminary study/need analysis
Analyzing science content standard of secondary school
Analyzing Indicator of students creativity, product and optics instrument concept
Making research instrument (pretest, post test and rubric)
Instrument validation Revision
Experts
Students