Eka Kartika Damayanti, 2014
SCIENTIFIC INQUIRY SKILLS IMPROVEMENT OF JUNIOR HIGH SCHOOL STUDENTS
Universitas Pendidikan Indonesia | repository.upi.edu | perpustakaan.upi.edu
CHAPTER III
METHODOLOGY
A. Research Method and Research Design
1. Research Method
Large number of students was involved in this research, so it met the requirements to be said as quantitative research. No treatment was given during data collection. A set of instrument was used to measure scientific inquiry skills improvement of junior high school students. Shortly, quantitative descriptive method (Creswell, 2011; Gay et al., 2009) has been administered in this research.
2. Research Design
It used survey research design, which is a procedure in quantitative research in which investigators administer a survey to a sample or to the entire population of people to describe the attitudes, opinions, behaviors, or characteristics of the population (Creswell, 2011:377).
As explained in Creswell (2011), the type of survey design that has been used here was cross-sectional survey design, where 3 groups of junior high school students consist of 7th grader, 8th grader, and 9th grader will be compared. Inferential statistics is needed to draw an inference about condition that exist in a population from study of a sample drawn from the population (Minium, 1993: 3).
B. Population and Sample
Eka Kartika Damayanti, 2014
SCIENTIFIC INQUIRY SKILLS IMPROVEMENT OF JUNIOR HIGH SCHOOL STUDENTS
Universitas Pendidikan Indonesia | repository.upi.edu | perpustakaan.upi.edu
Bogor. School A was implementing KTSP while school B is implementing Cambridge IGCSE curriculum.
Population covered by this research is all students of those schools, from grade 7 until 9, while the samples are representatives of each grade from each school.
Random sampling technique was conducted. According to the information given by teachers in each school, the distribution of high and low achievers are even in each class (there were no high achiever nor low achiever class). This homogenous distribution makes the researcher much easier to take the sample.
Here is the amount of sample taken to represent the population in this research.
Table 3.1 - Sample Amount Involved in Data Collection
C. Operational Definition
Some terms that are often used in this research will be explained as below.
1. Scientific inquiry refers to the way of how people develop their knowledge or solving problems through empirical ways.
2. Scientific inquiry skills refer to people ability to develop their knowledge or solving problems through empirical ways, which described in several
Grade School Total
A B
7 50 34 84
8 51 35 86
9 39 35 74
Eka Kartika Damayanti, 2014
SCIENTIFIC INQUIRY SKILLS IMPROVEMENT OF JUNIOR HIGH SCHOOL STUDENTS
Universitas Pendidikan Indonesia | repository.upi.edu | perpustakaan.upi.edu
stages. These skills can be measured by several ways; one of them is by administering paper-pencil test.
3. Students improvement that will be investigated here is how students scientific inquiry skills tends to develop, included how of each skill are develop and factors that most possibly affect the improvement.
D. Research Instrument
An instrument consisted of 18 test item was used in this research. Since there are 9 skills in Scientific Inquiry Skills, each skill is represented by two test items.
The test items consist of questions that will represent the stages of scientific inquiry skills by Carl J. Wenning (2007). Multiple choice test items are used because there are a lot of samples required and hopefully data analysis will be more precise and easier for statistical analysis.
Many steps have been conducted during instrument development process. There were two major steps in developing the research instrument, i. e. composing the test item and validity test. Thorough explanation about the steps will be elaborated as below.
1. Developing the Instrument
It took a long time to come to a set of final instrument that ensured to measure scientific inquiry skills of junior high school students.
a. Literature research
A lot of supportive reference was needed to help the researcher construct basic idea of the measurement. During this step, discussion with the experts such as Carl J. Wenning was often conducted.
b. Instrument judgment
Eka Kartika Damayanti, 2014
SCIENTIFIC INQUIRY SKILLS IMPROVEMENT OF JUNIOR HIGH SCHOOL STUDENTS
Universitas Pendidikan Indonesia | repository.upi.edu | perpustakaan.upi.edu
International Program on Science Education, Faculty of Mathematics and science Education – Indonesia University of Education.
During judgment process, a lot of notes and revisions have been passed through until come to 55 test items that will be tested to students in and judgment was tested to a group of students. The participants in this instrument test are 30 people of 8th grader in a Junior High School in Bandung.
b. Analysis of instrument test
Result of instrument test was analyzed using ANATES software. There are some important points that took much attention in order to make a final instrument for real data collection. Some points that emphasized there were:
1) Validity
Anderson in Arikunto (2011) said that a test is valid if it measure what it purpose to measure. It was emphasized in Arikunto (2011:85) that a test is said having validity if the result matches the criterion, or there is linearity between the test and the criterion.
Eka Kartika Damayanti, 2014
SCIENTIFIC INQUIRY SKILLS IMPROVEMENT OF JUNIOR HIGH SCHOOL STUDENTS
Universitas Pendidikan Indonesia | repository.upi.edu | perpustakaan.upi.edu
�= � −( ) ( )
(� 2−( )2 � 2−( )2
Where:
= sum of all students in that item
= sum of total score of students
� = sum of all students
= score of each student in that item
= total score of each student
� = Coefficient of validity
2) Level of Difficulty
Arikunto (2011:223) said that a good test instrument is neither too easy nor too difficult. A number that represent the difficulty of a test instrument is called as difficulty index. The scale of difficulty index is from 0 until 1. 0 is for the easiest and 1 for the hardest.
3) Reliability
Anderson et al. in Arikunto (2012) said that the validity and reliability are requirements for a test. In development of a test instrument, validity and reliability are two important things. Validity is important, and reliability is needed (Arikunto, 2012:101). A test might be reliable but invalid, but a test that is valid usually reliable.
4) Discriminating Power
Eka Kartika Damayanti, 2014
SCIENTIFIC INQUIRY SKILLS IMPROVEMENT OF JUNIOR HIGH SCHOOL STUDENTS
Universitas Pendidikan Indonesia | repository.upi.edu | perpustakaan.upi.edu
the students are high or low achievers in term of their advancement in scientific inquiry skills test items.
c. Revision
While test instrument was judged by experts and tested to a group of students, revisions and literature review have been done to select the most appropriate test items for measuring scientific inquiry skills. Statistical calculation becomes one of main consideration in choosing the test items.
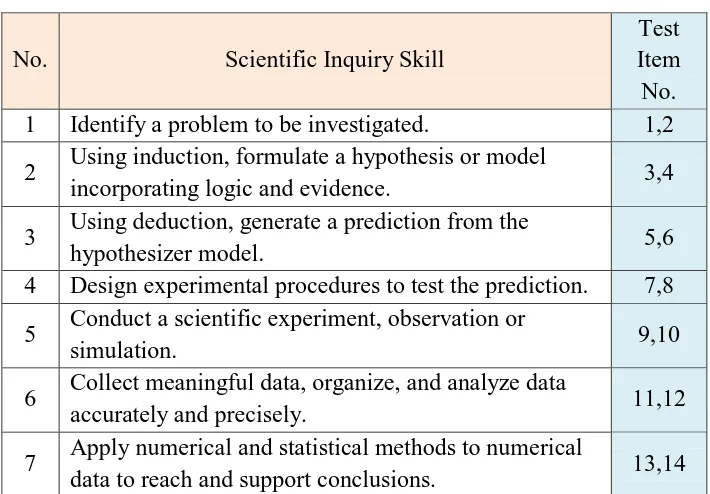
Table 3. 2 - Used Test Items in Data Collection
No. Scientific Inquiry Skill
Test Item No. 1 Identify a problem to be investigated. 1,2 2 Using induction, formulate a hypothesis or model
incorporating logic and evidence. 3,4
3 Using deduction, generate a prediction from the
hypothesizer model. 5,6
4 Design experimental procedures to test the prediction. 7,8 5 Conduct a scientific experiment, observation or
simulation. 9,10
6 Collect meaningful data, organize, and analyze data
accurately and precisely. 11,12
7 Apply numerical and statistical methods to numerical
Eka Kartika Damayanti, 2014
SCIENTIFIC INQUIRY SKILLS IMPROVEMENT OF JUNIOR HIGH SCHOOL STUDENTS
Universitas Pendidikan Indonesia | repository.upi.edu | perpustakaan.upi.edu
8 Explain any unexpected results. 15,16
9
Using available technology, report, displays, and defends the results of an investigation to audiences that might include professionals and technical experts.
Eka Kartika Damayanti, 2014
SCIENTIFIC INQUIRY SKILLS IMPROVEMENT OF JUNIOR HIGH SCHOOL STUDENTS
Universitas Pendidikan Indonesia | repository.upi.edu | perpustakaan.upi.edu
E. Data Collection
Data collection was following cross-sectional survey research design by Creswell (2011) and Gay et al. (2009). Scientific inquiry skills test item was given to samples from grade 7, 8 and 9 in each school. Students are given 60 minutes to fill the test items and not allowed to discuss with each other to ensure that their answer are purely represent their scientific inquiry skills.
F. Data Processing
Data proceeded by using ANATES software to know the percentage ratio of each test item that can be answered correctly by the students. In each test item, increment and decrement pattern are analyzed so the conclusion of scientific inquiry skills improvement can be inferred.
G. Data Analysis
Data obtained in this research was analyzed based on descriptive way (Creswell, 2011). Since there are two research questions satisfied in the research, both of them have been analyzed thoroughly.
This research focused on how scientific inquiry skills are improved during junior high school, so the score of the test items became parameter of students’ scientific inquiry skills improvement. Score of grade 7, 8, and 9 are compared to see the improvement pattern as elaborated in cross-sectional research survey (Gay et al., 2009).
Eka Kartika Damayanti, 2014
SCIENTIFIC INQUIRY SKILLS IMPROVEMENT OF JUNIOR HIGH SCHOOL STUDENTS
Universitas Pendidikan Indonesia | repository.upi.edu | perpustakaan.upi.edu
H. Research Scheme
Figure 3.1 Research Scheme Literature Study
Identification of Problem and Research
Seminar of Research Proposal
Development of Research Instrument
Instrument validation
Valid Invalid
Data Collection
Data Processing and Analysis
Conclusion
Seminar of Final Research Paper
Preparation phase
Core phase