27
Anisa Silmi Nurjanah, 2015
EFFECT OF LEVELS OF INQUIRY IMPLEMENTATION ON SEVENTH GRADE STUDENTS’ SCIENTIFIC INQUIRY SKILL ACHIEVEMENT
Universitas Pendidikan Indonesia | repository.upi.edu | perpustakaan.upi.edu
CHAPTER III
METHODOLOGY
A. Research Method and Design
1. Research Method
As the objective of this research is to investigate the effect of levels of
inquiry implementation to students’ scientific inquiry skills’ achievement and how to best implementing levels of inquiry in facilitating the students to
master scientific inquiry skills, the method used in this research is
quantitative-descriptive method as it was stated in Creswell (2009). This
research was conducted in one of state junior high school in Bandung,
Indonesia, which will be named as junior high school X. The research was
conducted on September 2014. Control variables included in the research
were in form of pretest and posttest item test and sampling. Some covariates
might be included as one of alternative in explaining problem resulted by
confound.
.
2. Research Design
Based on the research method used in this research and adjusted to the
objectives o the reseach, the design of this research was one-group
pretest-posttest design (Gay, et.al., 2009), in which involving a single group being
tested (pretest), participated in certain treatment, and ended by being tested
Anisa Silmi Nurjanah, 2015
EFFECT OF LEVELS OF INQUIRY IMPLEMENTATION ON SEVENTH GRADE STUDENTS’ SCIENTIFIC INQUIRY SKILL ACHIEVEMENT
Universitas Pendidikan Indonesia | repository.upi.edu | perpustakaan.upi.edu
achievement difference after being intervened by Levels of Inquiry
implementation on classification of Plantae Kingdom. The single group
would have been tested at the end of treatment and thus, the result of the
second test would have been compared with the preliminary test in
measuring the significance difference of students’ achievement after
teaching and learning process.
Table 3.1 Scheme of One-Group Pretest-Posttest Design
Sampl
e Measure or
Observation Treatment
Measure or
Observation
A O1 X1 O2
O1 : Pretest of students’ science inquiry skill
X1 : Treatment implementation, which is teaching by Levels of
Inquiry on topic of classification of plant
O2 : Posttest of students’ science inquiry skill
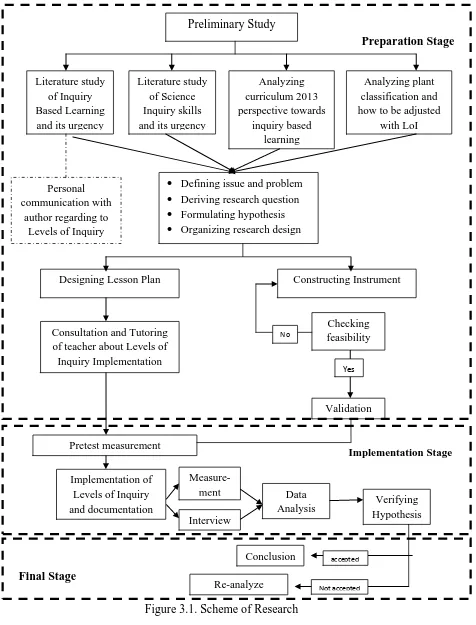
In establishing the research, the procedure is divided into 3 parts, which are
preparation stage, implementation stage, and final stage.
a. The preparation stage is including preliminary study such as literature
review about Levels of Inquiry, Scientific Inquiry Skill, and curriculum
point of view regarding their urgency to be implemented, designing and
arranging research, and constructing the instrument. Validation of
instrument as well as checking its reliability and training the teacher
Anisa Silmi Nurjanah, 2015
EFFECT OF LEVELS OF INQUIRY IMPLEMENTATION ON SEVENTH GRADE STUDENTS’ SCIENTIFIC INQUIRY SKILL ACHIEVEMENT
Universitas Pendidikan Indonesia | repository.upi.edu | perpustakaan.upi.edu
b. The implementation stage is including the implementation of Levels of
Inquiry starting from preliminary observation and measurement until the
data collection.
c. The final stage will be the data analysis as well as verifying hypothesis of
research.
Anisa Silmi Nurjanah, 2015
EFFECT OF LEVELS OF INQUIRY IMPLEMENTATION ON SEVENTH GRADE STUDENTS’ SCIENTIFIC INQUIRY SKILL ACHIEVEMENT
Universitas Pendidikan Indonesia | repository.upi.edu | perpustakaan.upi.edu
Figure 3.1. Scheme of Research Pretest measurement
Preliminary Study
Literature study of Inquiry Based Learning and its urgency
Personal communication with
author regarding to Levels of Inquiry
Analyzing how to be adjusted
with LoI
Defining issue and problem Deriving research question Formulating hypothesis Organizing research design Literature study
of Science Inquiry skills and its urgency
Designing Lesson Plan Constructing Instrument
Checking feasibility
Yes
No
Validation Consultation and Tutoring
of teacher about Levels of Inquiry Implementation
Anisa Silmi Nurjanah, 2015
EFFECT OF LEVELS OF INQUIRY IMPLEMENTATION ON SEVENTH GRADE STUDENTS’ SCIENTIFIC INQUIRY SKILL ACHIEVEMENT
Universitas Pendidikan Indonesia | repository.upi.edu | perpustakaan.upi.edu
B. Subject of Research
Population can be defined as any size that may cover any geographic area
or certain group as a whole that interests the researcher (Gay, et.al, 2009). The
population that used in data is in form of accessible population which was taken
from all 7th grade students of junior high school X, Bandung
Based on population, sample was taken by using purposive sampling,
which is a process of selecting participant of research that is believed to represent
chosen population in general (Gay, et.al, 2009). As much as 29 students of
seventh graders were taken as the sample of the research. The sample was taken
based on consultation with science teacher, whom was the subject of experiment
treatment, considering to make it as homogenous sample and representative for
data collection.
C. Operational Definition
1. Levels of Inquiry
This term refers to a learning spectrum proposed by Carl J Wenning in
2004, which in this term refers to levels of discovery learning, where students
are expected to discover a science phenomenon; interactive demonstration,
where students are shown a demonstration regarding to that phenomenon;
inquiry lesson, where students are expected to analyze the demonstration and
predict the variables related to that phenomena; and inquiry lab, where
students are expected to manipulating variables.
Anisa Silmi Nurjanah, 2015
EFFECT OF LEVELS OF INQUIRY IMPLEMENTATION ON SEVENTH GRADE STUDENTS’ SCIENTIFIC INQUIRY SKILL ACHIEVEMENT
Universitas Pendidikan Indonesia | repository.upi.edu | perpustakaan.upi.edu
Science inquiry skills in this research will refer to stages of inquiry as
stated by Carl J. Wenning in 2007, which in this term refer to 6 of 9 skills
which defines scientific inquiry skills as part of scientific literacy.
3. Achievement
Achievement in this research paper refers to the improvement of
students’ test when the result of pretest is being compared with posttest result.
The mean comparison, average normalized gain, and t-test result will be
indicators of students’ achievement.
D. Research Instruments
The instruments used in this research were made in order to get relevant
data. A series of pretest, posttest, observation sheet as well as its rubric were the
instruments used during research implementation
1. Pre- test
A set of instrument was developed by adapting the scientific inquiry
skills item test made by Wenning in 2007 into 18 scientific inquiry skills’
item tests. The item test will be adapted to topic of classification of plant.
Yet, the content burden was not being highlighted since the item tests were
made so that the scientific inquiry skills would be the one which is assessed
instead of the content coverage of the item test. The item tests were made in
form of multiple choices since it is expected to get clearer data as well as
easier in the statistical analysis of the result.
Pretest is a test given before the treatment is implemented. It was given
Anisa Silmi Nurjanah, 2015
EFFECT OF LEVELS OF INQUIRY IMPLEMENTATION ON SEVENTH GRADE STUDENTS’ SCIENTIFIC INQUIRY SKILL ACHIEVEMENT
Universitas Pendidikan Indonesia | repository.upi.edu | perpustakaan.upi.edu
learning. The pretest given had been validated to other participant as the
preparation stage of the instrument until the blueprint was fixed to be used.
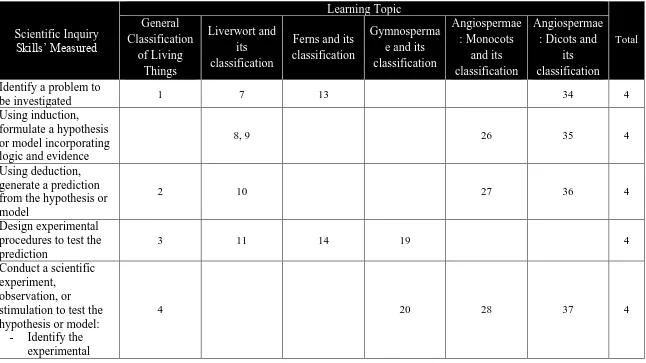
A blueprint of instrument was made in order to get a clear separation
among the weight of each skill along with the topic that should cover it. The
Anisa Silmi Nurjanah, 2015
EFFECT OF LEVELS OF INQUIRY IMPLEMENTATION ON SEVENTH GRADE STUDENTS’ SCIENTIFIC INQUIRY SKILL ACHIEVEMENT
Universitas Pendidikan Indonesia | repository.upi.edu | perpustakaan.upi.edu
Table 3.2 Blueprint of Instrument
Scientific Inquiry Identify a problem to
be investigated 1 7 13 34 4
Using induction, formulate a hypothesis or model incorporating logic and evidence
8, 9 26 35 4
Using deduction, generate a prediction from the hypothesis or model
2 10 27 36 4
Design experimental procedures to test the prediction
3 11 14 19 4
Conduct a scientific experiment,
observation, or stimulation to test the hypothesis or model:
- Identify the experimental
Anisa Silmi Nurjanah, 2015
EFFECT OF LEVELS OF INQUIRY IMPLEMENTATION ON SEVENTH GRADE STUDENTS’ SCIENTIFIC INQUIRY SKILL ACHIEVEMENT
Universitas Pendidikan Indonesia | repository.upi.edu | perpustakaan.upi.edu
Scientific Inquiry
Conduct a scientific experiment,
observation, or stimulation to test the hypothesis or model:
- Identify and define variables operationally
12 15 21 29 4
Conduct a scientific experiment,
observation, or stimulation to test the hypothesis or model:
Anisa Silmi Nurjanah, 2015
EFFECT OF LEVELS OF INQUIRY IMPLEMENTATION ON SEVENTH GRADE STUDENTS’ SCIENTIFIC INQUIRY SKILL ACHIEVEMENT
Universitas Pendidikan Indonesia | repository.upi.edu | perpustakaan.upi.edu
Scientific Inquiry - Identify possible
reasons for inconsistent results such as sources of error or uncontrolled conditions
18 25 33 39 4
Anisa Silmi Nurjanah, 2015
EFFECT OF LEVELS OF INQUIRY IMPLEMENTATION ON SEVENTH GRADE STUDENTS’ SCIENTIFIC INQUIRY SKILL ACHIEVEMENT
Universitas Pendidikan Indonesia | repository.upi.edu | perpustakaan.upi.edu
2. Posttest
Posttest is basically a set of question which is the same as with pretest, yet posttest
was given after the treatment was conducted. The questions tested were identical and had
the same amount of item test which were 18 item tests. Yet, on the testing process, the
number order of the item test is randomly shuffled in order to decrease the risk of
students not giving maximum effort since knowing that the item test used were identical
with the preliminary test.
3. Observational Sheet
The observational sheet was a module given to the observers to observe whether the
teacher maintained the activity during classroom activity according to the lesson that had
been planned. There are two types of observational sheet package, they are:
a. The observation sheet I
It is aimed to observe whether the levels of inquiry had been delivered wholly
and according to lesson plan. In other words, it is an observation sheet to see
the suitability between lesson plan and the reality in classroom activity.
b. The observation sheet II
The observation sheet II was basically adopted from learning sequence
scoring rubric created by Wenning (2004), yet in this observation it focused
on the achievement of students’ intellectual skills per level.
4. Rubric for observational sheet
a. Observation sheet I
Each point will be given 1 for every activity conducted and 0 for every activity
Anisa Silmi Nurjanah, 2015
EFFECT OF LEVELS OF INQUIRY IMPLEMENTATION ON SEVENTH GRADE STUDENTS’ SCIENTIFIC INQUIRY SKILL ACHIEVEMENT
Universitas Pendidikan Indonesia | repository.upi.edu | perpustakaan.upi.edu
� = ���� ��� � × %
b. Observation sheet II
Each category will be given scale 1-4 as 1 was representing poor and 4 were for
excellent. The total score gained will be calibrated so the result will be in percentage.
� = ���� ��� � × %
E. Instrument Validation
A good instrument is the one which can be valid and reliable as it is used for research
purpose. Series of preparation had been set and done in order to ensure that the instrument
used during data collection stage was valid and reliable.
The instrument of pretest as well as posttest was validated to a class of 9th grader in one
of junior high school Y in Bandung. The test was validated to total 28 participants and being
analyzed by the help of ANATES software program. The result from ANATES was then
being judged and consulted with 2 experts to be revised.
1. Validation
Validation is a measurement in proving whether a set of instrument is valid to be
used as research purpose by seeing the level of its validity if it was high or low
(Arikunto, 2010). The formula used in measuring instrument’s validity was using Pearson correlation product moment formula, which was stated as below:
= � ∑ − ∑ ∑
√{� ∑ 2−(∑ 2){� ∑ 2−(∑ 2)}}
Anisa Silmi Nurjanah, 2015
EFFECT OF LEVELS OF INQUIRY IMPLEMENTATION ON SEVENTH GRADE STUDENTS’ SCIENTIFIC INQUIRY SKILL ACHIEVEMENT
Universitas Pendidikan Indonesia | repository.upi.edu | perpustakaan.upi.edu
Table 3.3 Validity Interpretation
Correlation Coefficient Validity Criteria
0,80 < r < 1,00 Very high
0,60 < r < 0,80 High
0,40 < r < 0,60 Enough
0,20 < r < 0,40 Low
0,00 < r < 0,20 Very low
(Arikunto, 2010)
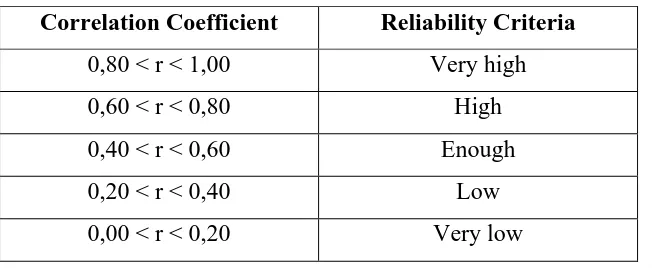
2. Reliability
Reliability is defined as how good an instrument and dependable enough to be
used in data collecting since a good instrument will have no tendency and steady while
being used as an instrument (Arikunto, 2010). It is possible that an instrument can be
valid yet unreliable and vice versa. Thus, the reliability and validity test are a package
that cannot be separated and the key of how good and bad an instrument is. Reliability
can be categorized into such category as below
Table 3.4 Reliability Interpretation
Correlation Coefficient Reliability Criteria
0,80 < r < 1,00 Very high
0,60 < r < 0,80 High
0,40 < r < 0,60 Enough
0,20 < r < 0,40 Low
0,00 < r < 0,20 Very low
Anisa Silmi Nurjanah, 2015
EFFECT OF LEVELS OF INQUIRY IMPLEMENTATION ON SEVENTH GRADE STUDENTS’ SCIENTIFIC INQUIRY SKILL ACHIEVEMENT
Universitas Pendidikan Indonesia | repository.upi.edu | perpustakaan.upi.edu
3. Level of difficulty
Level of difficulty or item difficulty is a total number in percentage of students who
answered the questions correctly (Adams & Wieman, 2010). As it is stated in Adams &
Wieman (2010) journal, the wider the range of level of difficulty, the instruments can
assess wider range of students’ level of mastery on something that was being assessed.
The level of difficulty can be categorized as below:
Table 3.5 Level of Dificulty Interpretation
Value Criteria
0,00 – 0,29 Difficult
0,30 – 0,69 Medium
0,70 –1,00 Easy
(Arikunto, 2010)
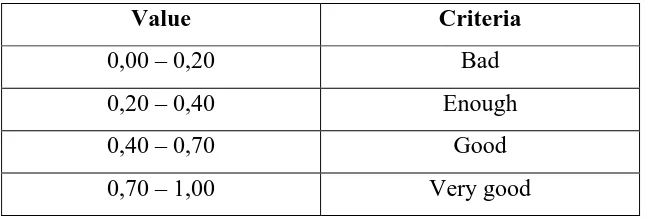
4. Discriminating power
Discriminating power or discriminating index is a measurement to differentiate the
upper and lower group in class, by judging how lower students would highly deceived
by the option while the upper one will be able to answer the question correctly (Adams
& Wieman, 2010). Discriminting power is usefull in identifying some important
questions that usually tricks the knowledge of the students by the options. The
discriminating power can be categorized as below:
Table 3.6 Discriminating Power Interpretation
Value Criteria
0,00 – 0,20 Bad
0,20 – 0,40 Enough
0,40 – 0,70 Good
0,70 – 1,00 Very good
Anisa Silmi Nurjanah, 2015
EFFECT OF LEVELS OF INQUIRY IMPLEMENTATION ON SEVENTH GRADE STUDENTS’ SCIENTIFIC INQUIRY SKILL ACHIEVEMENT
Universitas Pendidikan Indonesia | repository.upi.edu | perpustakaan.upi.edu
As the instrument being validated, the instrument was judged by two different
experts and thus being calculated and selected in order to get a set of instrument to test
scientific inquiry skills. The result of validation and judgment were presented as below:
Table 3.7 Recapitulation of Instrument Validation
No Validity Reliability Level of Difficulty
Discriminating
Power Information
1 0.254 0,29 67.86 25.00 Taken, revised
2 0.324 10.71 25.00 Taken, revised
3 0.162 64.29 25.00 Taken, revised
4 0.205 14.29 12.50 Taken, revised
5 0.106 35.71 25.00 Disposed
6 0.205 21.43 25.00 Disposed
7 0.074 60.71 12.50 Disposed
8 0.375 21.43 37.50 Taken, revised
9 0.220 32.14 25.00 Taken, revised
10 0.281 53.57 50.00 Taken, revised
11 0.061 10.71 12.50 Disposed
12 0.432 21.43 37.50 Taken, revised
13 0.145 32.14 12.50 Disposed
14 0.395 32.14 37.50 Taken, revised
15 0.320 32.14 50.00 Taken, revised
16 0.173 17.86 25.00 Disposed
17 0.136 10.71 0.00 Disposed
18 -0.195 67.86 -25.00 Invalid
19 0.461 21.43 50.00 Taken, revised
20 0.447 17.86 37.50 Disposed
21 0.093 46.43 0.00 Disposed
22 0.098 10.71 12.50 Disposed
23 0.290 21.43 25.00 Taken, revised
24 -116 53.57 -25.00 Invalid
Anisa Silmi Nurjanah, 2015
EFFECT OF LEVELS OF INQUIRY IMPLEMENTATION ON SEVENTH GRADE STUDENTS’ SCIENTIFIC INQUIRY SKILL ACHIEVEMENT
Universitas Pendidikan Indonesia | repository.upi.edu | perpustakaan.upi.edu
No Validity Reliability Level of Difficulty
Discriminating
Power Information
26 0.275 7.14 12.50 Taken, revised
27 -0.062 14.29 -12.50 Invalid
28 0.111 28.57 12.50 Disposed
29 0.690 35.71 75.00 Taken, revised
30 0.225 57.14 12.50 Disposed
31 0.155 35.71 12.50 Disposed
32 0.517 21.43 50.00 Taken, revised
33 0.332 39.29 50.00 Taken, revised
34 0.094 7.14 0.00 Disposed
35 0.098 10.71 12.50 Taken, revised
36 0.410 7.14 25.00 Taken, revised
37 -0.095 14.29 -12.50 Invalid
38 -0.259 35.71 -25.00 Invalid
39 0.295 17.86 37.50 Disposed
Based on the result presented above, a set of pretest-posttest questions were being
Anisa Silmi Nurjanah, 2015
EFFECT OF LEVELS OF INQUIRY IMPLEMENTATION ON SEVENTH GRADE STUDENTS’ SCIENTIFIC INQUIRY SKILL ACHIEVEMENT
Universitas Pendidikan Indonesia | repository.upi.edu | perpustakaan.upi.edu
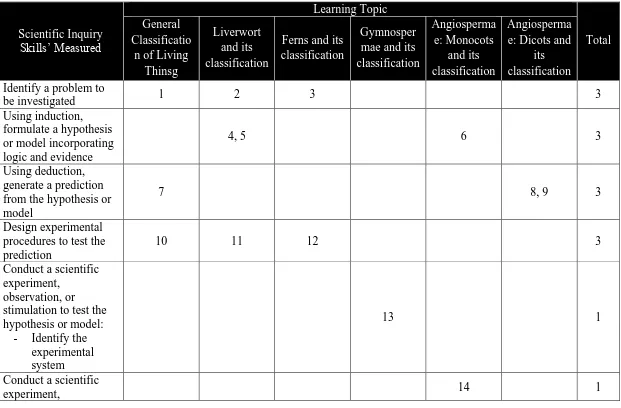
Table 3.8 Set of Pretest-Posttest Item Test
Scientific Inquiry Identify a problem to
be investigated 1 2 3 3
Using induction, formulate a hypothesis or model incorporating logic and evidence
4, 5 6 3
Using deduction, generate a prediction from the hypothesis or model
7 8, 9 3
Design experimental procedures to test the prediction
10 11 12 3
Conduct a scientific experiment,
observation, or stimulation to test the hypothesis or model:
- Identify the experimental system
13 1
Conduct a scientific
Anisa Silmi Nurjanah, 2015
EFFECT OF LEVELS OF INQUIRY IMPLEMENTATION ON SEVENTH GRADE STUDENTS’ SCIENTIFIC INQUIRY SKILL ACHIEVEMENT
Universitas Pendidikan Indonesia | repository.upi.edu | perpustakaan.upi.edu
Scientific Inquiry
stimulation to test the hypothesis or model:
- Identify and define variables operationally Conduct a scientific experiment,
observation, or stimulation to test the hypothesis or model:
Anisa Silmi Nurjanah, 2015
EFFECT OF LEVELS OF INQUIRY IMPLEMENTATION ON SEVENTH GRADE STUDENTS’ SCIENTIFIC INQUIRY SKILL ACHIEVEMENT
Universitas Pendidikan Indonesia | repository.upi.edu | perpustakaan.upi.edu
Scientific Inquiry - Identify possible
reasons for inconsistent results such as sources of error or uncontrolled conditions
18 1
Anisa Silmi Nurjanah, 2015
EFFECT OF LEVELS OF INQUIRY IMPLEMENTATION ON SEVENTH GRADE STUDENTS’ SCIENTIFIC INQUIRY SKILL ACHIEVEMENT
Universitas Pendidikan Indonesia | repository.upi.edu | perpustakaan.upi.edu
F. Data Collection
The research was conducted on September 2014 in junior high school X, Bandung.
The data gathered including the result of pretest and posttest instrument, the observation
sheet, video recording, and the result of interview with the teacher through voice
recording. The data was collected as it was planned and according to the research
scheme that has been planned.
G. Data Analysis Technique
1. Analysis of pretest and posttest result
a. Scoring process
Each of item tests is given weigh of one for each correct item test and zero for
every wrong answer. The total score gained will be calibrated so that it can be
presented in percentage, using formula such below:
� = ���� ��� � × %
The result of the scoring process will become raw data for calculating the score of
average normalized gain and mean comparison. Besides, the data analyzed here
would be processed to statistical analysis by using the aid of SPSS software program
in order to prove the hypothesis made previously and to determine the significance of
the students’ improvement.
b. Average normalized gain
Average Normalized Gain is used as the method in analyzing the data of students’
pretest and posttest. As it is stated by Hake in Saraswati (2013), average normalized
gained is evocative in evaluating the effectiveness of course delivered in classroom
Anisa Silmi Nurjanah, 2015
EFFECT OF LEVELS OF INQUIRY IMPLEMENTATION ON SEVENTH GRADE STUDENTS’ SCIENTIFIC INQUIRY SKILL ACHIEVEMENT
Universitas Pendidikan Indonesia | repository.upi.edu | perpustakaan.upi.edu
Levels of Inquiry implementation on students’ achievement will make average
normalized gained a perfect method in analyzing the main data. The average
normalized gained is described in formula as below:
� =%� − %
��� − %
(Hake in Saraswati, 2013)
The students will be tested by pre-test to see how their preliminary science
inquiry skills before treatment. The students will get the treatment which is the
teaching and learning process of plant’s classification by using Levels of Inquiry and
they will be tested which is called as posttest.
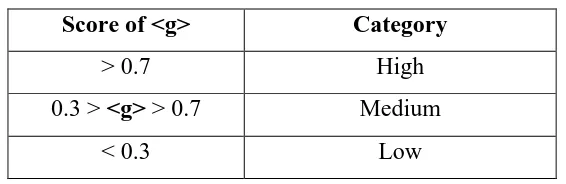
The average normalized gain is categorized into three. Based on Hake in
Tanahoung et.al (2006), the three category of average normalized gain are:
Table 3.9 Normalized gain category
Score of <g> Category
> 0.7 High
0.3 > <g> > 0.7 Medium
< 0.3 Low
2. Observation Analysis
The result of observation sheet will become the supportive data which explains the
result of statistical measurement by using one simple t-test measurement and average
normalized gain. The result of the observation sheet analysis would also help in
determining the relation among skills which are mastered the most by the students and
the thing happened during classroom activity.
Anisa Silmi Nurjanah, 2015
EFFECT OF LEVELS OF INQUIRY IMPLEMENTATION ON SEVENTH GRADE STUDENTS’ SCIENTIFIC INQUIRY SKILL ACHIEVEMENT
Universitas Pendidikan Indonesia | repository.upi.edu | perpustakaan.upi.edu
Interview is also one of optional data which was gathered so the researcher would
consider the obstacle experienced by the teacher as the subject who experienced the