L
Journal of Experimental Marine Biology and Ecology 244 (2000) 181–201
www.elsevier.nl / locate / jembe
A comparative study of differences among species and
patches of habitat on movements of three species of
intertidal gastropods
* M.G. Chapman
Centre for Research on Ecological Impacts of Coastal Cities, Marine Ecology Laboratories A11, University of Sydney, Sydney NSW 2006, Australia
Received 21 April 1999; received in revised form 24 August 1999; accepted 15 September 1999
Abstract
Information about how animals move through complex and patchy habitats is crucial to understanding how animals utilize habitat, spatial and temporal patterns of distribution and abundance, population dynamics and patterns of biodiversity. Dispersal may be influenced by many factors, including intrinsic characteristics of a species (e.g. its mobility, specificity for different resources or its ability to perceive the quality, size or structure of patches of habitat) and / or the features of the habitat itself. It is important to understand the relative importance of these different factors. Comparative studies of movements of different species across habitats of different structure will increase our understanding of the relative importance of species- or habitat-characteristics in determining dispersal and the extent to which patterns of movement can be generalized across co-existing species or different patches of habitat. In this study, movement of three species of intertidal gastropods across patches of habitat that varied in cover of standing water, algae and topographic complexity was measured over three different periods of time in three replicate experiments. Movements were generally randomly orientated, but the linear distances displaced differed in complex ways. Over 24 h, distances displaced differed among species. Over 2 weeks, differences among species disappeared and distances moved were determined by the complexity of the topography. At intermediate times (1 week), there were no clear patterns and the results varied from one experiment to another. For 24 h and 2 weeks, patterns were consistent among experiments. For no species could patterns of movement be related to use of micro-habitats during low tide. The importance of replicating experiments and incorporating numerous temporal scales in studies of movement are discussed. 2000 Elsevier Science B.V. All rights reserved.
Keywords: Experimental design; Gastropod; Habitat; Intertidal; Movement; Temporal pattern
*Tel.: 161-2-9351-4778; fax:161-2-9351-6713. E-mail address: [email protected] (M.G. Chapman)
182 M.G. Chapman / J. Exp. Mar. Biol. Ecol. 244 (2000) 181 –201
1. Introduction
Populations of organisms typically occupy patches of habitat scattered in a matrix of different habitat(s). Densities within these patches fluctuate because of local stochastic or demographic processes and dispersal among patches, which might be via propagules, adults or both (Den Boer, 1968; Levin, 1976; Hansson, 1991; Harrison, 1991). Understanding the factors that maintain individuals within, or cause dispersal among patches of habitat is important in understanding how local populations interact. Movement through patchy habitats determines spatial patterns of many species (Wiens et al., 1995; Underwood and Chapman, 1996) and, ultimately, spatial variability in assemblages and local patterns of biodiversity (Underwood and Chapman, 1998).
Although many experimental studies have identified how individuals move with respect to broad-scale environmental features, e.g. height on intertidal shores (McQuaid, 1981; Williams, 1995), small-scale features of habitat (Underwood, 1977; Levings and Garrity, 1983; Underwood and Chapman, 1989, 1992; With, 1994; Wiens et al., 1995, 1997) or other organisms (Erlandsson and Kostylev, 1995; Chapman, 1998), quantitative comparative studies of movements of the same species among habitats of very different structure and of different species moving across the same range of habitats are not common (but see With, 1994; Dempster et al., 1995; Wiens et al., 1995 for studies of insects). Without such quantitative comparative information, there cannot be general understanding about the relative importance of the ecological characteristics of the organisms themselves or the types of habitat they are moving through. This is particularly important for invertebrates where ‘lack of knowledge of dispersal by endangered invertebrates is a major constraint for conservationists’ (Thomas and Morris, 1994).
Intertidal shores are ideal environments for testing the generality of patterns of movement because they contain different, easily-accessible habitats which are isolated to different degrees and which are occupied by many taxa. These habitats contain closely-related species which forage on different food sources in different ways, but, in addition, different taxa exploit the same food sources. Many intertidal animals can be easily handled, marked, manipulated and relocated (Chapman, 1986; Chapman and Underwood, 1992) and their habitats altered or moved to test specific hypotheses (Petraitis, 1982; Worthington and Fairweather, 1989; Chapman and Underwood, 1994; Crowe, 1996). Techniques for monitoring movement, the necessary controls for experimental manipulation of species and their habitats and the levels of replication necessary for quantifying short- and long-term movement of gastropods have been documented (Mackay and Underwood, 1977; Underwood, 1977, 1988; Chapman, 1986, 1999; Chapman and Underwood, 1992; Crowe, 1996). Finally, the basic ecology and patterns of distribution and abundance of many of the organisms are understood and therefore comparisons among species are relatively easy to interpret.
Chapman (1999) similarly examined movement of Littorina unifasciata Gray over 24-h periods in specific tests of variability in foraging during different conditions of the sea and weather. There have been relatively few comparative studies of movements of the same species in the same habitat over different periods of time. Yet relationships between short-term and long-term patterns of movement are essential to understanding the ecological consequences of different patterns of dispersal. Baur and Baur (1993) examined dispersal of the land snail Arianta arbustorum (L.) in a forest clearing and linear patch of habitat and compared daily movements to movement over 10 months. Although daily movement in each habitat was random in distance and direction, long-term movement varied between the two habitats. Similarly, daily (Hamilton, 1977a) and long-term (Hamilton, 1977b) movements of the intertidal snail Littorina irrorata Say showed that one could not generalize from movement measured in the short-term to explain long-term movement.
Ecologists are becoming increasingly concerned about the need for and difficulties of generalizing from single experiments for improving our understanding of ecological patterns and processes (Underwood et al., 1983; Menge and Farrell, 1989; Underwood and Petraitis, 1993; Crowe, 1999). A number of studies of movements of intertidal animals in different habitats have shown variability in the details of patterns on movement in different experiments, but some generality of pattern when the different experiments were examined together (Underwood and Chapman, 1992; Chapman and Underwood, 1994; Chapman, 1999; Crowe, 1999).
In this study, which is part of a larger study of comparative movement of a suite of intertidal animals across natural and experimentally manipulated habitat, movement of three species of gastropods (N. atramentosa, B. nanum and A. porcata) was compared in a number of replicated experiments. These three species were chosen because they each graze micro-algae and live in the same area of the shore. Local densities of these species have previously been shown to be correlated with cover of water or algae (Underwood, 1975, 1976). Nevertheless, despite these strong associations with particular habitats, short-term movement (over 24 h) was random with respect to distances and directions moved in all three species (Underwood, 1977). Although movement of these species has not been previously examined with respect to topographic complexity of the rock-surface, topographic complexity can have a strong influence on patterns of distribution, abundance and size-structure of populations (Emsen and Faller-Fritsch, 1976; Raffaelli and Hughes, 1978; Underwood and Chapman, 1992), patterns of dispersion (Chapman, 1994) and rates and directionality of movement in intertidal gastropods (Levings and Garrity, 1983; Fairweather, 1988; Underwood and Chapman, 1989; Chapman and Underwood, 1994).
184 M.G. Chapman / J. Exp. Mar. Biol. Ecol. 244 (2000) 181 –201
experiments. Finally, movement was measured over three periods of time (1 day, 1 week and 2 weeks) to test the hypothesis that differences in patterns of movement among species or among habitats are consistent, irrespective of the period over which they are measured.
2. Materials and methods
2.1. Study sites
These experiments were done in the Cape Banks Scientific Marine Research Area,
Botany Bay, New South Wales, Australia (Chapman, 1994). Six sites, each |5 m35
m, were selected around the shores of Cape Banks at the midshore level. The substratum was primarily ‘bare’ rock (probably coated with micro-algae; MacLulich, 1987), with patches of encrusting algae (primarily Hildenbrandia rubra (Sommerfelt) Meneghini and Ralfsia verrucosa (Arescough) J. Agardh) and foliose macro-algae (primarily Hormosira banksii (Turner) Decaisne and Corallina spp.). The rock-surface varied from relatively smooth with few rock-pools from 5 cm to about 80 cm deep, to very complex, with numerous crevices, ledges, overhangs and pools. Three sites were chosen to represent, subjectively, topographically simple sites with few pools, crevices or overhangs; the other three were complex. Cover of free-standing water during low tide and of foliose macro-algae varied among sites, but were not correlated with topographic complexity. Each site had abundant A. porcata, N. atramentosa and B. nanum.
2.2. Methods
The complexity of the rock-surface was measured in each site at three different spatial scales because the topographic complexity on these shores appears to vary at a hierarchy of spatial scales. At the coarsest scale, the height of the substratum was measured using a dumpy level at 1-m intervals along each of five parallel 5-m transects through the site (i.e. 25 measures of height at 1-m spacing on a grid throughout each site). At an intermediate scale, height of the substratum was similarly measured at 50-cm intervals along each of three 1-m transects, separated by 50 cm (providing nine measures of height per grid). Data were collected from two grids, placed randomly in each site. At the finest spatial scale (cm), height of the substratum was measured at 5-cm intervals along each of 10 50-cm transects, separated by 5 cm. This was repeated in each of five random grids per site. At each spatial scale, the index of topographic complexity for each grid was calculated as described in Underwood and Chapman (1989) and, for the intermediate and small scales, the indices were averaged per site.
the total length (TL) of a tape measure laid flush with the substratum to the 5-m linear length (LL) of the transect (TL:LL).
A few days prior to the start of each experiment, |30–60 snails of each species in
each site were individually marked using numbered plastic labels stuck onto the shells. Previous studies have shown little disturbance associated with similar handling and marking (Chapman, 1986). Nevertheless, the snails were left undisturbed for a few days prior to the start of each experiment. Movement was measured as the linear distances and directions displaced by individual snails over three different periods of time; 1 day (two tidal cycles), 1 week and 2 weeks, for each of three experiments (May, August and September, 1998). These measures were calculated from the subsequent positions of snails on the shore, measured in situ from two fixed points in each site (Underwood, 1977) with no further disturbance or handling. Numbers of marked snails varied among species and sites according to the proportions expected to be recovered in each site
(expected sample size was n520; see Chapman, 1986). Because hypotheses were about
variation among species and sites over different periods of time and not specifically about changes in movement over time, the same pool of marked animals of snails was available for recovery after 1 day, 1 week and 2 weeks. Nevertheless, because not all snails were found on each occasion, samples were different each time.
To test the hypothesis that the different species responded differently to features of habitat, on eight occasions during the three experiments, the use of three different microhabitats by each species was measured by counting the marked animals of each species in and out of three different microhabitats: in crevices or overhangs, in contact
with or under the canopy of foliose macro-algae or in water $1 cm deep.
3. Results
3.1. Physical differences among sites
The different measures of habitat were summarized for each site as (i) the topographic index at the largest spatial scale, (ii) the average topographic index at the intermediate spatial scale, (iii) the average topographic index at the smallest spatial scale, (iv) the average proportion of free-standing water per transect, (v) the average proportion of macroalgal cover per transect and (vi) the average measure of TL:LL (Table 1). These
Table 1
Mean (S.E., where applicable) measures of variability of habitat among the three simple (S1, S2, S3) and three complex (C1, C2, C3) sites; details in text
186 M.G. Chapman / J. Exp. Mar. Biol. Ecol. 244 (2000) 181 –201
values were compared among sites and between levels of topographic complexity using analyses of variance (topographic complexity, fixed factor, two levels; sites, three levels, nested within topographic complexity). They were also treated as a multivariate set of data and compared using nMDS ordination calculated from a matrix of normalized Euclidean distances among sites to illustrate variation among sites using all criteria.
The simple sites showed significantly smaller variation in the topographic index and no significant differences among sites at the small spatial scale (analyses of variance;
P.0.05). Similar significant differences (at P,0.05) were not found at the
inter-mediate scale because of the relatively smaller topographic index in one complex site (C3), compared to the other complex sites (Table 1). Nevertheless, the analysis of variance on data transformed to natural logarithms showed a relatively large difference
between the mean topographic index of each level of topographic complexity (F56.90,
2 and 4 df, P,0.06). At the coarsest spatial scale, the topographic index in S3 was
similar to that in C1 and C2. Therefore, topographic complexity varied from one spatial scale to another among the replicate sites and between the two levels on topographic complexity.
There were no significant differences in cover of water (25 to 44%) or foliose macro-algae (5 to 17%) among sites within each level of topographic complexity, nor among the two levels of topography. Finally, the TL:LL ratio showed significant differences among sites, with no significant difference between the two levels of topographic complexity over and above differences among sites.
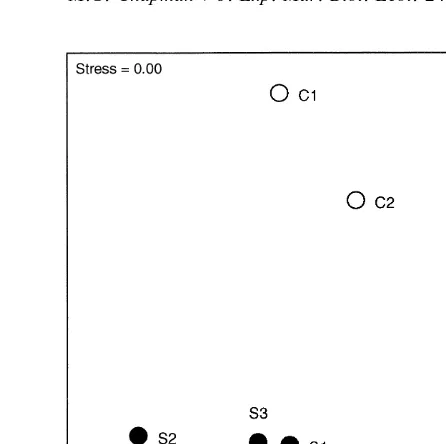
Treating each of these measures as a variable in a multivariate comparison among sites showed that, despite considerable variability among replicate sites within each level of topographic complexity, the two levels of complexity clearly separated in 2-dimensional space (Fig. 1). What had been deemed a priori to be simple sites were clearly different from complex sites.
3.2. Linear distances displaced during movement
Distances displaced during movement were transformed to natural logarithms before analysis because these measures are generally logarithmically distributed (Underwood, 1977). Heterogeneity of variances was tested using Cochran’s test prior to analysis of variance and appropriate means compared using Student–Newman–Keuls (SNK) tests (Underwood, 1997). ‘Species’ and ‘topography’ were considered fixed factors, ‘experi-ment’ (i.e. May, August or September) was a random factor and ‘sites’ were nested in ‘topography’. Because species and topography were fixed factors and experiments and sites random, there were no tests for the main effects of species or topography or their
interaction. Where appropriate (i.e. interaction terms had P.0.25; Underwood, 1997),
interaction terms were eliminated to allow tests for species, topography or their interaction.
Fig. 1. nMDS plot of the three simple (S1, S2 and S3) and three complex (C1, C2 and C3) sites based on ranked normalized Euclidean distances among sites using the average measures summarized in Table 1.
experiments (significant interaction among species, sites and experiments in Table 2a), but of 18 comparisons among species (three times, six sites), only three were significant (SNK tests). In each complex site in each experiment, all species moved similar distances (i.e. the linear displacement between the start and end of the experiment was similar). A. porcata moved further than N. atramentosa and B. nanum in S2 in August and in S3 in May. A. porcata and N. atramentosa moved further than B. nanum in S1 in September. Because SNK tests showed few significant differences and those found were not consistent across sites or the different experiments, this interaction was not considered likely to invalidate comparisons of other sources of variation.
Eliminating interaction terms as described, allowed a test for Sp3T, which showed
that differences among species were consistent across the two levels of topography and vice versa (Table 2a). Averaged across all sites and the three experiments, A. porcata showed significantly greater average displacement than N. atramentosa and B. nanum, which moved similar distances. This difference was larger on the simple topography (Fig. 2), although there was no significant interaction (note that distances were transformed to natural logarithms prior to analysis).
In the second analysis, S1 and one complex site (C3; chosen randomly) were omitted
because of small recapture in S1 in May and the analysis was repeated with n519
(Table 2b). The significant Sp3T interaction (Table 2b) showed that the two species
188
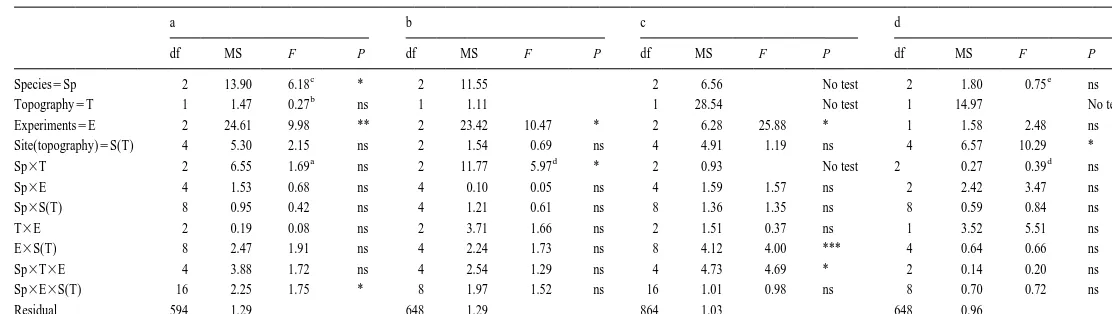
Analyses of mean distances displaced (transformed to natural logarithms) (a) after 1 day in all sites, n512, Cochran’s C50.05, P.0.05; (b) after 1 day (omitting S1 and C3), n519, Cochran’s C50.06, P.0.05; (c) after 1 week in all sites, n517, Cochran’s C50.05, P.0.05; (d) after 2 weeks in all sites (August and September
Residual 594 1.29 648 1.29 864 1.03 648 0.96
a
Tested against Sp3T3E after elimination of Sp3S(T). b
Tested against S(T) after elimination of T3E. c
Tested against Sp3E3S(T) after elimination of S3E and Sp3S(T). d
Tested against Sp3E3S(T) after elimination of Sp3T3E and Sp3S(T). e
Fig. 2. Mean (S.E.) linear distance displaced after 1 day by A. porcata (A.p.), B. nanum (B.n.) and N. atramentosa (N.a.) in areas of simple and complex topography (n5108); *indicates significant differences among means from SNK tests (P,0.05).
sites. This is similar to the trends illustrated in Fig. 2a (using all sites). Therefore, for the distances displaced over 1 day, species showed significant differences. These varied to a minor extent according to the topographic complexity, but there were few differences between simple and complex sites.
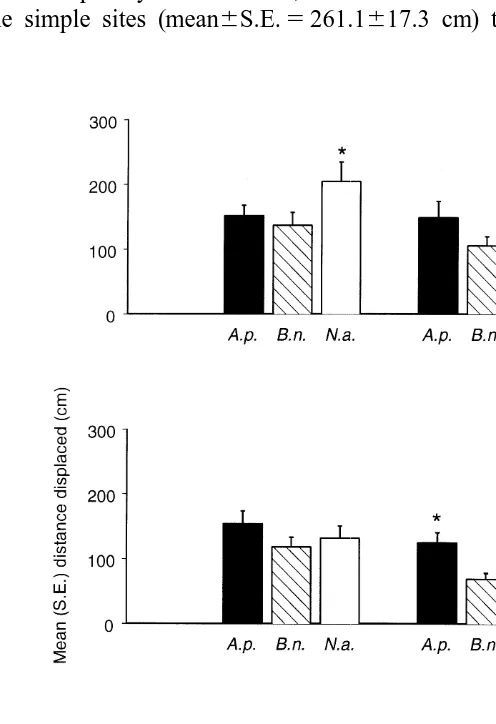
After 1 week, the species showed different patterns of movement from one experiment to another across the different types of topographic complexity (Table 2c). In May, N. atramentosa moved significantly further than the other two species on the simple topography and there were no differences among species on the complex topography (Fig. 3a). In August, A. porcata moved significantly further than the other two species on the complex topography, but the three species moved similar distances on the simple topography (Fig. 3b). In September, there were no significant differences among species (Fig. 3c). Although in all experiments, all species moved slightly further on simple than on complex topography, these differences were only significant for A. porcata in September, N. atramentosa in May and B. nanum in August.
Distances moved after 2 weeks were only available from two experiments (August and September) because of small sample sizes in a number of sites in May. There were no significant differences among the three species (Table 2d). It was not possible to eliminate or pool terms to obtain a test for topographic complexity (relevant P values
,0.25; see Underwood, 1997). Nevertheless, this level in the analysis had a very large
190 M.G. Chapman / J. Exp. Mar. Biol. Ecol. 244 (2000) 181 –201
each species were greater than differences among pairs of species in each type of topography. Therefore, although there was no formal test for topographic complexity, the distances displaced over 2 weeks appeared to be primarily determined by topog-raphy.
These conclusions were also evaluated by testing movement over 2 weeks in each of the two experiments separately. In August, there were significant differences among sites
(F55.46, 4 and 324 df, P,0.01), leading to a non-significant overall effect of
topographic complexity. Nevertheless, movement was considerably greater on average
across the simple sites (mean6S.E.5261.1617.3 cm) than across the complex sites
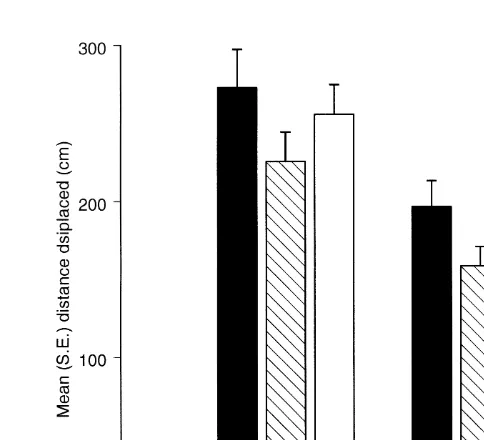
Fig. 4. Mean (S.E.) linear distance displaced after 2 weeks by A. porcata (A.p.), B. nanum (B.n.) and N. atramentosa (N.a.) in areas of simple and complex topography (n5114).
(162.6610.9 cm). In September, there was a significant difference between the two
levels of topographic complexity when the sites(topography) interaction was pooled with
the residual (P.0.23). Again, nett movement was significantly greater over simple
topography (mean6S.E.5243.1617.1 cm) than over complex topography
(mean6S.E.5194.9613.7 cm). These results support the above interpretation.
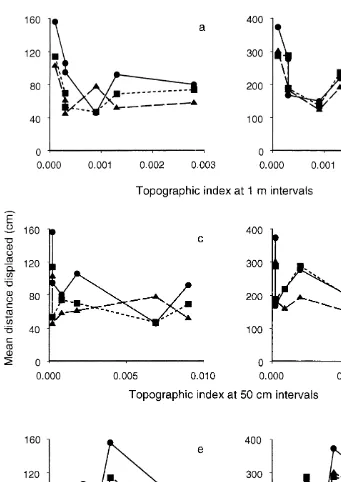
The decrease in specific differences in movement between 1 day and 2 weeks is also illustrated in Fig. 5, which compares the mean distance displaced by each species (averaged over all experiments) with the topographic complexity of the substratum in each site for each level of topographic complexity. In five of the six sites, A. porcata moved further in 1 day than did the other two species (Fig. 5a, c and e). After 2 weeks, this difference among species had almost disappeared (Fig. 5b, d and f).
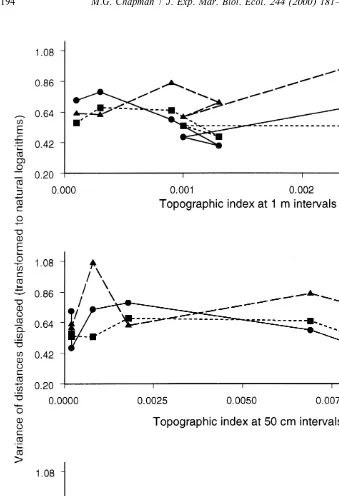
Another influence that habitat may have on movement is to alter the variances of distances displaced by members of a population, especially for species that have specific requirements for habitat, but which might encounter these habitats by chance. To test the hypotheses that variances of displaced distances over 1 day, 1 week or 2 weeks varied according to species, topographic complexity or both, the variances were calculated for each site using the log-transformed data. These were compared among species, topographic complexity and experiments, using the value from each site as a replicate. After 1 day, there was a significant interaction between species and experiments
(F52.77, 4 and 36 df, P,0.05), with A. porcata showing greater variability in
distances displaced in May than did the other two species, which showed similar amounts of variability. After 1 week, there was a significant difference among species
192 M.G. Chapman / J. Exp. Mar. Biol. Ecol. 244 (2000) 181 –201
variability in the distances displaced. After 2 weeks, the variances of the distances displaced did not differ among species, the two levels of topographic complexity, the
two experiments or with any interactions of these variables (P.0.05 for all terms in the
analysis).
3.3. Directionality of dispersal
The original objective was to test hypotheses that the mean direction displaced would vary according to species, topographic complexity or their interaction and that directional patterns of movement would be consistent across experiments. This was to be done using analyses of variance for directional data (Underwood and Chapman, 1985). In fact, movement was only directional (Rayleigh’s test; Mardia, 1972) for A. porcata in two sites in August and for N. atramentosa in two sites in May. Because there is no logic in comparing mean directions when movement is randomly orientated, these particular hypotheses were not tested. Neither was it possible to test the hypotheses that directionality of movement varied according to species or topography, but was consistent
]
across experiments, using the method described in Chapman (1986) because the R values were too small. Therefore, to test the hypothesis that directionality varied among
]
species, topography or experiment, R was calculated for each species in each site in each experiment. These values were then compared using analysis of variance.
All F-ratios were non-significant (P.0.05). Therefore, movement was similarly
randomly orientated in all species, on complex and simple topographic complexity and during the three different experiments.
3.4. Correlations between dispersal and environmental variables
Although the analyses had indicated that topographic complexity was important in determining movement over 2 weeks, comparison across all six sites showed that movement was not simply related to topographic complexity at any one scale, i.e. centimetres, tens of centimetres or a metre (Fig. 5). Similarly, there were few relationships between the variability in the distances displaced and various measures of topographic complexity or cover of water or macro-algae (Fig. 6). The only relatively consistent trend was that B. nanum showed greater variability in the distances displaced than either of the other two species as the substratum became more topographically complex at the smallest spatial scale (Fig. 6c).
3.5. Use of different microhabitats during low tide
194 M.G. Chapman / J. Exp. Mar. Biol. Ecol. 244 (2000) 181 –201
(b) differences among species vary interactively from site to site, for each microhabitat
separately and n58 measures (i.e. times of sampling).
The proportion of marked snails in crevices or overhangs varied significantly among species (Table 3a), with a significantly greater proportion of N. atramentosa found in
crevices (mean6S.E.50.1560.02) than were B. nanum (0.0460.01) or A. porcata
(0.0460.01).
The proportion of marked snails in contact with or under the canopy of algae varied interactively among species and sites (Table 3b). In four of the sites, there were no significant differences among species. In S3, a significantly greater proportion of N. atramentosa were in contact with or under the canopy of algae (mean6S.E.5
0.1560.03) than were B. nanum (0.0260.01) or A. porcata (0.0260.02) and in C1, a
significantly greater proportion of N. atramentosa and A. porcata were in contact with
or under the canopy of algae (mean6S.E.50.1460.03 and 0.1960.07) than were B.
nanum (0.0160.01).
The proportion of marked snails under at least 1 cm depth of water also varied interactively among species and sites (Table 3c). Patterns varied inconsistently from site
to site. The proportion of snails under water and results of SNK tests are as follows (.
indicates a significant difference, P,0.05; 5 indicates a non-significant difference,
P.0.05):
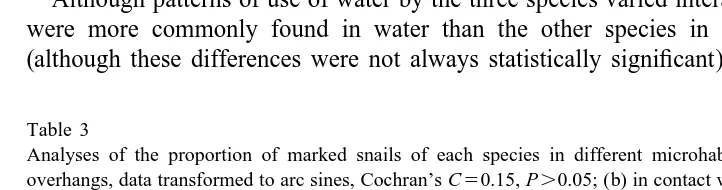
Although patterns of use of water by the three species varied interactively, A. porcata were more commonly found in water than the other species in all sites except S3 (although these differences were not always statistically significant).
Table 3
Analyses of the proportion of marked snails of each species in different microhabitats; (a) in crevices or overhangs, data transformed to arc sines, Cochran’s C50.15, P.0.05; (b) in contact with foliose macro-algae, data transformed to arc sines, Cochran’s C50.13, P.0.05; (c) in water; data untransformed, Cochran’s C50.12, P.0.05; n58 independent times of sampling for each analysis
a b c
df MS F P MS F P MS F P
Species5Sp 2 2529.5 24.16 *** 821.0 3.85 ns 0.55 2.95 ns
Topography5T 1 1347.5 2.51 ns 231.7 0.34 ns 0.22 0.85 ns
Site(topography)5S(T) 4 537.2 6.98 *** 682.9 9.27 *** 0.26 13.95 ***
Sp3T 2 108.2 1.03 ns 514.6 2.42 ns 0.06 0.31 ns
Sp3S(T) 8 104.7 1.36 ns 213.0 2.89 ** 0.19 10.19 ***
196 M.G. Chapman / J. Exp. Mar. Biol. Ecol. 244 (2000) 181 –201
4. Discussion
This study showed that nett movement, as measured by the linear distance displaced by snails while actively foraging, was influenced by characteristics of the species themselves and by the topographic complexity of the habitat, depending on the length of time over which movement was measured. These snails move and feed during high tide and are usually inactive during low tide, except for occasional movement in pools of water (personal observations), although they do not home. Therefore, what was measured as the linear distances displaced by snails over short periods of time (two periods of high tide) gave a measure of the nett distances moved over one or two feeding excursions (snails do not necessarily feed during each high tide). The linear distances displaced over longer periods gave a measure of how the animals moved through their habitat during subsequent foraging periods.
Over short periods of 24 h, characteristics of the species were the strongest influence on movement, with A. porcata being displaced significantly further than B. nanum or N. atramentosa. Although this pattern was common for simple and complex sites, the difference was greater on topographically simple substrata. These results contrast with Underwood (1977), who found that over two 24-h periods, N. atramentosa and A. porcata moved similar distances and significantly further than B. nanum. Because of the particular hypotheses he was testing, this comparison was not replicated over more than one shore and the topographic complexity of the substratum was not measured. The results of this study (replicated three times in six different sites) suggest that, over periods of 24 h, A. porcata does, in general, disperse further than N. atramentosa and B. nanum over a range of different complexities of habitat.
Differences in patterns of foraging among species that live in the same general area (e.g. intertidal shores) and eat the same food are not uncommon, but often the species do not co-exist in and use the same patches of habitat. For example, Nerita funiculata (Menke) live lower on intertidal shores in Panama than do N. scabricosta (Lamarck) (Levings and Garrity, 1983). Each grazes on micro-algae, but N. funiculata graze in small areas around crevices in which they shelter when not feeding, whereas N. scabricosta forage across the shore from high- to lowshore levels. Similarly, the chitons Acanthopleura brevispinosa (Sowerby) live slightly higher on the shores of Somalia than do A. gemmata (Blainville) (Chelazzi et al., 1983). Each feeds on micro-algae during nocturnal low tides, generally foraging downshore and homing to resting positions after feeding. Nevertheless, A. brevispinosa changed resting positions and feeding areas more frequently than did A. gemmata. The limpets Patella rustica L. and
P. coerulea L., which inhabit different levels on Mediterranean shores, show different
temporal patterns of foraging (Della Santini and Chelazzi, 1992). Such patterns are often explained by the model that they reduce interspecific competition for food, but in most studies there have been no direct tests of this model (e.g. Chelazzi et al., 1983; Della Santini and Chelazzi, 1992).
atramen-tosa and B. nanum, on one shore at Cape Banks. Fairweather (1988) examined dispersal of the whelks Morula marginalba Blainville and Thais orbita Gmelin in the same experimental areas and found very large differences in distances dispersed and the use of habitats. He did not, however, have controls for disturbing or translocating the animals into new areas, each of which can influence dispersal (Chapman, 1986; Underwood, 1988; Chapman and Underwood, 1994). Chapman and Underwood (1994) showed different rates of dispersal of two co-existing upper-shore littorinids across very different types of habitat. Interspecific differences in dispersal can be large, even among co-existing species that have similar requirements for food, although the factors that cause these differences are not clearly understood and vary among studies. For example, Levings and Garrity (1983) showed experimentally that the two species of neritid (see above) suffered excessive mortality from predation and physical stress if prevented from retreating to crevices, but no explanation was given for why the two species should show such different patterns of foraging. Similarly, differences in requirements for shelter can lead to differences in movement (Fairweather, 1988; Underwood and Chapman, 1989; Chapman and Underwood, 1994), but the specific factors to which the animals respond are not usually known.
This study showed that the three species showed different patterns of occupation of micro-habitats as has been previously described (Underwood, 1975, 1976, 1977). These could not, however, be easily related to patterns of movement. N. atramentosa was more commonly found in crevices in all sites, i.e. all levels of topographic complexity. Although the proportion of crevices in each site was not directly measured, there were no relationships between short-term rates of movement and topographic complexity (which is related in some way to amounts of crevices and overhangs) measured at a number of scales. This contrasts with other species on these shores that are pre-dominantly found in crevices during low tides and where the presence / absence of crevices markedly affects dispersal over short periods of time (Underwood and Chapman, 1989; Chapman and Underwood, 1994).
Despite variable cover of algae among sites, proportions of snails in contact with algae varied interactively among species from site to site and there were no relationships between patterns of movement and the proportion of snails found in contact with or under algae, nor with the cover of available algae in each site.
In most sites, A. porcata was more commonly found under water than were the other species, thus supporting Underwood (1976). Again, however, for no species were patterns of movement correlated with the amount of available water, nor with the proportion of snails found in water. This contrasts with Underwood (1977) who found that A. porcata moved greater distances in sites with greater cover of water. Cover of water in all sites in this study was, however, towards the lower end of the range of cover in Underwood’s (1977) study.
deter-198 M.G. Chapman / J. Exp. Mar. Biol. Ecol. 244 (2000) 181 –201
minant of movement, with each species being displaced smaller distances over complex substrata. Comparisons of the distances displaced with the TL:LL ratio (Table 1), which is an estimate of the true length of a straight path over complex substratum relative to the linear distance between the start and finish of the path, showed differences in the amount of habitat snails had to move over to get from A to B in a straight line did not account for the large differences in distances displaced between simple and complex sites. Therefore, topographic complexity itself or other variables associated with it (e.g. strength of flow of water during rising and ebbing tides, amount or quality of micro-algal food, etc.) must influence movement. If the snails are responding directly to topographic complexity, then they appear to be responding to features that are not simply identified at one of the three scales measured here because there was no clear correlation with rates of movement and any single measure of topographic complexity. This contrasts with movement of L. unifasciata and N. pyramidalis which were clearly correlated with the topographic complexity measured at the scale of 5 cm (Underwood and Chapman, 1989). Therefore, the snails may respond to a composite measure of topographic complexity incorporating a number of spatial scales. This is presently being examined. Alternatively, they may be responding to features of habitat that are themselves correlated with topography. Decreases in micro-algal food can increase dispersal (Mackay and Underwood, 1977; Branch and Branch, 1981). Underwood (1984) and MacLulich (1987) showed differences in amounts of micro-algae on these shores in relation to height on the shore, exposure to waves and among shores, but did not examine micro-algal abundances with respect to topographic complexity. Micro-algal food in the sites of this study were not measured. Variability in the duration of wetting by the sea during high tide strongly influenced movement in the littorinid, L. unifasciata, at highshore levels (Chapman, 1999), but is less likely to be important in these study sites because they are submersed for similar periods each high tide.
The value of extrapolating from small-scale studies to general patterns has been widely discussed in the literature (Menge, 1991, 1997; Underwood and Petraitis, 1993; Wootton, 1993). Although there are obvious problems with such extrapolation, many experiments cannot be done at the large spatial and temporal scales needed. In terrestrial species that can perceive food at a distance using visual or olfactory cues, simple rules of movement have been shown to describe longer-term foraging (insects — Kareiva, 1982; Turchin, 1991; sheep — Gross et al., 1995). For some snails, however, short-term movements cannot explain long-term patterns of movement (e.g. Hamilton, 1977a,b; Baur and Baur, 1993). Daily movement is often random, probably because the animals do not respond to cues at a distance (even when they have strict requirements for habitat, they may only encounter these habitats by chance, see Chapman and Underwood, 1994). Long-term movement tends, however, to keep animals within limited patches of habitat, perhaps simply because random movements in relatively large sites tends to keep most animals in the site, or possibly because they respond to edges of suitable habitat. This study indicates a problem with extrapolating from short-term to long-term patterns of dispersal because interspecific differences and variability of movement across different habitats each varied according to the length of time over which movement was measured.
Differences among species over 24 h and differences among the two levels of topographic complexity over 2 weeks were consistent over the three experiments. Only at the intermediate stage, movement over 1 week, were there strong interactions among species and topography, which varied from one experiment to the other. It is relatively difficult to describe cues associated with topographic complexity which will vary in their effects from one experiment to another. The most likely cues are environmental, e.g. the roughness of the sea, or the weather, which may have local effects on foraging by different species. Temporal variability in movements among species and habitats is being further investigated because it affects generalizations from few studies to general patterns.
This study is part of a larger project investigating the effects of spatial pattern of habitat on movements of different species across habitats with different fragmentation in order to identify whether differences among species, or the fragmentation of the habitat are most important in determining movement. Obviously, the larger study will have to incorporate different periods over which movement is measured. These results also indicate that all future experiments will have to be replicated a number of times so that temporal variability in movement over different periods of times and in different habitats can be measured. Such data are extremely important in understanding how species use their habitat.
Acknowledgements
This research was funded by an Australian Research Council Small Grant and the Centre for Research on Ecological Impacts of Coastal Cities. I thank J. Grayson, V. Mathews, S. Monteiro, A. Phillips, M. Sage and A.J. Underwood for assistance in the field, particularly J. Grayson who co-ordinated the fieldwork and all the entry and checking of data and assisted with analyses and preparation of the figures. M. Sage assisted with computer programming. A.J. Underwood, P. Archambault and two anonymous reviewers offered helpful comments on earlier drafts of this manuscript. [AU]
References
Baur, A., Baur, B., 1993. Daily movement patterns and dispersal in the land snail Arianta arbustorum. Malacologia 35, 89–98.
Branch, G.M., Branch, M.L., 1981. Experimental analysis of intraspecific competition in an intertidal gastropod, Littorina unifasciata. Aust. J. Mar. Freshwater Res. 32, 573–589.
Chapman, M.G., 1986. Assessment of some controls in experimental transplants of intertidal gastropods. J. Exp. Mar. Biol. Ecol. 103, 181–201.
Chapman, M.G., 1994. Small- and broad-scale patterns of distribution of the upper-shore littorinid Nodilit-torina pyramidalis in New South Wales. Aust. J. Ecol. 19, 83–95.
200 M.G. Chapman / J. Exp. Mar. Biol. Ecol. 244 (2000) 181 –201
Chapman, M.G., 1999. Variability of foraging in highshore habitats: dealing with unpredictability. Hydro-biologia (in press).
Chapman, M.G., Underwood, A.J., 1992. Experimental designs for analyses of movements by molluscs. In: Grahame, J., Mill, P.J., Reid, D.G. (Eds.), Proceedings of the Third International Symposium on Littorinid Biology, The Malacological Society of London, London, pp. 169–180.
Chapman, M.G., Underwood, A.J., 1994. Dispersal of the intertidal snail, Nodilittorina pyramidalis in response to the topographic complexity of the substratum. J. Exp. Mar. Biol. Ecol. 179, 145–169.
Chelazzi, G., Focardi, S., Deneubourg, J.L., 1983. A comparative study on the movement patterns of two sympatric tropical chitons (Mollusca: Polyplacophora). Mar. Biol. 74, 115–125.
Crowe, T.P., 1996. Different effects of microhabitat fragmentation on patterns of dispersal of an intertidal gastropod in two habitats. J. Exp. Mar. Biol. Ecol. 206, 83–107.
Crowe, T.P., 1999. Limits to generality: seasonal and temporal variation in dispersal of an intertidal gastropod. J. Exp. Mar. Biol. Ecol. 232, 177–196.
Della Santini, P., Chelazzi, G., 1992. Temporal organization of foraging in two Mediterranean limpets, Patella rustica L. and P. coerulea L. J. Exp. Mar. Biol. Ecol. 153, 75–87.
Dempster, J.P., Atkinson, D.A., Cheesman, O.D., 1995. The spatial population dynamics of insects exploiting a patchy food resource. 1. Population extinctions and regulation. Oecologia (Berl.) 104, 340–353. Den Boer, P.J., 1968. Spreading of risk and stabilization of animal numbers. Acta Biotheor. 18, 165–194. Emsen, R.H., Faller-Fritsch, R.J., 1976. An experimental investigation into the effect of crevice availability on
abundance and size-structure in a population of Littorina rudis (Manton) (Gastropoda: Prosobranchia). J. Exp. Mar. Biol. Ecol. 23, 285–297.
Erlandsson, J., Kostylev, V., 1995. Trail following, speed and fractal dimension of movement in a marine prosobranch, Littorina littorea, during a mating and a non-mating season. Mar. Biol. 122, 87–94. Fairweather, P.G., 1988. Movements of intertidal whelks (Morula marginalba and Thais orbita) in relation to
availability of prey and shelter. Mar. Biol. 100, 63–68.
Gross, J.E., Zank, C., Hobbs, N.T., Spalinger, D.E., 1995. Movement rules for herbivores in spatially heterogeneous environments: responses to small scale pattern. Landsc. Ecol. 10, 209–217.
Hamilton, P.V., 1977a. Daily movements and visual location of plant stems by Littorina irrorata (Mollusca: Gastropoda). Mar. Behav. Physiol. 4, 293–304.
Hamilton, P.V., 1977b. Intertidal distribution and long-term movement of Littorina irrorata (Mollusca: Gastropoda). Mar. Biol. 46, 49–58.
Hansson, L., 1991. Dispersal and connectivity in metapopulations. Biol. J. Linn. Soc. 42, 89–103. Harrison, S., 1991. Local extinction in a metapopulation context: an empirical evaluation. Biol. J. Linn. Soc.
42, 73–88.
Kareiva, P., 1982. Experimental and mathematical analyses of herbivore movement: quantifying the influence of plant spacing and quality on foraging discrimination. Ecol. Monogr. 52, 261–282.
Levin, S.A., 1976. Population dynamic models in heterogeneous environments. Annu. Rev. Ecol. Syst. 7, 287–310.
Levings, S.C., Garrity, S.D., 1983. Diel and tidal movement of two co-occurring neritid snails: differences in grazing patterns on a tropical rocky shore. J. Exp. Mar. Biol. Ecol. 67, 261–278.
Mackay, D.A., Underwood, A.J., 1977. Experimental studies on homing in the intertidal patellid limpet Cellana tramoserica (Sowerby). Oecologia (Berl.) 30, 215–237.
MacLulich, J.H., 1987. Variations in the density and variety of intertidal epilithic microflora. Mar. Ecol. Progr. Ser. 40, 285–293.
Mardia, K.V., 1972. Statistics of Directional Data, Academic Press, London.
McQuaid, C.D., 1981. The establishment and vertical size gradients in populations of Littorina africana knysnaensis (Philippi) on an exposed rocky shore. J. Exp. Mar. Biol. Ecol. 54, 77–90.
Menge, B.A., 1991. Generalizing from experiments; is predation strong or weak in the New England rocky intertidal? Oecologia (Berl.) 88, 1–8.
Menge, B.A., 1997. Detection of direct versus indirect effects: were experiments long enough? Am. Nat. 149, 801–823.
Petraitis, P.S., 1982. Occurrence of random and directional movements in the periwinkle, Littorina littorea (L.). J. Exp. Mar. Biol. Ecol. 59, 207–217.
Raffaelli, D.G., Hughes, R.N., 1978. The effects of crevice size and availability on populations of Littorina rudis and Littorina neritoides. J. Anim. Ecol. 47, 71–83.
Thomas, J.A., Morris, M.G., 1994. Patterns, mechanisms and rates of extinction among invertebrates in the United Kingdom. Phil. Trans. R. Soc. B 344, 47–54.
Turchin, P., 1991. Quantifying insect movements in the field. Environ. Entemol. 20, 955–963.
Underwood, A.J., 1975. Intertidal zonation of prosobranch gastropods: analysis of densities of four co-existing species. J. Exp. Mar. Biol. Ecol. 19, 197–216.
Underwood, A.J., 1976. Analysis of patterns of dispersion of intertidal prosobranch gastropods in relation to macroalgae and rock pools. Oecologia (Berl.) 25, 145–154.
Underwood, A.J., 1977. Movements of intertidal gastropods. J. Exp. Mar. Biol. Ecol. 26, 191–201. Underwood, A.J., 1984. Vertical and seasonal patterns in competition for microalgae between intertidal
gastropods. Oecologia (Berl.) 64, 211–222.
Underwood, A.J., 1988. Design and analysis of field experiments on competitive interactions affecting behaviour of intertidal animals. In: Chelazzi, G., Vannini, M. (Eds.), Behavioural Adaptation to Intertidal Life. NATO ASI Series A, Life Sciences, Vol. 151, Plenum Press, New York, pp. 333–357.
Underwood, A.J., 1997. Experiments in Ecology. Their Logical Design and Interpretation using Analysis of Variance, Cambridge University Press, Cambridge, UK.
Underwood, A.J., Chapman, M.G., 1985. Multifactorial analyses of directions of movement of animals. J. Exp. Mar. Biol. Ecol. 91, 17–43.
Underwood, A.J., Chapman, M.G., 1989. Experimental analyses of the influences of topography of the substratum on movements and density of an intertidal snail, Littorina unifasciata. J. Exp. Mar. Biol. Ecol. 134, 175–196.
Underwood, A.J., Chapman, M.G., 1992. Experiments on topographic influences on density and dispersion of Littorina unifasciata in New South Wales. In: Grahame, J., Mill, P.J., Reid, D.G. (Eds.), Proceedings of the Third International Symposium on Littorinid Biology, The Malacological Society of London, London, pp. 181–195.
Underwood, A.J., Chapman, M.G., 1996. Scales of spatial patterns of distribution of intertidal invertebrates. Oecologia (Berl.) 107, 212–224.
Underwood, A.J., Chapman, M.G., 1998. A method for analysing spatial scales in variation in composition of assemblages. Oecologia (Berl.) 117, 570–578.
Underwood, A.J., Denley, E.J., Moran, M.J., 1983. Experimental analyses of the structure and dynamics of the midshore intertidal communities in New South Wales. Oecologia (Berl.) 56, 202–219.
Underwood, A.J., Petraitis, P.S., 1993. Structure of intertidal assemblages in different localities: how can local processes be compared. In: Ricklefs, R.E., Schluter, D. (Eds.), Species Diversity in Ecological Com-munities. Historical and Geographical Perspectives, University of Chicago Press, Chicago, pp. 39–51. Wiens, J.A., Crist, T.O., With, K.A., Milne, B.T., 1995. Fractal patterns of insect movement in microlandscape
mosaics. Ecology 76, 663–666.
Wiens, J.A., Schooley, R.L., Weeks, R.D., 1997. Patchy landscapes and animal movements: do beetles percolate? Oikos 78, 257–264.
Williams, G.A., 1995. Maintenance of zonation patterns in two species of flat periwinkle, Littorina obtusata and L. mariae. In: Mill, P.J., McQuaid, C.D. (Eds.), Developments in Hydrobiology III. Advances in Littorinid Biology, Kluwer, Dordrecht, pp. 143–150.
With, K.A., 1994. Using fractal analysis to assess how species perceive landscape structure. Landsc. Ecol. 9, 25–36.
Wootton, J.T., 1993. Predicting direct and indirect effects: an integrated approach using experiments and path analysis. Ecology 75, 151–165.