Stereotype Threat and Women’s Math Performance
Steven J. Spencer
University of Waterloo
Claude M. Steele
Stanford University
and
Diane M. Quinn
University of Michigan
Received February 25, 1998; revised May 23, 1998; accepted June 16, 1998
When women perform math, unlike men, they risk being judged by the negative stereotype that women have weaker math ability. We call this predicament stereotype
threat and hypothesize that the apprehension it causes may disrupt women’s math
performance. In Study 1 we demonstrated that the pattern observed in the literature that women underperform on difficult (but not easy) math tests was observed among a highly selected sample of men and women. In Study 2 we demonstrated that this difference in performance could be eliminated when we lowered stereotype threat by describing the test as not producing gender differences. However, when the test was described as producing gender differences and stereotype threat was high, women performed substantially worse than equally qualified men did. A third experiment replicated this finding with a less highly selected population and explored the mediation of the effect. The implication that stereotype threat may underlie gender differences in advanced math performance, even
This paper was based on a doctoral dissertation completed by Steven J. Spencer under the direction of Claude M. Steele. This research was supported by a National Institute of Mental Health predoctoral fellowship to Steven J. Spencer and grants from the National Institute of Mental Health (MH45889) and the Russell Sage Foundation (879.304) to Claude M. Steele. The authors thank Jennifer Crocker, Lenard Eron, Hazel Markus, David Myers, Richard Nisbett, William Von Hippel, and several anonymous reviewers for their helpful advice and comments on earlier drafts of the manuscript. They also thank Latasha Nash, Sabrina Voelpel, and Nancy Faulk for their help in running experimental sessions.
Correspondence concerning this article and reprint requests should be addressed to Steven J. Spencer, Department of Psychology, University of Waterloo, Waterloo, Ontario, Canada, N2L 3G1.
4
those that have been attributed to genetically rooted sex differences, is discussed. r1999 Academic Press
There was an enormous body of masculine opinion to the effect that nothing could be expected of women intellectually. Even if her father did not read out loud these opinions, any girl could read them for herself; and the reading, even in the nineteenth century, must have lowered her vitality, and told profoundly upon her work. There would always have been that assertion—you cannot do this, you are incapable of doing that—to protest against, to overcome.
Virginia Woolf (A room of one’s own)
No other science has been more concerned with the nature of prejudice and stereotyping than social psychology. Since its inception, the field has surveyed the content of stereotypes (e.g., Katz & Braly, 1933), examined their effect on social perception and behavior (e.g., Brewer, 1979; Devine, 1989; Duncan, 1976; Sagar & Schofield, 1980; Gaertner & Dovidio, 1986; Hamilton, 1979; Rothbart, 1981), explored the processes through which they are formed (Hamilton, 1979; Rothbart, 1981; Smith & Zarate, 1992), examined motivational bases of prejudice (e.g., Rokeach & Mezei, 1966; Tajfel, 1978), and, along with personality psychologists, examined the origins of prejudice in human character (e.g., Adorno, Frenkel-Brunswick, Levinson, & Sanford, 1950; Ehrlich, 1973; Jordan, 1968). It is surprising, then, that there has been no corresponding attention to the experience of being the target of prejudice and stereotypes. Of all the topics covered in Gordon Allport’s (1954) classic The nature of prejudice, this one has been among the least explored in subsequent research. Happily now, this situation has begun to change (e.g., Swim & Stangor, 1998, and this issue), at least in the sense of there having emerged a greater interest in the effects of, and reactions to, societal devaluation. For the most part, this work has focused on stigmatization, the experience of bearing, in the words of Goffman (1963), ‘‘a spoiled identity’’— some characteristic that, in the eyes of society, causes one to be broadly devalued (Crocker & Major, 1989; Frable, 1989; Jones, Farina, Hastorf, Markus, Miller, & Scott, 1984; S. Steele, 1990).
herein lies the threat. In situations where the stereotype applies, they face the implication that anything they do or any feature they have that fits the stereotype makes it more plausible that they will be evaluated based on the stereotype. As in the opening quote by Woolf, there is always that assertion ‘‘to protest against, to overcome.’’ This predicament, we argue, is experienced as a self-threat. Consider the aging grandfather who has misplaced his keys. Prevailing stereotypes about the elderly—their reputed memory deficits, for example—establish a context where his actions that fit the group stereotype, such as losing keys, make it a plausible explanation of his actions. Stereotype threat, it is important to stress, is conceptualized as a situational predicament—felt in situations where one can be judged by, treated in terms of, or self-fulfill negative stereotypes about one’s group. It is not, we assume, peculiar to the internal psychology of particular groups. It can be experienced by the members of any group about whom negative stereotypes exist—generation ‘‘X,’’ the elderly, white males, etc. And we stress that it is situationally specific—experienced in situations where the critical negative stereotype applies, but not necessarily in others. In this way, it differs from the more cross-situational devaluation of ‘‘marking’’ that, for example, stigma is thought to be (e.g., Jones et al., 1984).
In the present research, our central proposition is this: when a stereotype about one’s group indicts an important ability, one’s performance in situations where that ability can be judged comes under an extra pressure—that of possibly being judged by or self-fulfilling the stereotype—and this extra pressure may interfere with performance. We test this proposition in relation to women’s math perfor-mance, both as a test of the theory and as a means of understanding the processes that depress women’s performance and participation in math-related areas. Consider their predicament. Widely known stereotypes in this society impute to women less ability in mathematics and related domains (Eccles, Jacobs, & Harold, 1990; Fennema & Sherman, 1977; Jacobs & Eccles, 1985; Swim, 1994). Thus in situations where math skills are exposed to judgment—be it a formal test, classroom participation, or simply computing the waiter’s tip—women bear the extra burden of having a stereotype that alleges a sex-based inability. This is a predicament that others, not stereotyped in this way, do not bear. The present research tests whether this predicament significantly influences women’s perfor-mance on standardized math tests.
math-related curricula and professions, as well as their test performance. But for now, we turn to the question of gender differences in math test performance.1
In this literature, although such differences are not common (Hyde, Fennema, & Lamon, 1990; Kimball, 1989; Steinkamp & Maehr, 1983), a general pattern has begun to emerge: women perform roughly the same as men except when the test material is quite advanced; then, often, they do worse. Benbow and Stanley (1980, 1983) found, for example, that among talented junior high school math students, boys outperformed girls on the quantitative SAT, a test that was obviously advanced for this age group. Similarly, Hyde, Fennema, and Lamon (1990) in an extensive review of the literature found that males did not outperform females in computational ability or understanding of mathematics concepts, but did outper-form them in advanced problem solving at the high school and college levels. Kimball (1989) found virtually no gender differences in math course work except for college level calculus and analytical geometry courses, where males did better. Finally, several national surveys (Armstrong, 1981; Ethington & Wolfe, 1984; Fennema & Sherman, 1977, 1978; Levine & Ornstein, 1983; Sherman & Fennema, 1977) reached the general conclusion that gender differences are more likely to emerge as students take more difficult course work in high school and college.
Explanations of these differences have tended to fall into two camps. Benbow and Stanley (1980, 1983) have argued that they reflect genetically rooted sex differences in math ability. Others (e.g., Eccles, 1987; Fennema & Sherman, 1978; Levine & Ornstein, 1983; Meece, Eccles, Kaczala, Goff, & Futterman, 1982) argue that these differences reflect gender-role socialization, such that males, far more than females, are encouraged to participate in math and the sciences and that the cumulative effects of this differential socialization are most evident on difficult material.
While acknowledging the contribution of socialization, we suggest that these differences might also reflect the influence of stereotype threat, another process that may be most rife when the material is advanced for the performer’s skills. It is important to stress that a test need not be difficult for stereotype threat to occur. Simply being in a situation where one can confirm a negative stereotype about one’s group—the women simply sitting down to the math test, for example, could be enough to cause this self-evaluative threat. But for several reasons, it should be most likely to interfere with test performance when the test is difficult. If the test is less than difficult, a woman’s successful experience with it will counter the threat the stereotype might otherwise have caused. Also, easier material is simply less likely to be interfered with by the pressure that stereotype threat is likely to pose. When the test is difficult, however, any difficulty in solving the problems poses
the stereotype as a possible explanation for one’s performance. Thus for women stereotype threat should be highest on difficult tests.
STUDY 1
As a first step in our research we sought to replicate the pattern found in the literature—that women underperform in comparison to men on difficult tests, but perform equally with men on easy tests—in a sample of highly qualified equally prepared men and women. The men and women were selected to have a very strong math background.
In the experiment we varied the difficulty of the math test that was given. The difficult test was taken from the advanced GRE exam in mathematics. Most of the questions involved advanced calculus, although some required knowledge of abstract algebra and real variable theory (Educational Testing Service, 1987b). The easier test was taken from the quantitative section of the GRE general exam. It assumes knowledge of advanced algebra, trigonometry, and geometry, but not calculus (Educational Testing Service, 1987a). For the well-trained participants used in this research, this latter exam should be more within the limits of their skills.
The experiment was administered on a computer. This enabled us to measure the amount of time participants spent on the test and thereby to assess the extent to which differences in performance might be related to differences in participants’ effort.
Method
Participants and Design
Twenty-eight men and 28 women were selected from the introductory psychol-ogy pool at the University of Michigan. All participants were required to have completed at least one semester (but not more than a year) of calculus and to have received a grade of ‘‘B’’ or better. They also were required to have scored above the 85th percentile on the math subsection of the SAT (Scholastic Aptitude Test) or the ACT (American College Test). Further, on 11-point scales anchored by strongly agree and strongly disagree, participants had to strongly agree (by responding between 1 and 3) with both of the following statements: (1) I am good at math and (2) It is important to me that I am good at math. Markus (1977) has used these items to measure whether a person is self-schematic in a domain. The experiment took the form of a 2 (male and female)32 (easier and difficult math test) design. The primary dependent variables were performance on the math test and the time participants spent working on the test.
Materials and Apparatus
scored using the standard formula for scoring the GRE, which yields a percentage score corrected so as to disadvantage guessing. Correct items got 1 point, items left blank got no points or deductions, and incorrect items got a deduction of 1 point divided by the number of response options for that item (usually 4 or 5)—the correction factor for guessing.
Procedure
Participants reported to the laboratory in mixed, male and female groups of three to six. They were told, ‘‘We are developing some new tests that we are evaluating across a large group of University of Michigan students. Today you will be taking a math test.’’ The first screen of the test contained instructions that were common to both tests. These instructions explained how to use the computer and how the test would be scored. Participants were also informed that they would have 30 min to complete the test and that they would receive their score at the end of the test. All subsequent instructions were taken directly from the GRE exam itself. These instructions provided definitions for certain terms and symbols, explained the range of items on the test, and included a sample item. The experimenter typed into the computer a randomly assigned code word that determined the participant’s test difficulty condition. This enabled the menter to remain blind to participants’ condition assignments. The single experi-menter was male. After participants completed the test they were thoroughly debriefed and thanked for their participation.
Results and Discussion
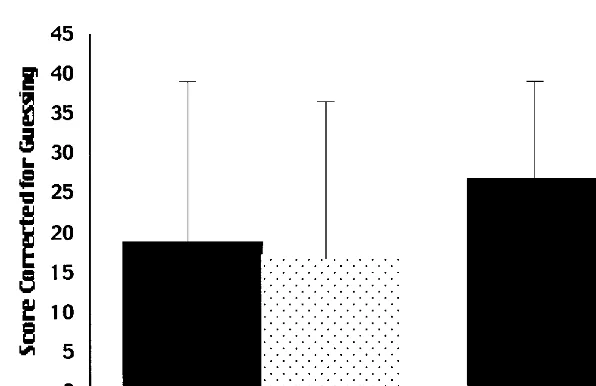
This experiment tested whether the pattern observed in the literature—that women underperform on difficult tests but perform just as well on easier test—holds true with the highly selected participants used in this research. As the means in Fig. 1 show, this pattern did emerge. A two-way ANOVA (Sex3Test Difficulty) revealed a significant main effect for sex, F(1, 52)53.99, p5.05, and a main effect for test difficulty, F(1, 52) 5 137.27, p , .001, that were both qualified by the significant interaction between gender and test difficulty, F(1, 52)5 5.34, p,.05.2Student–Newman–Keuls posthoc comparisons of all possible pairs of means showed that women taking the difficult math test did worse than each of
the other groups and that men taking the difficult math test did worse than men or women taking the easier test ( p,.05).
On average, women taking the difficult test worked 1497 s; men taking the difficult test worked 1539 s; women taking the easy test worked 1738 s; and men taking the easy test worked 1599 s. A two-way (Sex3Test Difficulty) ANOVA of this measure revealed only a marginally significant main effect for test difficulty, with participants spending slightly more time on the easier test, F(1, 52)53.151, p,.10. No other effects obtained significance.
These results show that the differences observed in the literature can be replicated with a highly selected and identified group of participants. Women underperformed in comparison to men on the difficult test, but did just as well as men on the easy test.
STUDY 2
The results of Study 1 mirror the results observed in the literature, but the question still remains about what causes these differences. Our position is that women experience stereotype threat—the possibility of being stereotyped—when taking math tests, and this stereotype threat is especially likely to undermine performance on difficult tests. But alternative interpretations remain. Perhaps women equaled men on the easier math exam in Study 1 not because stereotype threat had less effect when women took this exam, but because only advanced material is sensitive to real ability differences between men and women.
In the present study we tested the effects of stereotype threat directly by giving all participants a difficult math exam—similar to the one used in Study 1—but varied whether the gender stereotype was relevant to their performance. We manipulated the relevance of the stereotype by varying how the test was represented. In the relevance condition participants were told that the test had shown gender differences in the past—a characterization that explicitly evoked
the stereotype about women’s math ability.3In the condition where the stereotype was to be irrelevant, participants were told that the test had never shown gender differences in the past. It is important to stress that this last instruction did not attack the validity of the stereotype itself. It merely represented the test in such a way as to make the stereotype irrelevant to interpreting women’s performance on this particular math test—it being a test on which women do as well as men.
If women underperformed on the difficult test in Studies 1 because of stereotype threat—the possibility that one’s performance could be judged stereo-typically—then making the stereotype irrelevant to interpreting their performance should eliminate this underperformance. That is, representing the test as insensi-tive to gender differences, and thus as a test for which the gender stereotype is unrelated to their performance difficulty, should prevent performance decrements due to stereotype threat. But if this underperformance is due to an ability difference between men and women that is detectable only with difficult math items, women should underperform regardless of how relevant the stereotype is to their performance. In this way, this study provides a direct test of our theory—that it is a stereotype-guided interpretation of performance difficulty that causes women’s underperformance on the difficult math tests in these experiments.
Method
Participants and Design
Thirty women and twenty-four men were selected from the introductory psychology participant pool at the University of Michigan using the same criteria as in Study 1. The experiment took the form of a 232 mixed model design with one between-participants factor (sex) and one within-participants factor (test characterization). The primary dependent variables were performance on the math test and the time participants spent working on the test.
Materials and Apparatus
The tests were administered on computers using the same format as described in Study 1. The difficult test used in Study 1 was divided into two halves, and participants were given 15 min to complete each half. The first six questions from this earlier test comprised the first test and the next five questions comprised the second test. Half of the participants were told that the first test was one on which there were gender differences and that the second test was one on which there were no gender differences. The other half were told the opposite, that the first test was one for which there were no gender differences and that the second test was one on which there were gender differences. Participants were randomly assigned to these order conditions.
Procedure
The directions and procedure were basically the same as those of Study 1, except that participants were told that they would be working on two tests and would have 15 min to complete each test. Participants read: ‘‘As you may know there has been some controversy about whether there are gender differences in math ability. Previous research has sometimes shown gender differences and sometimes shown no gender differences. Yet little of this research has been carried out with women and men who are very good in math. You were selected for this experiment because of your strong background in mathematics.’’ The instructions went on to report that the first test had been shown to produce gender differences and that the second test had been shown not to produce such differences, or vice versa, depending on the order condition. The single experimenter was again male.
Results and Discussion
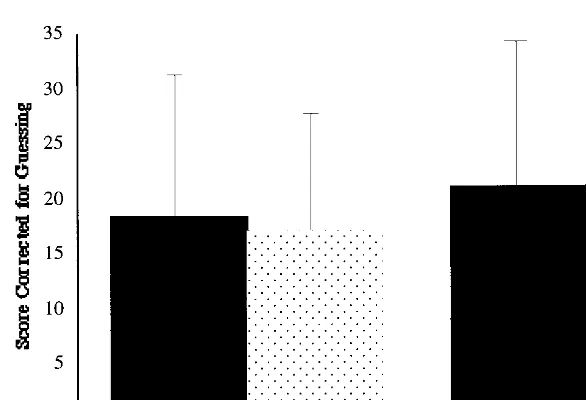
The two halves of the test did not prove to be equally difficult. In fact, the mean for both men and women on the second test was not different from 0, creating a floor effect for that test. To circumvent this problem, we used performance on the first test, the half that did not produce a floor effect, as the dependent variable in this experiment. Test characterization was then treated as a between-participants factor such that people who were told that the first test did yield gender differences made up one level of this factor and people who were told that it did not yield gender differences made up the other level of this factor. A two-way ANOVA (Sex3Test Characterization) of participants’ scores on the test confirmed our predictions. When participants were explicitly told that the test yielded gender differences, women greatly underperformed in relation to men. But when the test was purported not to yield gender differences, women performed at the same level as equally qualified men. This happened, of course, even though the test in these two conditions was the same. The condition means are reported in Fig. 2. There was a main effect for sex, F(1, 50)55.66, p, .05, but it was qualified by a significant sex-by-test characterization interaction, F(1, 50) 5 4.18, p , .05. Student–Newman–Keuls posthoc comparisons of all possible pairs of means revealed that the mean for women in the gender-differences condition was significantly lower than each of the other means and that no other means differed from each other ( p,.05).
We analyzed the time spent on each item only for the first test participants, that is, the half for which there was no floor effect. Women in the gender-differences condition spent an average of 609 s on the test; men in the gender-differences condition spent an average of 817 s; women in the no-gender-differences characterization condition spent an average of 659 s; while men in the no-gender-differences condition spent an average of 697 s. A two-way (Sex3Test Charac-terization) ANOVA of this measure revealed a near-significant main effect for sex, F(1, 50)52.76, p5.10, with men tending to spend more time on these test items than women. No other effects reached significance.
totally eliminate women’s underperformance in this experiment. Yet when the same test was characterized as sensitive to gender differences, women signifi-cantly underperformed in relation to equally qualified men. We believe that by presenting the test as one on which gender differences do not occur, we made the stereotype of women’s math inability irrelevant to interpreting their performance on the test—this particular test. It allowed these women to be as unconcerned with the gender-based stereotype as equally qualified men, which, in turn, allowed them to perform as well as these men. These findings provide strong evidence that women’s underperformance on these difficult math tests results from stereotype threat, rather than from sex-linked ability differences that are detectable only on advanced math material. If women were just unable to do math at the most advanced levels as measured on these tests, their performance would not have improved when we told them that there were no gender differences on the test they were taking. That women did improve demonstrates that it was something about the test taking situation rather then something about their ability that accounted for the difference in their performance.
We should also note that men did slightly worse when they were told that there were no gender differences on the test than when they were told that there were gender differences. This difference did not obtain significance and therefore should be interpreted with caution. However, it might suggest that characterizing the test as producing gender differences benefited men or that characterizing the test as not producing gender differences interfered with men’s performance.
Finally, the slight tendency for women in the gender-differences condition to spend less time on the test items did not reach interpretable significance, but could
suggest that this condition undermined participants’ motivation—a question to which we will return.
STUDY 3
Study 2 provided compelling evidence that stereotype threat can depress women’s performance on a difficult math test and that eliminating this threat can eliminate their depressed performance. However, for three reasons the experiment did not make our point as convincingly as it might have. First, the floor effect found on the second test in Study 2 raises the possibility that the effect of stereotype threat might be limited to a small number of questions. Second, the highly selected sample used in Studies 1 and 2 raises the possibility that stereotype threat effects may have limited generalizability. Third, in Study 2 we explicitly stated that there were gender differences, leaving open the possibility that stereotype threat effects will only emerge when gender differences are alleged. Therefore, in this study we sought to replicate the effect of Study 2 but with a less highly selected sample from another university, on a test with a wider range of problems, and with a control group in which no explicit mention of gender differences is made. If reducing the gender relevance of the stereotype still improves women’s performance under these conditions, then we can have greater confidence that stereotype threat is playing a significant role in women’s math performance.
In addition to this primary purpose, we began to explore the mediation of the effect of stereotype threat on women’s math performance. Presumably, the predicament caused by stereotype threat adds to the normal self-evaluative risk of performance the further risk for women of confirming or being judged by the negative stereotype about their math ability. Several literatures suggest that this kind of threat can interfere with performance. Evaluation apprehension, for example, is essentially a performance-interfering anxiety and distraction that is aroused by an evaluative audience, real or imagined (e.g., Geen, 1991; Schlenker & Leary, 1982). Stereotype threat can even be thought of as a disruptive reaction to an imagined audience set to view one stereotypically. There is also the literature on test anxiety (Sarason, 1972; Wigfield & Eccles, 1989; Wigfield & Meece, 1988; Wine, 1971)—often characterized as a dispositional characteristic, yet sometimes as a disruptive reaction to an evaluative test-taking context—as well as a literature on ‘‘choking’’ in response to evaluative threat more generally (e.g., Baumeister & Showers, 1986). Thus ample evidence shows that self-evaluative threat, of the sort stereotype threat is thought to be, can interfere with intellectual test performance.
Meece & Midgley, 1983; Eccles Parsons & Ruble, 1977; Meece et al., 1982). It is possible, then, that their underperformance in these experiments reflects the effect of lower performance expectations, in turn lowering women’s motivation to perform (e.g., Bandura, 1977, 1986). The ‘‘no-gender-differences’’ condition of Study 2, for example, may have overcome women’s underperformance not by rendering the stereotype irrelevant and thus reducing the threat it causes, but by raising women’s performance expectations for this particular test, convincing them that on this test they would do better. Thus condition differences in self-efficacy rather than differences in stereotype threat could have mediated the effects of the previous studies.
As a preliminary test of these interpretations, the present study measured participants’ evaluation apprehension, state anxiety, and self-efficacy after they received instructions that manipulated stereotype threat and before they took the difficult math test. If any of these variables mediate the effects of stereotype threat they should vary with the instructions for the test—that is, with the independent variable manipulation—and with performance on the test, thus accounting for the effects of the instructions on test performance.
Method
Participants and Design
Thirty-six women and 31 men were selected from the introductory psychology participant pool at the State University of New York at Buffalo. In adapting the experiment to a different participant population, we used a somewhat easier test and selected participants who had scored between 400 and 650 on the math portion of the SAT and who had completed no more than 1 year of calculus.4 These changes would maintain the basic experimental situation of the test being quite difficult for the participants but still within the upper ranges of their ability. The experiment took the form of a 232 factorial (Sex3Test Characterization) design. The primary dependent measure was participants’ performance on the test. In addition, we collected measures of evaluation apprehension, state anxiety, and self-efficacy.
Materials and Apparatus
The test was given on paper. The participants in this experiment were given only one test and were given 20 min to complete it. The test was similar to the tests used in Studies 1 and 2 except that because of the changes in the selection procedures and the participant population, we made it somewhat easier. It was based on the math portion of the Graduate Management Test (GMAT).
Procedure
The directions and procedure were basically the same as those in Studies 1 and 2, except for the introduction of questions designed to examine possible mediators collected after the test characterization manipulation and prior to the actual test. The no-gender-difference condition was the same as that described for Study 2: Participants were told that there were no gender differences on the test—that men and women performed equally. In the control condition of this experiment, subjects were given no information about gender differences on the test.
After subjects were read the instructions for the test including a sample problem, they completed a short questionnaire that had four questions designed to measure evaluation apprehension (If I do poorly on this test, people will look down on me; People will think I have less ability if I do not do well on this test; If I don’t do well on this test, others may question my ability; People will look down on me if I do not perform well on this test), five questions designed to measure self-efficacy (I am uncertain I have the mathematical knowledge to do well on this test; I can handle this test; I am concerned about whether I have enough mathematical ability to do well on the test; Taking the test could make me doubt my knowledge of math; I doubt I have the mathematical ability to do well on the test), and the state–trait anxiety index (Spielberger, Gorsuch, & Lushene, 1970). Upon completion of this questionnaire subjects completed the math test.
Instructions for the experiment including the sample problem were read aloud by the experimenter, so she was not blind to the test characterization manipula-tion. All subjects were run in mixed-sex groups. The sample problem was included so that participants would know that the test was difficult. They did not complete the problem; however, to ensure that performance on the sample problem did not affect the mediation measures, instructions were read aloud to both emphasize the instructions and to standardize exposure to the sample question. The single experimenter was female. When subjects completed the math test they were thoroughly debriefed and thanked for their participation.
Results and Discussion
Replicating the results of the previous studies, women underperformed relative to men in the control condition, but performed equally with them in the no-gender-difference condition. The condition means of participant’s scores are reported in Fig. 3. A 23 2 ANOVA of these scores revealed a main effect for gender, F(1, 63) 5 6.44, p , .05, that was qualified by a gender by test characterization interaction, F(1, 63) 5 4.78, p , .05, such that men outper-formed women only in the control condition. Student–Newman–Keuls posthoc comparisons of all possible pairs of means revealed that the mean for women in the control condition was significantly lower than each of the other means and that no other means differed from each other ( p,.05).
no-gender-differences condition to a control group where no explicit mention of gender differences was made. These two studies provide compelling evidence that reducing stereotype threat can increase women’s math performance. In addition, as in Study 2, we also found a nonsignificant tendency for men to perform slightly worse in the no-gender-differences condition than in the control condition, perhaps suggesting that characterizing the test as not producing gender differ-ences has a negative effect on men’s performance.5
The above predicted finding allows us to begin to explore the mediation of the effect of the test characterization on women’s math performance. Recall that we had three possible mediators in this study, evaluation apprehension, anxiety, and self-efficacy. To verify these measures, we conducted a factor analysis, with varimax rotation, on the questionnaire that assessed them. Four factors emerged with Eigen values greater than 1. These factors correspond quite closely to the
5It should be noted that this nonsignificant tendency is found repeatedly in stereotype threat research. Nonstereotyped groups seem to perform slightly worse in low stereotype threat conditions. This tendency is evident in the Steele and Aronson (1995) study and in several unpublished studies in addition to Studies 2 and 3 in this paper and therefore might be a reliable effect. At this point we only have speculations about what might cause it. Perhaps nonstereotyped groups gain an advantage by not having to consider the possibility that group differences might affect performance on the test and this advantage is lost in low stereotype threat conditions. Alternatively, the low stereotype threat manipulations might heighten anxiety or decrease motivation to perform well among the nonstereo-typed groups. The results of Study 3 do not provide much support for this latter explanation. Among men the anxiety, self-efficacy, and evaluation apprehension means and standard deviations for the control and no-gender-differences conditions, respectively, were as follows: anxiety M58.53,s 5
2.72, M57.56,s 52.25; self-efficacy M521.07,s 54.32, M522.43,s 53.88; evaluation apprehension M58.53,s 53.74, M57.75,s 54.61. None of these differences are significant.
three mediational variables we had intended to measure, so we made scales for these variables from the items that loaded most strongly on the factors to which they corresponded.6 The three scales used in the subsequent analyses and the items loading on these scales are reported in Table 1.
To examine the mediation of stereotype threat effects we conducted three additional analyses as suggested by Baron and Kenny (1986). First, we examined the effect of the stereotype threat manipulation on each potential mediator, and then we examined whether these mediators accounted for the effect of the stereotype threat manipulation on women’s test performance. Finally, we exam-ined each of these mediators individually to see if they could account for the effect of the stereotype threat manipulation on women’s performance.
We conducted these analyses in a regression format just among the women, because it was among women that stereotype threat presumably operated. To examine the mediational hypotheses, we first conducted a series of regression analyses in which we allowed the stereotype threat manipulation to predict each of the mediational variables.7There was no evidence of a relationship between the stereotype threat manipulation and evaluation apprehension (b 5 20.06, T(31)5 20.311, p..35) or self-efficacy (b 5.17, T(31)51.01, p..15). How-ever, the manipulation did have a marginally significant effect on anxiety (b 5 20.26, T(31)5 21.3, p5.09). Thus, representing the test as gender-fair tended to lower women’s anxiety, but had no discernable effect on their evaluation apprehension or their self-efficacy.8
Next we examined whether any of the potential mediators predicted test performance and whether these mediators accounted for the effect of the stereo-type threat manipulation on test performance. We used hierarchical regression to do this. In the first block of predictors we included the mediational variables— anxiety, self-efficacy, and evaluation apprehension. In the second block we
6The factor analysis produced four factors. The results of that factor analysis are reported in Table 1. Four additional items from the STAI (I am relaxed; I feel content; I feel steady; and I feel pleasant) loaded on a fourth factor. These items seemed to be less related to anxiety than the other items on the STAI; therefore, we did not include this factor in our analyses. When this factor was included in the analyses, it was not related to the test characterization manipulation or to performance on the test and did not qualify any of the other mediational analyses reported in the paper. To form scales from the factors we added together participants’ responses to the items that loaded on each factor.
7In the regression analyses that are reported here we controlled for SAT to avoid leaving out a potentially important factor in the regression equation. By including SAT in the equation two women were excluded from the analysis because they failed to report their SAT scores. When SAT is not controlled for in the analyses, the results remain much the same and the basic interpretation of the data remains unqualified, although both the effect of anxiety on performance and the direct effect of the test characterization manipulation on performance are somewhat stronger.
8The means and standard deviations for each of the mediational measures for women in the experimental group and women in the control group, respectively, were as follows: anxiety M58.16,
included the test characterization manipulation. Women’s performance on the test was the dependent variable. This analysis revealed that anxiety was significantly related to performance (b 5 20.40, T(28)51.98, p,.05), evaluation apprehen-sion was significantly related to performance (b 5.57, T(28)52.61, p,.05), and self-efficacy was not significantly related to performance (b 5.20, T(28)5.96, p..30). Furthermore, when these mediators were included in the equation, the effect of the test characterization manipulation on test performance was reduced to nonsignificance (b 5.22, T(28)51.26, p..10). Thus this analysis revealed that anxiety and evaluation apprehension were related to test performance, but self-efficacy was not.
To provide an additional test of the mediational hypothesis we planned to examine each of the variables alone as a mediator. However, evaluation apprehen-sion was positively related to performance, while anxiety was negatively related to performance and since these variables are positively correlated with each other (r5.69) they show a suppressor relationship.9 This means that the effect of anxiety and evaluation apprehension on performance if considered alone would be muted by the suppressor effect. To correct for this problem we created two new variables by regressing participants’ evaluation apprehension scores onto their anxiety scores and vice versa and saving the resulting residual scores. This
9Although evaluation apprehension was related to performance, it was actually related to perfor-mance in the opposite direction to what was expected. Women in this study performed better when they had higher evaluation apprehension than when they had lower evaluation apprehension. Despite the largebfor evaluation apprehension it would actually be nonsignificant using the one-tailed tests that we have used throughout these regression analyses because it is in the nonpredicted direction. As this might be misleading we reported the two-tailed test in the body of the paper.
TABLE 1
THETHREESCALESCORRESPONDING TO THEPOTENTIALMEDIATIONALVARIABLES DERIVED FROMFACTORANALYSIS
Evaluation apprehension scale (Cronbach’sa 5.82)
1. People will think I have less ability if I do not do well on this test. 2. People will look down on me if I do not do well on this test. 3. If I don’t do well on this test, others may question my ability. 4. If I do poorly on this test, people will look down on me. 5. I feel self-confident.
Self-efficacy scale (Cronbach’sa 5.88)
1. I am uncertain I have the mathematical knowledge to do well on this test.
2. I am concerned about whether I have enough mathematical ability to do well on the test. 3. I doubt I have the mathematical ability to do well on the test.
4. I can handle the test. Anxiety scale (Cronbach’sa 5.88)
1. I am worried. 2. I feel nervous. 3. I am jittery. 4. I feel indecisive.
provided us with a measure of anxiety that was not affected by the suppressor relationship with evaluation apprehension and a measure of evaluation apprehen-sion that was not affected by the suppressor relationship with anxiety. These variables can be understood as the part of anxiety that is not explained by evaluation apprehension and the part of evaluation apprehension that is not explained by anxiety. We then tested each of these variables and the self-efficacy measure individually as possible mediators of the effect of the stereotype threat manipulation on women’s math scores.
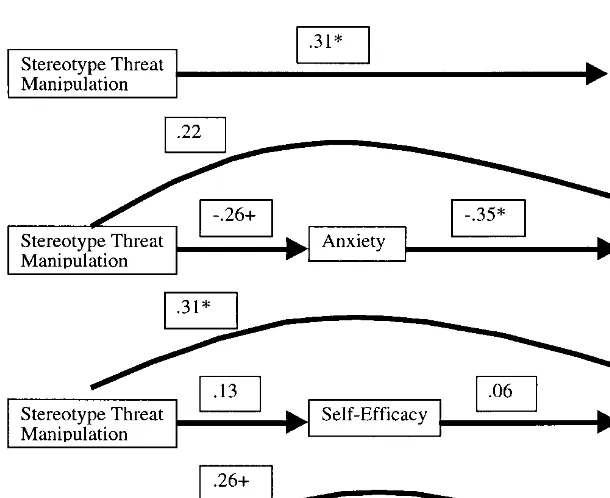
To conduct these analyses we first regressed the stereotype threat manipulation onto each of the possible mediators. Then we conducted a hierarchical regression with the potential mediator on the first block and the stereotype threat manipula-tion on the second block. As can be seen in Fig. 4, the part of anxiety that is not explained by evaluation apprehension may show some evidence of mediation of the stereotype threat manipulation in this experiment. The stereotype threat manipulation had a marginally significant effect on this part of anxiety, and this anxiety in turn was negatively related to performance, and when this variable was included with the stereotype threat manipulation in a regression analysis, the effect of the stereotype threat manipulation was somewhat weakened and was no longer significant. The test for the change in significance for the direct path from the stereotype threat manipulation to score on the test when anxiety was included in the analysis did not reach significance, however, Z51.08, p5.14. This result suggests that we have not found strong evidence of anxiety as a mediator of performance in this experiment. It does not, however, allow us to rule out anxiety as a mediator. Anxiety still might be a mediator of the manipulation in this experiment, particularly if it was measured with error (see Baron & Kenny, 1986). Self-efficacy and the part of evaluation apprehension that was not related to anxiety did not show evidence of mediation. There was no reliable evidence that self-efficacy was effected by the stereotype threat manipulation and self-efficacy did not predict test performance and, thus, there was no evidence that self-efficacy mediated the effect of the stereotype threat manipulation on women’s test performance. Also, even though evaluation apprehension was related to women’s performance, its being unaffected by the stereotype threat manipulation means that we did not find evidence that evaluation apprehension was a mediator of the effect of stereotype threat on test performance either. However the failure of these variables to mediate the effects in this study must be interpreted with caution given our relatively small sample size and therefore our limited power to detect mediation.
neither do they rule anxiety out as a mediator—anxiety is still a plausible mediator of the stereotype threat effects seen in these studies.
GENERAL DISCUSSION
Being the potential target of a negative group stereotype, we have argued, creates a specific predicament: in any situation where the stereotype applies, behaviors and features of the individual that fit the stereotype make it plausible as a explanation of one’s performance. We call this predicament stereotype threat. The crux of our argument is that collectively held stereotypes in our society establish this kind of threat for women in settings that involve math performance, especially advanced math performance. The aim of the present research has been to show that this threat can quite substantially interfere with women’s math performance, especially performance that is at the limits of their skills, and that factors that remove this threat can improve that performance.
The three experiments reported here provide strong and consistent support for this reasoning. Study 1 replicated the finding in the literature that women underperform on advanced tests but not on tests more within their skills. Study 2 attempted to directly manipulate stereotype threat by varying how the test was characterized—as one that generally found gender differences or as one that did
not. Representing test performance as unaffected by gender, we reasoned, would make the gender stereotype irrelevant as an interpretation of test performance, preclude stereotype threat, and thereby allow women to match the performance of equally qualified men. This is precisely what happened in this condition, while in the condition where the same test was represented as affected by gender, women again underperformed in relation to men. Finally, Study 3 replicated the results of Study 2 with a less highly selected population and identified anxiety as a possible mediator of this effect.
These findings also speak to the generality of stereotype threat’s negative effect on standardized test performance. Other research (Steele & Aronson, 1995; Croizet & Claire, 1998) has shown that stereotype threat can interfere with the performance of African–American and low socioeconomic students on difficult standardized tests. Thus, by showing a comparable effect among women test takers, the present findings help to establish the generality across groups of stereotype threat’s impairment of standardized test performance.
This is not to say that there are no important differences in the way that stereotype threat affects different groups. We believe that such important differ-ences do exist. For example, the nature of the stereotype about women’s math ability is different than the stereotype about African–Americans’ ability in school. The stereotype about women is relatively confined—pertaining mainly to math and science—whereas the stereotype about African–Americans is relatively broad, impugning almost all academic areas, which may lead to important differences in the way stereotype threat affects women and African–Americans. When women face stereotype threat in a math class, for instance, they can avoid it by dropping math and picking up most other classes. African–Americans, however, face a much more difficult problem when they face stereotype threat in school. For them it will be much more difficult to avoid. Women can still maintain a view of themselves as smart and capable, but just not good in math, if they disidentify with math. African–Americans, however, are likely to find it much more difficult to maintain a view of themselves as smart and capable, but just not able to cut it at school, if they disidentify with school. This reasoning suggests that stereotype threat may lead women to disidentify with math more readily than it leads African–Americans to disidentify with school.
The Mediation of Stereotype Threat Effects
psychological state marked by cognitive activation of racial stereotypes and strong motivation to avoid being judged by such stereotypes—a distinct state that accompanies stereotype threat. We have assumed that this state is experienced as a greater degree of self-evaluative threat—arising from their extra risk of fulfilling a negative group stereotype—and threat of this sort is likely to increase their emotionality (Baumeister & Showers, 1986; Geen, 1991; Sarason, 1972; Schlen-ker & Leary, 1982; Wine, 1971).
The present studies tested this reasoning more directly. We found evidence that stereotype threat tended to increase anxiety, but we found little evidence that such emotionality mediates the observed stereotype threat effects. In particular, we found that anxiety showed only weak evidence of mediation and that evaluation apprehension and self-efficacy as we measured them in this study did not mediate the observed stereotype threat effects. These results suggest that the emotionality that we assumed undermined people’s performance when they experienced stereotype threat may accompany their performance but have little impact upon it. However, we should approach this conclusion with caution. There are several reasons why it may not be the final story on the mediation of stereotype threat effects. First, in Study 3 where we examined mediation, we only had 34 women, a relatively small sample to detect mediation. This limited power means that the lack of mediational evidence should be interpreted with caution. Second, in other situations and with other groups of subjects, the effects of stereotype threat may be mediated differently and some of the factors that we examined here that failed to show mediation might with other groups or in different situations. For example, in some situations, the mediation of stereotype threat effects may involve expectation effects. Lower expectations about both performance and self-efficacy are, after all, inherent parts of the stereotypes we are considering. Thus it is quite possible that the priming of these stereotypes in the stereotype threat conditions could lower expectations among the stereotyped. And this, in turn, could under-mine their performance by undermining their motivation to perform (e.g., Bandura, 1977, 1986). Now Study 3 shows, we believe, that the effects of stereotype threat in the present experiments were not mediated in this way. Women’s performance expectations were not significantly affected by the stereo-type threat manipulation and were not related to their test performance. This result is important in showing that stereotype threat has effects on performance that go beyond any effect it has on expectations and that it was these extra expectation effects that mediated the present results.
this threatening environment extends—as in the school settings to which we want to generalize—expectations may play a more important mediational role. If this proves to be so, then a contribution of the present research is its identifying a new set of conditions that affect these expectations, namely, stereotype threat.
Thus the question of how stereotype threat effects are mediated is a complex one. Certainly in real-life settings these effects are likely to be multiply mediated, involving several processes at once, anxiety, overcautiousness, lowered expecta-tions, and so on. Thus a central challenge of ongoing research will be to discover which mediation occurs under which conditions.
Stereotype Threat and the Genetic Interpretation of Gender Differences in Math Ability
Our research also has implications for the lingering controversy over the role of biology versus the environment in determining the few sex differences that persist in mathematics performance. In its most recent incarnation, this issue has centered on the claims of Benbow and Stanley (1980, 1983). This much-cited research studied a group of seventh and eighth grade boys and girls, exceptionally talented in math, who scored above 700 on the quantitative section of the SAT. Boys were overrepresented in this group by a factor of 10 to 1. And since these boys and girls all had the same prior course work in math, the authors took this fact to indicate a sex difference in biological capacity for math.
The critical factor may be the stereotype threat of the immediate test-taking situation.10
Finally, in the interest of careful generalization, we note several important parameters of the stereotype threat effect. It assumes that the test taker construes the test as a fairly valid assessment of math ability, that they still care about this ability at least somewhat, and that the test be difficult. Stereotype threat effects should be less likely if the test is either too easy or too difficult (either in item content or time allotted) to be seen as validly reflecting ability. Also, if the test taker has already disidentified with math, in the sense of not caring about their performance, stereotype threat is not likely to drive their performance lower than their lack of motivation would. Thus, it is only when the test reflects on ability and is difficult and the test takers care about this ability that the stereotype becomes relevant and disturbing as a potential self-characterization. For this reason, stereotype threat probably has its most disruptive real-life effects on women as they encounter new math material at the limits of their skills—for example, new work units or a new curriculum level.
This process may also contribute to women’s high attrition from quantitative fields, especially math, engineering, and the physical sciences, where their college attrition rate is 21⁄
2 times that of men (Hewitt & Seymour, 1991). At some point,
continuously facing stereotype threat in these domains, women may disidentify with them and seek other domains on which to base their identity and esteem. While other factors surely contribute to this process—gender-role orientation (Eccles, 1984; Eccles et al., 1990; Yee & Eccles, 1988), lack of role models (Douvan, 1976; Hackett, Esposito, & O’Halloran, 1989), and differential treatment of males and females in school (Constantinople et al., 1988; Peterson & Fennema, 1985)—we suggest that stereotype threat may be an underappreciated source of these patterns.
Embedded in our analysis is a certain hopefulness: the underperformance of women in quantitative fields may be more tractable than has been assumed. It
attempts to understand the math performance of women not in terms of internal characteristics (e.g., abilities or internalized cultural orientations) but in terms of the interaction between the individual and a threatening predicament posed by societal stereotypes. Predicaments are circumstantial and thus should be easier to change than internalized characteristics. And though our experimental manipula-tions have yet to establish broadly generalizable strategies for changing this predicament, they do show that it can be changed.
REFERENCES
Adorno, T. W., Frenkel-Brunswick, E., Levinson, D. J., & Sanford, R. N. (1950). The authoritarian
personality. New York: Harper.
Allport, G. W. (1954). The nature of prejudice. Cambridge, MA: Addison–Wesley.
Armstrong, J. M. (1981). Achievement and participation of women in mathematics: Results from two national surveys. Journal of Research in Mathematics Education, 12, 356–372.
Ashmore, R. D., & Del Boca, F. K. (1981). Conceptual approaches to stereotypes and stereotyping. In D. L. Hamilton (Ed.), Cognitive process in stereotyping and intergroup behavior (pp. 1–35). Hillsdale, NJ: Erlbaum.
Bandura, A. (1977). Social learning theory. Englewood Cliffs, NJ: Prentice Hall.
Bandura, A. (1986). Social foundations of thought and action: A social cognitive theory. Englewood Cliffs, NJ: Prentice Hall.
Baron, R. M., & Kenny, D. A. (1986). The moderator-mediator variable distinction in social psychological research: Conceptual, strategic, and statistical considerations. Journal of
Personal-ity and Social Psychology, 51, 1173–1182.
Baumeister, R. F., & Showers, C. J. (1986). A review of paradoxical performance effects: Choking under pressure in sports and mental tests. European Journal of Social Psychology, 16, 361–383. Benbow, C. P., & Stanley, J. C. (1980). Sex differences in mathematical ability: Fact or artifact?
Science, 210, 1262–1264.
Benbow, C. P., & Stanley, J. C. (1983). Sex differences in mathematical reasoning ability: More facts.
Science, 222, 1029–1031.
Brewer, M. B. (1979). In-group bias in the minimal intergroup situation: A cognitive-motivational analysis. Psychological Bulletin, 86, 307–324.
Constantinople, A., Cornelius, R., & Gray, J. (1988). The chilly climate: Fact or artifact? Journal of
Higher Education, 59, 527–550.
Crandall, (1969). Sex differences in expectancy of intellectual and academic reinforcement. In C. P. Smith (Ed.), Achievement-related behaviors in children. New York: Russell Sage Found. Crocker, J., & Major, B. (1989). Social stigma and self-esteem: The self-protective properties of
stigma. Psychological Review, 96, 608–630.
Croizet, J. C., & Claire, T. (1998). Extending the concept of stereotype threat to social class: The intellectual underperformance of students from low socioeconomic backgrounds. Personality
and Social Psychology Bulletin, 24, 588–594.
Devine, P. (1989). Stereotypes and prejudice: Their automatic and controlled components. Journal of
Personality and Social Psychology, 56, 5–18.
Douvan, E. (1976). The role of models in women’s professional development. Psychology of Women
Quarterly, 1, 5–20.
Duncan, B. L. (1976). Differential social perception and attribution of intergroup violence: Testing the lower limits of stereotyping of blacks. Journal of Personality and Social Psychology, 34, 590–598. Dweck, C. S., & Bush, E. (1976). Sex differences in learned helplessness: I. Differential debilitation
with peer and adult evaluations. Developmental Psychology, 12, 147–156.
Dweck, C. S., & Gilliard, D. (1975). Expectancy statements as determinants of reactions to failure: Sex differences in persistence and expectancy change. Journal of Personality and Social
Eccles, J. S. (1984). Sex differences in achievement patterns. In Sonderegger (Ed.), Nebraska
symposium on motivation (Vol. 32). Lincoln, NE: Univ. of Nebraska Press.
Eccles, J. S. (1987). Gender roles and women’s achievement-related decisions. Psychology of Women
Quarterly, 11, 135–172.
Eccles, J. S., & Jacobs, J. E. (1986). Social forces shape math attitudes and performance. Signs:
Journal of Women in Culture and Society, 11, 367–380.
Eccles, J. S., Jacobs, J. E., & Harold, R. E. (1990). Gender role stereotypes, expectancy effects, and parents’ socialization of gender differences. Journal of Social Issues, 46, 183–201.
Eccles Parsons, J. S., Adler, T. F., Futterman, R., Goff, S. B., Kaczala, C. M., Meece, J. L., & Midgley, C. (1983). Expectations, values, and academic behaviors. In J. T. Spence (Ed.). Achievement and
achievement motivation (pp. 75–146). New York: Freeman.
Eccles Parsons, J. S., & Ruble, D. N. (1977). The development of achievement-related expectancies.
Child Development, 48, 1075–1079.
Educational Testing Service (1987a). Practicing to take the GRE General Exam. Princeton, NJ Educational Testing Service.
Educational Testing Service (1987b). Practicing to take the GRE Mathematics Test. Princeton, NJ: Educational Testing Service.
Ehrlich, H. J. (1973). The social psychology of prejudice: A systematic theoretical review and
propositional inventory of the American social psychological study of prejudice. New York:
Wiley.
Ethington, C. A., & Wolfe, L. M. (1984). Sex differences in a causal model of mathematics achievement. Journal for Research in Mathematics Education, 15, 361–377.
Fennema, E. H. (1981). Women and mathematics: Does research matter? Journal for Research in
Mathematics Education, 12, 380–385.
Fennema, E. H., & Sherman, J. A. (1977). Sex-related differences in mathematics achievement, spatial visualization, and sociocultural factors. American Educational Research Journal, 14, 51–71. Fennema, E. H., & Sherman, J. A. (1978). Sex-related differences in mathematics achievement and
related factors: A further study. Journal for Research in Mathematics Education, 9, 189–203. Frable, D. E. (1989). Marginal and mindful: Deviants in social interaction. Journal of Personality and
Social Psychology, 59, 140–149.
Gaertner, S. L., & Dovidio, J. F. (1986). The aversive form of racism. In J. F. Dovidio, & S. L. Gaertner (Eds.) Prejudice, discrimination, and racism (pp. 61–90). New York: Academic Press.
Geen, R. G. (1991). Social motivation. Annual Review of Psychology, 42, 377–399.
Goffman, E. (1963). Stigma: Notes on the management of spoiled identity. New York: Touchstone. Hamilton, D. L. (1979). A cognitive-attributional analysis of stereotyping. In L. Berkowitz (Ed.)
Advances in experimental social psychology (Vol. 12, pp. 53–84). New York: Academic Press.
Hackett, G., Esposito, D., & O’Halloran, M. S. (1989). The relationship of role model influence to the career salience and educational and career plans of college women. Journal of Vocational
Behavior, 35, 164–180.
Hewitt, N. M., & Seymour, E. (1991). Factors contributing to high attrition rates among science and
engineering undergraduate majors. Report to the Alfred P. Sloan Foundation.
Hilton, T. L., & Lee, V. E. (1988). Student interest and persistence in science: Changes in the educational pipeline in the last decade. Journal of Higher Education, 59, 510–526.
Hyde, J. S., Fennema, E. H., & Lamon, S. J. (1990). Gender differences in mathematics performance: A meta-analysis. Psychological Bulletin, 107, 139–155.
Jacobs, J. E., & Eccles, J. S. (1985). Gender differences in math ability: The impact of media reports on parents. Educational Researcher, 14, 20–25.
Jones, E. E., Farina, A., Hastorf, A. H., Markus, H., Miller, D. T., & Scott, R. A. (1984). Social Stigma. New York: Freeman.
Jordan (1968). White over black: American attitudes toward the Negro. Chapel Hill, NC: Univ. of North Carolina Press.
Katz, D., & Braly, K. W. (1933). Racial stereotypes of 100 college students. Journal of Abnormal and
Kimball, M. M. (1989). A new perspective on women’s math achievement. Psychological Bulletin,
105, 198–214.
Leinhardt, G., Seewald, A., & Engel, M. (1979). Learning what’s taught: Sex differences in instruction. Journal of Educational Psychology, 71, 432–439.
Levine, D. U., & Ornstein, A. C. (1983). Sex differences in ability and achievement. Journal of
Research and Development in Education, 16, 62–72.
Major, B., Spencer, S. J., Schmader, T., Wolfe, C., & Crocker, J. (1998). Coping with negative stereotypes about intellectual performance: The role of psychological disengagement.
Personal-ity and Social Psychology Bulletin, 24, 34–50.
Markus, H. (1977). Self-schemata and processing information about the self. Journal of Personality
and Social Psychology, 35.
Meece, J. L., Eccles, J. S., Kaczala, C. M., Goff, S. B., & Futterman, R. (1982). Sex differences in math achievement: Towards a model of academic choice. Psychological Bulletin, 91, 324–348. Peterson, P. L., & Fennema, E. (1985). Effective teaching, student engagement in classroom activities,
and sex-related differences in learning mathematics. American Educational Research Journal,
22, 309–335.
Rokeach, M., & Mezei, L. (1966). Race and shared beliefs as factors in social choice. Science, 151, 167–172.
Rothbart, M. (1981). Memory processes and social beliefs. In D. L. Hamilton (Ed.) Cognitive
processes in stereotyping and intergroup behavior. Hillsdale, NJ: Erlbaum.
Sagar, H. A., & Schofield, J. W. (1980). Racial and behavioral cues in black and white children’s perceptions of ambiguously aggressive cues. Journal of Personality and Social Psychology, 39, 590–598. Sarason, I. G. (1972). Experimental approaches to test anxiety: Attention and the uses of information.
In Spielberger, C. D. (Ed.), Anxiety: Current trends in theory and research (Vol. 2). New York: Academic Press.
Schlenker, B. R., & Leary, M. R. (1982). Social anxiety and self-presentation: A conceptualization and model. Psychological Bulletin, 92, 641–669.
Sherman, J. A., & Fennema, E. H. (1977). The study of mathematics by high school girls and boys: Related variables. American Educational Research Journal, 14, 159–168.
Smith, E. R., & Zarate, M. A. (1992). Exemplar-based model of social judgment. Psychological
Review, 99, 3–21.
Spielberger, C. D., Gorsuch, R. L., & Lushene, R. E. (1970). Manual for the State-Trait Anxiety
Inventory. Palo Alto, CA: Consulting Psychologist Press.
Steele, C. M. (1992). Race and the schooling of Black Americans. Atlantic Monthly, April, 68–78. Steele, C. M. (1997). A threat in the air: How stereotypes shape intellectual identity and performance.
American Psychologist, 52, 613–629.
Steele, C. M., & Aronson, J. (1995). Contending with a stereotype: African-American intellectual test performance and stereotype threat. Journal of Personality and Social Psychology, 69, 797–811. Steele, S. (1990). The content of our character: A new vision of race in America. New York: St.
Martin’s Press.
Steinkamp, M. W., & Maehr, M. L. (1983). Affect, ability, and science achievement: A quantitative synthesis of correlation research. Review of Educational Research, 53, 369–396.
Swim, J. K. (1994). Perceived versus meta-analytic effect sizes: An assessment of the accuracy of gender stereotypes. Journal of Personality and Social Psychology, 66, 21–36.
Swim, J. K., & Stangor, C. (1998). Prejudice: The target’s perspective. New York: Academic Press. Tajfel, H. (Ed.). (1978). Differentiation between social groups. New York: Academic Press. Wigfield, A., & Eccles, J. S. (1989). Test anxiety in elementary and secondary school students.
Educational Psychologist, 24, 159–183.
Wigfield, A., & Meece, J. (1988). Math anxiety in elementary and secondary school students. Journal
of Educational Psychology, 80, 210–216.
Wine, J. (1971). Test anxiety and direction of attention. Psychological Bulletin, 76, 92–104. Yee, D. K., & Eccles, J. S. (1988). Parent perceptions and attributions for children’s math