Journal of Economics and Sustainable Development www.iiste.org
In operating their farms, Virginia tobacco farmers establish partnerships with a number of companies, such as Company GG and Company BB. The level of tobacco production efficiency obtained is considered to be dependent on the experiences of the partner companies. This study aims to analyze the technical efficiency and the economies of scale of Virginia tobacco farming in Buleleng regency, Bali. Employing a survey method, census was conducted on a total of 87 respondents. Data was analyzed using a non-parametric approach, with a data envelopment analysis (DEA) model. Results show that based on planting location and acreage, the technical efficiency of Company GG partners is relatively higher than that of Company BB. The efficiency scale (SE = 1) revealed that farmers participating under the Company GG partnership is relatively more efficient compared to Company BB farmers. Further, the economies of scale score based on planting location show that the majority of Company GG farmers experience constant return to scale (CRS) category, while most Company BB farmers fall under the decreasing return to scale (DRC) category. A slightly different result is displayed by the economies of scale analysis based on acreage, where the majority of Company GG farmers with up to 4 ha of planting area is under the increasing return to scale (IRS), while farmers with >4 ha to 6 ha of planting area is under the decreasing return to scale (DRS) category. For Company BB farmers with up to 2 ha of planting area, 50% are experiencing constant return to scale (CRS) and 50% are experiencing increasing return to scale (IRS). Meanwhile, those who have >2 ha up to 6 ha, fall under the decreasing return to scale (DRS) category.
Keywords: efficiency, Virginia tobacco, partnership, data envelopment analysis, Bali
1. Introduction
Tobacco, as a strategic and prioritized commodity in Indonesia, has historically gained considerable attention since the Dutch colonialization. The tobacco planting policy has been continued by the Indonesian government through the state plantation company. Tobacco cultivation is fairly widespread both in Java and outside Java (Saptana et al., 2001).
To date, the livelihoods of millions of Indonesians depend on the economy of tobacco. Tobacco farming has created employment for hundreds of thousands of farmers and agriculture laborers. The same is true for the tobacco processing industry. In the 2014 state budget (Anggaran Pendapatan dan Belanja Negara - APBN), the government received as much as IDR 100.7 trillion from tobacco taxes. The role of tobacco in the Indonesian economy is considered significant, in fact during the 1997-1998 economic crisis, the economy of tobacco continued to thrive and became a mainstay for the country’s foreign exchange (Kinasih, 2012).
The Indonesian government remains to have a high expectation on tobacco, which is demonstrated by the increase in targeted income from tobacco taxes to IDR 120.5 trillion in the 2015 state budget. This implies that the government implicitly recognizes the potency of tobacco to play a major role in increasing the citizens’ welfare. Ironically, although there is an increasing trend of revenue from tobacco in the state budget, the government has gradually issued a policy that is less conducive to the economy of tobacco.
The government policy that discontinued the provision of fertilizer subsidy for tobacco cultivation has forced tobacco farmers to purchase fertilizers at the market level price. This results in a significant increase in production costs, as tobacco cultivation requires a large amount of fertilizers. Tobacco farmers are also exposed to scarcity of fertilizers in the market. When tobacco farmers are faced with this issue, they are disadvantages in two ways, first, farmers pay for fertilizers at a higher price, and second, farmers disregards the standard of fertilizer use which affects the quantity and quality of harvest.
The government policies that impose the conversion of kerosene to gas also increase the production cost of dried tobacco. Farmers that originally dry their tobacco leaves using subsidized kerosene, now have to use non-subsidized gas, which result in 50% of the production cost allocated for gas. This creates a significant obstacle for farmers to produce dried tobacco.
Journal of Economics and Sustainable Development www.iiste.org ISSN 2222-1700 (Paper) ISSN 2222-2855 (Online)
Vol.6, No.14, 2015
131
pictures of the effects of smoking on cigarette packages, which increase production costs. Moreover, the government has also limit public smoking areas through provincial and regency level regulations. These policies have systematically pressurized the existence of tobacco.
A real proof of the shift in the government’s support for the development of national tobacco is demonstrated in the change of the Tobacco and Fiber Crops Research Broad to Sweetener and Fiber Crops Research Broad. The elimination of the word ‘tobacco’ from the research broad’s name, demonstrates the decreasing government interest in developing national tobacco cultivation. The accumulation of less conducive government policies has resulted in the decreasing trends in tobacco production and planting areas. In 2000, the national tobacco planting area was 239,737 ha, with production of 204,329 tons. These has decrease to 209,454 ha and 185,619 tons respectively, in 2013.
In Bali, tobacco production and planting areas has also decreased during the 2000-2013 period, particularly for Virginia tobacco in Buleleng regency. In 2000, tobacco planting area was 867 ha, with production of 1685,273 tons. In 2013, this has decreased to 380 ha and 750 tons respectively. Apart from the decreasing trend in planting area and production, pressure from government policies has affected the production efficiency and economies of scale of Virginia tobacco production.
The achievement of production efficiency for Virginia tobacco farming is believed to be related to the experiences of the partner company. In operating their farm, tobacco farmers establish partnerships with companies, such as Company GG and Company BB. These companies provide farming inputs and monitor production process to ensure standard quality and quantity. The company strictly monitors and evaluates the production process. The intervention of the partner company is believed to contribute to the technical efficiency of Virginia tobacco farming in Buleleng, Bali.
At a global scale, the ASEAN and global free trade scheme provide a new challenge for Virginia tobacco farming to be more efficient and competitive in order to survive. Efficiency is deemed to be a prerequisite to successfully compete in the global market. Inefficient production process will lead to significant loss. As such, there is an urgency to analyze technical efficiency as one of the indicators of farm-level efficiency. Results from this analysis could be used to develop methods to strengthen the existence of Virginia tobacco
Based on the above research questions, the objectives of this present study are as follows:
1. To analyze the technical efficiency of partnership based Virginia tobacco farming in Buleleng regency, Bali province.
2. To analyze the economies of scale of partnership based Virginia tobacco farming in Buleleng regency, Bali province.
2. Research Methods 2.1 Location of Study
This study was conducted in Buleleng regency, Bali province, Indonesia. This location was determined purposively, considering the following:
1. Buleleng regency is the only regency in Bali where farmers cultivate Virginia tobacco.
2. Tobacco farmers in Buleleng regency have been cultivating Virginia tobacco for 3 years consecutively. Further, this study is focused on three districts, with the largest acreage of Virginia tobacco plantation. Based on data from the Buleleng Regional Office of Plantation and Forestry, Sukasada, Buleleng, and Gerokgak are the three districts with the largest planting area in 2014.
2.2 Population and Sample
The population of this study is farmers who plant Virginia tobacco in Buleleng regency, where there are 87 farmers. A census method was employed, in which all farmers who cultivate Virginia tobacco were selected as respondents. These farmers comprised of 68 farmers participating under the partnership with Company GG, while 19 farmers participating under partnership with Company BB. Apart from farmers, this study also selected respondents from The Indonesian Association of Tobacco Farmers (Asosiasi Petani Tembakau Indonesia-APTI) in Buleleng regency, partner company, and Buleleng Regional Office of Plantation and Forestry.
2.3 Data Collection
Journal of Economics and Sustainable Development www.iiste.org ISSN 2222-1700 (Paper) ISSN 2222-2855 (Online)
Vol.6, No.14, 2015
132
Primary data collected, comprise of Virginia tobacco farmer characteristics, production costs, production data, and Virginia tobacco sale. Secondary data was collected from institutions related to this study, such as National Bureau of Statistics, Regional Office of Plantation and Forestry, partner company, publications, and on line media.
2.4Data Analysis
Numerous studies have suggested a number of alternative approaches to estimate technical efficiency (Battese dan Coelli, 1995; Tadesse dan Krishnamoorthy, 1997; Ruggiero, 1999; Liu, 2000, Iraizoz, 2003; Binam et al., 2004; Obwana, 2006; Bozoglu dan Ceyhan, 2007; Sadiq et al., 2009; Tipi et al., 2010; Kay and Yabe, 2011, Heidari et al., 2011; Karimov, 2013). In general, the estimation of technical efficiency can be categoriesed into two major approaches, namely parametric and non-parametric frontier. Parametric models can be further categorized into deterministic and stochastic models. The deterministic model assumes that deviation from the frontier is caused by inefficiency, while the stochastic model allow the assumption of errors.
This study refers to the non-parametric data envelopment analysis (DEA) approach to estimate technical efficiency. This model is based on a mathematical programming technique. A major characteristic of the DEA model is that it does not require a specific assumption for the technology function, unlike the parametric model. The DEA model can be categorized into the deterministic model group. A number of studies have employed the DEA method to estimate technical efficiency, including Tipi et al.(2010); Heidari et al.(2011); Abatania et al. (2012); Jatto et al. (?); Mahjoor (2013); and Karimov (2013).
Data was analyzed using a data envelopment analysis (DEA) model. DEA model is commonly used to evaluate the efficiency of producers. Coelli (1995) identified two advantages of DEA model in estimating efficiency. First, the estimation does not require assumptions in the specific forms of the function between input and output. Second, it does not require assumptions on inefficiency distributions.
Technical efficiency is an optimal combination of input to achieve a certain amount of output (input oriented) or obtaining an optimal amount of output from a certain amount of input (output oriented). This analysis is input oriented, as tobacco farmers have greater control over input, compared to output. Coelli et al.
(1998) asserts that the DEA constant return to scale (CRS) model is appropriate when all producers operate efficiently. The imperfect market and constraints in financing, may have cause farmers to be unable to produce at an optimal scale. Apart from that, in the case of the agriculture sector, when the volume of irrigation and fertilizer usage increase are not followed by proportional increase in plantation volume. Based on the aforementioned reasonings, this study utilize the DEA input oriented variable return to scale (VRS) model to estimate technical efficiency. The DEA model used to estimate technical efficiency under the assumption variable return to scale (VRS) was first developed by Banker et al. (1984), and was referred as the BBC (Banker, Chames and Cooper) model. Coelli et al. (1998) formulated the DEA input oriented variable return to scale (VRS) model, with N number of producers, producing M unit of output, using K amount of inputs, as follows:
Journal of Economics and Sustainable Development www.iiste.org ISSN 2222-1700 (Paper) ISSN 2222-2855 (Online)
Vol.6, No.14, 2015
133
Table 1. Descriptive Statistics of Input and Output
Variable Unit Company GG Farmers (n=68) Company BB Farmers (n=19)
Mean SD Min Max Mean SD Min Max
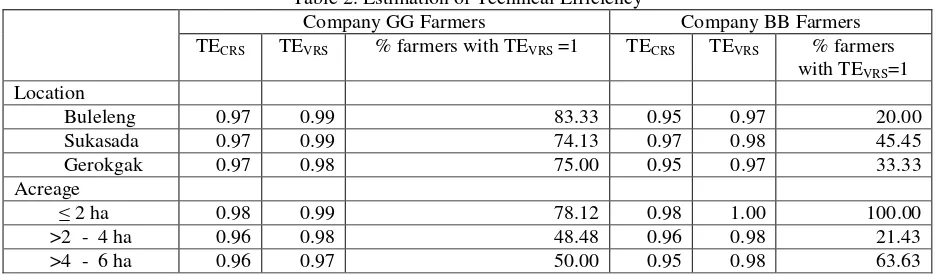
Table 2 displays the technical efficiency of partnership based Virginia tobacco farming in Buleleng, according to planting location and acreage (planting area). Producers participating under the Company GG partnership have a higher technical efficiency based on location and acreage compared to producers participating under Company BB partnership. The average TECRS score for Company GG partners in Buleleng, Sukasada, and Gerokgak
districts is 0.97. This implies that Virginia tobacco farmers in Buleleng, Sukasada, and Gerokgak are able to reduce their input up to 3% and still maintain the same amount of output. The same TECRS score achieved in
these three districts demonstrate that Company GG imposes a strict control over the production process.
By eliminating the inefficiency scale, Virginia tobacco farming in Buleleng and Sukasada district may increase the average of technical efficiency from 0.97 to 0.99. Meanwhile farmers in Gerokgak district may increase their technical efficiency from 0.97 to 0.98. This implies that with the elimination of inefficiency, Virginia tobacco producers in Gerokgak obtain a lower rate of technical efficiency compared to farmers operating in Buleleng and Sukasada.
Based on planting area, Company GG farmers with an average acreage of 2 ha are able to achieve higher TECRS and TEVRS compared to farmers with larger acreage. Furthermore, farmers with 2 ha land will be
able to reduce their input usage up to 2%, while maintaining the same amount of output produced. Furthermore, by eliminating the inefficiency rate, the technical efficiency can be increased from 0.98 to 0.99.
A different condition is observed in farmers with >2 ha to 4 ha and >4 ha to 6 ha acreage, that has a 4% inefficiency rate. This inefficiency rate is higher than that of farmers with 2 ha land. Farmers operating with aforementioned acreage will be able to reduce 4% of their input usage to produce the same amount of output. If farmers are able to eliminate efficiency, they would be able to increase their technical efficiency from 0.96 to 0.98. Farmers with larger acreage are exposed to larger constraints to achieve efficiency in input usage.
With regard to the Company BB partnership, farmers in Sukasada district obtained an average of 0.97 TECRS score, which is higher compared to farmers operating in Buleleng and Gerokgak district, with TECRS score
Journal of Economics and Sustainable Development www.iiste.org
operating with land between >4 ha and 6 ha is the highest among the partnership group, which reached up to 5%. This implies that to achieve the same amount of output, producers are still able to reduce their input usage up tp 5%. This analysis also shows that 2 ha per decision making unit (DMU) is the most optimal land size for Virginia tobacco farming operation in both companies. Increasing land acrage from the optimum 2 ha may lead to greater inefficiency.
The average technical efficiency for Virginia tobacco farms in Buleleng district is 0.96, which implies a 4% inefficiency of inpute usage. The achievement of 96% technical efficiency in Buleleng district can be categorized to be high efficiency. This can be compared to a study conducted by Ilembo and Kuzilwa (2014) on technical efficiency analysis for tobacco farming in Tanzania. The study yield a technical efficiency score of 64%, concluding that the studies tobacco farm in Tanzania experience 36% inefficiency in input usage.
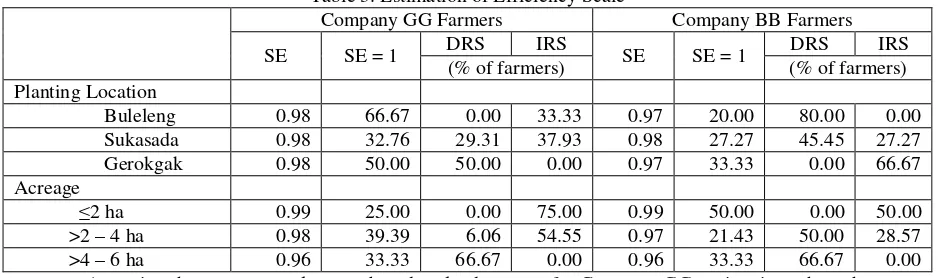
3.2 Economies of scale
Assessing the efficiency scale, displayed in Table 3, Company GG farmers are more efficient compared to Company BB farmers, based on farming location and land acreage. The efficiency score demonstrates whether efficiency can be obtained from improving the size of farming operation. Due to the high efficiency score of Company GG farmers, there is limited room for farmers to improve their scale of operation. Efficiency scores at the 0.98 and 0.99 level demonstrate that the farming operation is close to optimal.
Company GG farmers operating in Buleleng and Gerokgak district are mostly under the constant return to scale (CRS) category. While Company GG farmers in Sukasada district are mostly under the increasing return to scale (IRS) category. With regard to Company BB, the majority of farmers in Buleleng and Sukasada district are experiencing decreasing returns to scale (DRS) farming operation. Meanwhile, the majority (66.67%) of Company BB farmers operating in Gerokgak are experiencing increasing return to scle (IRS). Comparing the farming operation between the two partnerships, it can be concluded that the majority of Company GG farmers fall under the contrant returns to scale category, while the majority of Company BB partners fall under the decreasing return to scale. A farm experiencing increasing return to scale will benefit from increasing their production scale, while the contrary is true for a farm that are experiencing decreasing return to scale. Similarly, when a farm is operating under the optimum scale, it does not require changing its production scale as the
Assessing the return to scale score based on land acreage for Company GG, estimations show that most farmers with up to 4 ha land experience increasing return to scale, while the majority of farmers with >4 ha to 6 ha experience decreasing return to scale. A different condition is observed in the Company BB partnership. The majority of farmers with up to 2 ha of land experience increasing return to scle, while those with >2 ha to 6 ha land fall under the decreasing return to scale category. This implies that Company GG farmers with >4 ha to 6 ha and Company BB farmers with >2 ha to 6 ha should reorganize the combination of input usage to decrease inefficiency in their farming operation. However, accrding to Tipi et al. (2009), the cause of inefficiency is the inappropriate scale of operation and misallocation of resources. Inappropriate scale of operation restrict the farmers from receiving profits from economies of scale, while misallocation of resources demonstrate the inefficiency of input usage.
Journal of Economics and Sustainable Development www.iiste.org ISSN 2222-1700 (Paper) ISSN 2222-2855 (Online)
Vol.6, No.14, 2015
135 5. Conclusion
Based on both planting location and land acreage, the technical efficiency of Company GG farmers is relatively higher than that of Company BB. Technical efficiency score of TEVRS = 1 is largely obtained by farmers
participating under Company GG partnership. Based on the efficiency scale (SE = 1), Company GG farmers are relatively more efficient compared to Company BB farmers.
With regard to economies of scale based on planting location, the majority of Company GG farmers experience constant return to scale (CRS), while the majority of Company BB farmers experience decreasing return to scale (DRS). Assessing the economies of scale based on land acreage, the majority Company GG farmers with land up to 4 ha experience increasing return to scale (IRS), while most farmers with >4 ha to 6 ha land experience decreasing return to scale (DRS). Further, 50% of Company BB farmers operating with up to 2 ha of land fall under the constant return to scale (CRS) category, while the rest experience increasing return to scale (IRS). Meanwhile, the majority of farmers with >2 ha to 6 ha land fall under the decreasing return to scale (DRS) category.
To achieve a high technical efficiency and an optimanl efficiency scale (SE = 1), DMU are recommended to operate their tobacco farms with 2 ha acreage. This will allow farmers (DMU) to employ good agriculture practices. It is also recommended that DMU follow strictly company guidelines in input usage, specifically for fertilizer dosage.
Acknowledgement
The authors would like to express their gratitude to virginia tobacco farmers in Buleleng for providing data for this study.
References
Abatania, L.N., Hailu, A., and Mugera, A.W. (2012). Analysis of farm household technical efficiency in Northern Ghana using bootstrap DEA. Paper presented at the 56th annual conference of the Australian Agricultural and Resource Economics Society. The Esplanade Hotel, Fremantle WA, 7-10 February 2012.
Banker, R.D., Chames, A., Cooper, W.W. (1984). Some Models for Estimating Technical and Scale Efficiencies in Data envelopment Analysis. Manage. Sci. 30(9): 1078-1092.
Battese GE., and Coelli TJ. (1995). A model for technical inefficiency effect in stochastic frontier production for panel data. Empirical Econometric, Vol 20 pp 325-345.
Binam, J.N., Tonye, J., Wandji, N., Nyambi, G., and Akoa, M. (2004). Factors affecting the technical efficiency among small holder farmers in the slash and burn agriculture zone of Cameroon. Food Policy, 29, Vol.5. pp 531-545
Bozoghu, M., and Ceyhan, V. (2007). Measuring the technical efficiency and exploring the inefficiency determinant of vegetable farms in Samsun province, Turkey. Agricultural System. Vol 94:649-656. Coelli, T.J. (1995). Recent Developments in Frontier Modelling and Efficiency Measurement. Australian
Journal of Agricultural Economics 39: 219-246.
Coelli, T.J. (1996). A guide in DEAPv21: Data Envelopment Analysis program. CEPA Working Paper 96/08. Department of Econometrics. University of England, Australia. 49 p.
Coelli, T.J, Rao, D.S.P., Battese, G.E. (1998). An Introduction to Efficiency and Productivity Analysis. Boston, Kluwer Academic Publishers. 267 p.
Heidari, M.D., Omid, M., Akram,A. (2011). Using non parametric (DEA) for measuring technical efficiency in poultry farms. Revista Brasileira de Ciencia Avicola, Vol. 13, No. 4.
Ilembu, B., and Kuzilwa, J. (2014). Technical efficiency Analysis of Tobacco Production in Tanzania.
Interdisciplinary Journal of Contemporary Research in Business, Vol.6, No. 3: 246-265.
Iraizoz, B., Rapun, M., and Zabaleta, I. (2003). Assessing the technical efficiency of horticultural production in Navarra, Spain. Agricultural Systems. Vol.78:387-403.
Jatto, N.A., Maikasuwa, M.A., Jabo, M.S.M., and Gunu, U.I. (?). Assessing the technical efficiency level of poultry egg producers in Ilorin, Kwara State: A Data Envelopment Analysis Approach. European Scientific Jurnal, November edition Vol.8, No.27
Kai, H.V., and Yabe, M. (2011). Technical efficiency Analysis of rice production in Vietnam. J.ISSAAS. Vol.17. No. 1, pp 135-146.
Karimov, A. (2013). Productive efficiency of potato and Melon Growing Farms in Uzbekistan: A Two Stage Double Bootstrap Data Envelopment Analysis. Journal Agriculture, 3: 503-515.
Kinasih, H.N. (2012). Tembakau, Negara dan Keserakahan Modal Asing. Jakarta: Indonesia Berdikari.
Liu, Z. (2000). Determinants of technical efficiency in post-collective Chinese Agriculture: evidence from farm-level data. Journal of Comparative Economics, Vol.28:545-
Journal of Economics and Sustainable Development www.iiste.org ISSN 2222-1700 (Paper) ISSN 2222-2855 (Online)
Vol.6, No.14, 2015
136
Iran: A Data envelopment Analysis (DEA) Approach. Word Applied Science Journal 21 (10): 1427-1435
Obwana, M. (2006). Determinants of technical efficiency differentials amongst small and medium scale farmers in Uganda; a case of tobacco growers. AERC Research Paper 152, African Research Consortium. Nairobi.
Ruggiero, J. (1999). Efficiency Estimation and Error Decomposition in the Stochastic Frontier Model; A Monte Carlo Analysis. European Journal of Operational Research, 115: 555-563.
Sadiq, G., Ul-Haq, Z., Ali, F., Mahmood, K., Shah, M., and Khan, I. (2009). Technical efficiency of Maize Farmers in various ecological zones of AJK. Sarhad J. Agric. Vol. 25, No.4
Saptana, Supena, F., dan Purwantini, T.B. (2001). Analisis Daya Saing Komoditi Tembakau Rakyat Di Klaten Jawa Tengah. Bogor: Pusat Penelitian dan Pengembangan Sosial Ekonomi Pertanian.
Tadesse, B., and Krishnamoorthy, S. (1997). Technical efficiency in paddy farms of Tamil Nadu: an analysis based on farm size and ecological zone. Agricultural Economics, Vol.16: 185-192.
Tipi, T., Yildiz, N., Nargelecekenler, M., and Cetin, B. (2009). Measuring the Technical Efficiency and determinants of Efficiency of Rice (Oryza sativa) Farms in Marmara Region, Turkey. New Zealand Journal of Crop and Horticultural Science, Vol 37. 121-129 0014-0671/093702-0121. The royal Society of New Zealand 2009.