JuTISI (Jurnal Teknik Informatika dan Sistem Informasi)
e-ISSN: 2443-2229
Volume 3 Nomor 1 April 2017
Penasehat
: Rektor Universitas Kristen Maranatha
Penanggung jawab
: Dekan Fakultas Teknologi Informasi
Ketua Dewan Redaksi
: Dr. Bernard Renaldy Suteja, S.Kom., M.Kom.
Ketua Penyunting
: Dr. Ir. Mewati Ayub, M.T.
Anggota Penyunting
: Adelia, S.Kom., M.T.
Meliana Christianti Johan, S.Kom., M.T.
Penyunting Pelaksana (Perapih)
: Adelia, S.Kom., M.T.
Mitra Bestari
: Dr. Andi Wahju Rahardjo Emanuel, BSEE., MSSE. (UK. Maranatha)
Yenni Merlin Djajalaksana, Ph.D. (UK. Maranatha)
Dr. Ir. Mewati Ayub, M.T. (UK. Maranatha)
Dr. Hapnes Toba, M.Sc. (UK. Maranatha)
Dr. Bernard Renaldy Suteja, S.Kom., M.Kom. (UK. Maranatha)
Ir. Teddy Marcus Zakaria, M.T. (UK. Maranatha)
Radiant Victor Imbar, S.Kom., M.T. (UK. Maranatha)
Prof. Dr. Richardus Eko Indrajit (Perbanas)
Ir. Budi Rahardjo, M.Sc., Ph.D. (ITB)
Yudho Giri Sucahyo, Ph.D. (Universitas Indonesia)
Prof. Dr. Ir. Wiranto Herry Utomo, M.Kom. (UK. Satya Wacana)
Dr. Ir. Veronica S. Moertini (Universitas Katolik Parahyangan)
Kristoko Dwi Hartomo, M.Kom. (UK. Satya Wacana)
Dr. Ir. Sri Suwarno, M.Eng. (Fakultas Teknologi Informasi
Universitas Kristen Duta Wacana)
Budi Susanto, S.Kom., M.T. (Fakultas Teknologi Informasi
Universitas Kristen Duta Wacana)
Nina Sevani, S.Kom, M.Si. (Fakultas Teknik dan Ilmu Komputer
Universitas Kristen Krida Wacana)
Yudhi Windarto, S.Si., M.Kom (Fakultas Teknik dan Ilmu Komputer
Universitas Kristen Krida Wacana)
Sekretariat
: Teddy Yusnandar
Adriani Dewi Hutami
PENERBIT (PUBLISHER)
Maranatha University Press
ALAMAT PENYUNTING (EDITORIAL ADDRESS)
Sekretariat Jurnal Teknik Informatika dan Sistem Informasi Fakultas Teknologi Informasi
Jl. Prof. Drg. Suria Sumantri, MPH, No.65 Bandung 40164 Telp. (022) 2012186 ext.1712, Fax (022) 2005915
e-ISSN: 2443-2229 Jurnal Teknik Informatika dan Sistem Informasi Volume 3 Nomor 1 April 2017
JuTISI (Jurnal Teknik Informatika dan Sistem Informasi)
e-ISSN: 2443-2229
Volume 3 Nomor 1 April 2017
DAFTAR ISI
Volume 3 Nomor 1
1
Rancang Bangun Sistem Informasi Kenaikan Pangkat Pegawai pada Kantor
Kecamatan Bukit Intan
1 - 16
Marini
2
Sistem Pengenalan Aksara Sunda Menggunakan Metode Modified Direction
Feature Dan Learning Vector Quantization
17 - 30
Rizki Rahmat Riansyah, Youllia Indrawaty Nurhasanah, Irma Amelia Dewi
3
Sistem Penjadwalan Kuliah Berbasis Click and Drag
(Studi Kasus di Fakultas Sains & Teknologi Universitas Teknologi
Yogyakarta)
31 - 45
Shoffan Saifullah, Arief Hermawan
4
Ekstraksi Pola Hubungan Penerimaan Mahasiswa Baru Dengan Sebaran
Wilayah Asal Sekolah Menggunakan ARM Algoritma Apriori
46 - 56
Deden Prayitno
5
Perbandingan Needleman-Wunsch dan Lempel-Ziv dalam Teknik Global
Sequence Alignment: Keunggulan Faktorisasi Sempurna
57
–
68
Mikhael Avner Malendes, Hendra Bunyamin
6
Sistem Reservasi Online dan Penerapan Metode Servqual pada Hotel TriJaya
Cirebon
69
–
83
Gabriela Stefiyani Suprato, Julianti Kasih
7
Model Integrasi Sistem dengan Pendekatan Metode Service Oriented
Architecture dan Model View Controller pada Pusat Penelitian
Perkembangan Iptek Lembaga Ilmu Pengetahuan Indonesia
84
–
103
Warkim, Dana Indra Sensuse
8
Implementasi Kansei Engineering dalam Perancangan Desain Interface
E-Learning Berbasis web
(Studi Kasus: SMK Negeri 1 Sukabumi)
104
–
115
Indra Griha Tofik Isa, Ana Hadiana
9
Analisis Penerapan Single Page Application Menggunakan Teknologi AJAX
dan REST API
(Studi Kasus : Sistem Informasi Reservasi Wisma Tamu UKSW)
116
–
126
Adib Luqman Azhari, Radius Tanone
10 Implementasi Two Factor Authentication Dan Protokol Zero Knowledge
Proof Pada Sistem Login
127
–
136
Willy Sudiarto Raharjo, Ignatia Dhian E.K.Ratri, Henry Susilo
11 Performance Analysis of NFS Protocol Usage on VMware ESXi Datastore
137
–
149
Billy Susanto Panca
12 Pengembangan Sistem Informasi Penjadwalan dan Manajemen Keuangan
Kegiatan Seminar dan Sidang Skripsi/Tugas Akhir
Jurnal Teknik Informatika dan Sistem Informasi e-ISSN: 2443-2229 Volume 3 Nomor 1 April 2017
(Studi Kasus Program Studi Sistem Informasi UNIKOM)
Julian Chandra W., Muhammad Rajab F.
13 Evaluasi Algoritma Runut Balik dan Simulated Annealing pada Permainan
Sudoku
169
–
178
Dyah Sulistyowati Rahayu, Arie Suryapratama, Azka Zulham Amongsaufa, Bheli
Isya Kurniawan Koloay
14 Analisis Digital Forensik pada File Steganography (Studi kasus : Peredaran
Narkoba)
179
–
190
Agung Purnama Saputra, Husni Mubarok, Nur Widiyasono
15 Implementasi Metode Performance untuk Aplikasi Pemesanan Jasa Paket
Dokumentasi (Studi Kasus: Quill Photo)
191
–
205
Safila Marina Ramadhani, Adelia
16 Tata Kelola Teknologi Informasi pada Perguruan Tinggi Menggunakan
Control Objective for Information & Related Technology (COBIT) 5
206
–
216
e-ISSN : 2443-2229 Jurnal Teknik Informatika dan Sistem Informasi Volume 3 Nomor 1 April 2017
Performance Analysis of NFS Protocol Usage on
VMware ESXi Datastore
Billy Susanto Panca
Faculty of Information Technology, Maranatha Christian University Jl. Prof. Dr. Surya Sumantri. No 65, Bandung
Abstract — Hypervisor virtualization that uses bare metal architecture allows to allocate and provide resources for each created virtual machines. Resources such as: CPU and memory, can be added or upgraded anytime to the host hardware (virtualization server) to be able to create more virtual machines. However, upgrading the hard drive size cannot be done anytime if there are already have data or virtual machine that has fully operated on the host hardware, related to the raid system and the establishment of hard drive partition.
Upgrading hard drive size on virtualization server can be done by using NFS protocol on NAS server. VSphere ESXi able to use NFS protocol and store the virtual disk that is used by virtual machine as guest operating system on network storage besides using local hard drive (host hardware hard drive). When the virtual machine want to run the guest operating system, it will request to write/read virtual disk there is stored on NAS by using NFS protocol through the network.
In this research, measurements has been taken on data communication performance due the usage of NFS as virtual machine’s datastore in addition to local hard drive usage on server’s device. Measurements were performed by sending various data size from client to server (virtual machine) and measure write/read speed on server’s cache memory and hard drive, and measure RTT (Round-trip Time) delay between client-server. The testing has been conducted on virtual machines that use local drive and NFS as virtual disk datastore.
Keywords
—
datastore, ESXi, NAS (Network Attached Storage), network , NFS (Network File System), performance, virtualization, vSphere.I. INTRODUCTION
The virtualization concept already widely used for server deployment. One machine can create multiple heterogenous operating system depends on needed. The using of virtualized environment makes deployment more efficient such less power cost then using unvirtualized environment [1]. However, virtualization requires more resources such CPU, memory, and storage space. Each creation of virtual machine will be given CPU, memory, storage, network access, from available resources which provided by the hypervisor. The resources are guaranteed only can be used for concerned virtual machine by the hypervisor [2] [3]. Since CPU, memory, and network adapter are depends on the type of the
server, it makes upgrading them are limited. Storage is also limited in the number of hard drive’s slot.
Many storage externalization technology such as NAS (Network Attached Network) and SAN (Storage Attached Network) using NFS protocol already widely used [4]. NFS frequently used to allow user on a client computer to access file through the network like using local storage [5]. The use of external storage is possible to use such as NAS on vSphere datastore to provide more storage space for virtual machines. NFS implementation as virtual machine datastore can improve flexibility in the process of further development. However, since every data of virtual machine will be stored at different location, it will degrade the output performance such as data communication speed performance. Our research will measure data transfer performance by using NFS as vSphere ESXi datastore such as write/read speed to virtual
machine’s cache memory and hard drive, and measure RTT (round-trip time delay) from client side to virtual machine. Testing will be performed on the virtual machines that use datastore on direct attached hard drive and NFS protocol.
II. RELATED WORK
Many studies related to the field of virtualization performance and efficiency have been conducted [1] [6]. Maria and Hammad made a research by deployment NAS on ESXi virtual machine uses virtual switch on it. Their research focus on the procedures of NAS implementation on virtual enviroment. They create a virtual machine as NAS and configure NFS protocol for the procedures for accessing the NAS [4]. In our research, we are not create NAS on ESXi but use NAS as ESXi virtual machine datastore by using NFS for write/read communication protocol.
Debabrata and Rajesh provide a model on their research to make an encrypted virtual machine storage on the scope of the private cloud. They realize the importance of using virtual machine to reduce cost during maintenance process and expanding the infrastructure [7]. Our research focused on storage addition efficiency, different from their research that provide storage security model.
Jurnal Teknik Informatika dan Sistem Informasi e-ISSN : 2443-2229 Volume 3 Nomor 1 April 2017
virtual machines. They was measuring virtual machines performance based on thread clock tick and memory load. In our research, benchmarking on virtual machine focused on measuring write/read speed on cache memory and hard drive before and after using NFS as virtual machine datastore on ESXi [8].
Vaughn, Michael, Larry, and Peter recommended many methods on their report for improving vSphere storage
including using NFS as datastore. However, they aren’t test
the impact by using NSF through the value of data communication performance [5].
III.LITERATUR REVIEW
A. Virtualization
Since 1960, virtualization has been used for dividing the system resources provided by mainframes computer between different applications [9] [10]. Virtualization is considered to be act of abstracting the physical boundaries of a technology [4]. Virtualization has a major impact on the data center by decreasing a number of physical servers need to run on back office and greatly increasing the manageability and flexibility of that infrastructure. Since there are occurence of physical abstraction such improving security, flexibility and performance, makes one virtual machine separate from one other [7]. While one of them fails, it will completely isolated from all other on a physical machine, including other virtual machines. This is make the problem will be contained and increase the security and manageability [11]. There are several approach of virtualization based on how the virtual machines are controlled [7].
1) Operating System-Based Virtualization
In Figure 1 shows the illustrated architecture of operating system-based virtualization. Virtualization is provided by host operating system. It support feature to isolated virtualized
guest OS’s on a single physical host hardware
even using the same operating system kernel and characteristics. The virtual machines are controlled by the host operating system.
The using of operating system-based virtualization have several weaknesses such performance degradation. Since guest operating system need to performs I/O operation, it need to be interpreted by the host operating system before accesing the hardware which can access the kernel. Extra CPU is needed and lead to performance degradation. Operating system-based virtualization is not flexible as other virtualization approaches since it can’t host a quest OS different with the host one, or a different guest kernel [12].
HOST HARDWARE HOST OPERATING SYSTEM VIRTUALIZATION APPLICATION
Guest Operating
System
Guest Operating
System
Fig 1. Architecture of operating system-based virtualization [1]
2) Application-Based Virtualization
Architecture of application-based virtualization is shown in Figure 2. The computer programs are encapsulated in a software underlying operating system on which it is executed. Fully application virtualization requires a virtualization layer. Application virtualization layer replace part of the runtime environment normally provided by the operating system. The layer intercepts all disk operations of virtualized applications and tranparently redirects them to a virtualized location [13].
HOST HARDWARE HOST OPERATING SYSTEM
Virtual Application
Regular Application
Application
Application Virtualization
Application
e-ISSN : 2443-2229 Jurnal Teknik Informatika dan Sistem Informasi Volume 3 Nomor 1 April 2017
Application virtualization helps solve the problem of application incompability in an operating system and others by adding a layer of isolation between operating system and the application. This virtualization approach gives administrators a way to create virtualized applications that help minimized risk, save time, increase user satisfaction, and reduce cost for support and regretion testing [14].
There are several limitation of application virtualization [12]:
i. Not all software can be virtualized. ii. Only file and registry-level compability
issues between legacy applications and newer operating system can be addressed by application virtualization.
iii. Licensing application virtualization must be correctly lisenced between virtualized software and virtualized applications.
3) Hypervisor-Based Virtualization
One of many hardware virtualization such hypervisor allow multiple operating systems, termed guest, to run concurently on a host computer. The hypervisor present to the guest operating system a virtual operating platform and monitors the execution of the guest operating systems [7]. The guest software is not limited to user applications, many host allow the execution of complete operating systems. The guest software executes as if it were running directly on the physical hardware [12].
HOST HARDWARE HYPERVISOR VM VM Application Application Guest OS Virtual Hardware Guest OS Virtual Hardware
Fig 3. Architecture of bare metal hypervisor-based virtualization [1]
Hypervisor or Virtual Machine Monitor (VMM) is installed on server hardware whose only task to run guest operating systems. The virtualization layer directly control the hardware and manages guest operating systems. Since bare metal model (Figure 3) directly implements the virtualization in the hardware level, made the system overhead transfering I/O operation from guest operating system to the hardward is less than hosted model (Figure 4).
HOST HARDWARE HYPERVISOR
A
p
p
li
ca
ti
o
n
VM HypervisorA
p
p
li
ca
ti
o
n
OS A p p lic a ti o n A p p lic a ti o n OS A p p lic a ti o n A p p lic a ti o nFig 4. Architecture of hypervisor-based virtualization [1]
The bare metal hypervisors are installed directly on host hardware, just like any other operating system [15]. The size of management software is very small, it makes the resource used by the virtualization layer can be ignored. Since the virtual machines are not built within a host operating system, it is more flexible and reliable for various applications. The hypervisor is available at the boot time of machine in order to control the sharing of system resources across multiple virtual machines [7].
B. Advantage of Virtualization
1) Cost
Jurnal Teknik Informatika dan Sistem Informasi e-ISSN : 2443-2229 Volume 3 Nomor 1 April 2017
hardware cost reductions, operation cost reductions, floor space, and software lisence. The use virtualization can reduce overall cost from 29 to 51%. [1] [7] [16]
2) Reliability
A software or operating system failure in a virtual machine does not affect other virtual machines [7].
3) Security
The code for hypervisor and boot operating system kept as small as possible, creates a smaller attack surface. Virtual machines run at lower level of permissions than hypervisor, it mades inhibits virtual machines attacks [17].
4) Load Balancing
The software state of entire virtual machines is completely encapsulated by the virtual machine management (VMM), it is made relative easy to migrate virtual machine to ether platform in order to improve performance through better load balancing [18]. Since the hypervisor can provide hardware driver from its vendor, the using of multiple network interface will automatically trigger load balancing without any configuration by ESXi it self.
C. vSphere ESXi
VMWare ESXi is the next-generation hypervisor, providing a new foundation for virtual infrastrcuture. This innovative architecture operates independently from any general purpose operating system, offering improved security, increased realibility, and simplyfied management [19].
Server virtualization using VMWare’s ESXi is the most dominant and stable virtualization technology. VMWare alone holds 50% of the market share in virtualization, whereas other vendors combine the remaining 50%. A research survey done by F5 networks in the time from September to Desember 2008 reported that VMWare ESXi is the most widely deployed server virtualization product [20].
Besides being the most dominant vendor in the
virtualization market, VMWare’s ESXi have a features that
make it reliable and favourite choice for IT profesionals [15]:
i. Small foot print
ESXi just need 70MB of disk space for instalation. Compared with other bare metal model such Hyper-V with minimum 2GB of disk space and 1.8GB with XenServer v5.6 [8].
ii. Hardened Drivers
Hardware drivers for virtual machine already optimized by hardware vendors.
iii. Advance memory management
Feature to reclaim unused memory, duplicate memory pages, and compress memory pages.
iv. Advance storage management
Feature to provides independent storage management. The alocation of storage can be done without interrupting the other virtual machines or host machine.
v. Host resource management
Feature for network traffic shaping, resource sharing for each virtual machines, and allows the setting of quality of service priorities for storage and network I/O.
vi. Flexible resource alocation
The resource alocation can be done on the fly, such as add virtual CPU, memory, and virtual disk (hard disk space)
ESXi install and runs without the Linux-based Service Console like VMWare ESX. This makes ESXi an ultra light footprint of approximately 70MB. ESXi provide all the same virtualization feature that VMWare ESX provided in earlier versions. The reason that ESXi is able to support the same extensive set of virtualization as VMWare ESX without the Service Console is that the core of virtualization funcionality was not found in the Service Console [8]. VMKernel manages the virtual machines access to the underlying physical hardware by providing CPU scheduling, memory management, and virtual switch data processing [21]. Figure 5 shows the architecture of next generation VMWare virtualization foundation ESXi after ESX.
Fig 5. Architecture of VMWare ESXi [16]
D. NAS
e-ISSN : 2443-2229 Jurnal Teknik Informatika dan Sistem Informasi Volume 3 Nomor 1 April 2017
or Network File System (NFS). NAS devices interpret these command and perform the internal file and device I/O operation necessary to execute them [22][23].
E. NFS
The Network File System (NFS) is designed to be portable accross different machines, operating systems, network architectures and transport protocol to provides remote access to shared files across networks. This portability is achieved through the use or Remote Procedure Call (RPC) primitives built on top of eXternal Data Representation (XDR) [24].
Since the NFS protocol was intented to be a stateless connection, that is made the server should not need to maintain any protocol state information about any of it’s clients in order to function correctly. Stateless servers have a distinct advantage over stateful servers in the event of failure. A client just need to retry a request until the server responds, it does not even need to know that the server has crashed, or the network connection went down. The client of a stateful server needs to either detect a server failure and rebuild the
server’s state when it comes back up, or cause operations to
fail [24].
All of the procedures in the NFS protocol assumend to be synchronous. When a procedure returns to the client, the client can assume that the operation has completed and any data associated with the request is now on stable storage.
IV.EXPERIMENTAL SETUP
A. Hardware Configuration
The hardware platform used for conduction this research has the following spesification.
i. ESXi (Virtualization Server): HP ProLiant DL380 Gen9, Intel® Xeon® CPU E5-2650v3 (20 CPUs, 40 Logical Processor) @ 2.30GHz with 25MB SmartCache, 64GB memory, 4TB hard drive, 6 ethernet port with spec: 4 Broadcom NetXtreme Gigabit Ethernet Port and 2 Broadcom QLogic 57810 10 Gigabit Ethernet Port.
ii. NAS Server: HP StoreEasy 1550, Intel® Xeon® CPU E5-2603v3 (6 CPUs) @ 1.6GHz, 8GB Memory, 16TB hard drive, 2 Gigabit Ethernet Broadcom BCM5715 NetXTreme.
B. Software Configuration
Hypervisor provided by using lisenced VMware vSphere 6.0 (unlimited cores per CPU). These version where the last shipping releases at the time of doing this research (started in January 2017).
C. Guest Operating System
Windows Server 2012 (64bit) is the guest operating system used on our research. There are two Windows Server 2012, first is stored at virtualization server datastore directly by using local hard drive in it, the second is stored at NAS
server by configuring NFS protocol between virtualization server and NAS server for write/read communication protocol.
Windows Storage Server 2012 (64bit) R2 installed at NAS server which provide storage for any client by using NFS protocol.
Windows 10 pro (64bit) installed at Client PC and used for communication testing to both Windows Server 2012.
D. Virtual Machine Configuration
Since this research using ESXi as hypervisor, the created virtual machine will be fully-virtualized instead of paravirtualized. Each virtual machine is configured to have one virtual CPU, 4GB of memory, 40GB hard drive for I/O file testing, and 1 Gigabit ethernet port.
Fig 6. ESXi datastore (VMFSS and NFS)
Figure 6 shows the ESXi have 2 types of datastore. First virtual machine will be installed at “Local Drive”, and the other one will be installed at “NAS Storage”. The communication between ESXi and NAS server is using NFS protocol that allowed ESXi to access shared directory and store virtualization image (.vmdk, .vmx, .nvram, etc) on NAS.
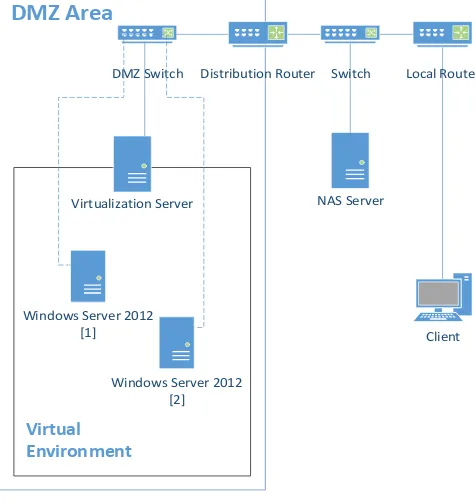
E. Network Topology
The hypervisor installed at server device and stored at DMZ area and NAS devices as ESXi datastore stored at local area network. Figure 7 shows the connection between ESXi, NAS devices, and PC Client.
Virtualization Server NAS Server
DMZ Switch Distribution Router Switch Local Router
Client Windows Server 2012
[1]
Windows Server 2012 [2]
DMZ Area
Virtual Environment
Jurnal Teknik Informatika dan Sistem Informasi e-ISSN : 2443-2229 Volume 3 Nomor 1 April 2017
Even the both Windows Server 2012 are running at virtual enviroment under ESXi hypervisor, one of it (Windows Server 2012 [2]) is stored at NAS server besides on virtualization server’s local drive. Every times Windows Server 2012 [2] runs, the virtualization server will be ask the files needed (virtual disk) to NAS server by using NFS protocol. Figure 8 shows the NFS protocol communication between virtualization server to NAS server, captured by using Wireshark software.
Fig 8. Communication between virtualization server and NAS server
V. TESTING PROCEDURES AND RESULTS
Windows Server 2012 is selected as guest operating system since we used a software that used TCP/IP protocol for transmitting and receiving data between client-server and also measuring write/read data communication speed.
A. Testing Metrics
There are two mechanism of data communication on this test. Write and read data are performed on server’s cache memory and hard drive. Measurements are performed at write/read speed and RTT (Round-trip Time) between client-server.
B. Measuring Process
The measurement on each testing metrics are performed on both virtual machines to obtain the performance difference between using local hard drive and NFS protocol as virtual machines datastore. The measurement will be conducted 1000 times for each scenarios. We conducts test by using four data sizes (100KB, 1M, 10M, 100M) send over network between client-server. For each test, we generate 100 data packets on every data size and do 10 times testing.
C. Testing Scenarios
i. Write/Read from Client to Server’s Cache Memory
We have been conduct several testing scenarios by using four data sizes. It intended to measure the virtual machine’s write/read capabilities to it’s cache memory and hard drive. We measure the write/read performance to virtual machine that use local drive at host machine and NFS protocol as
virtual machine’s datastore.
The first testing scenario is sending data from client (PC Client) to server (Windows Server 2012 [1] & [2]) over the network by using TCP/IP protocol. Figure 9 to 16 show the performance different on write time (ms) to server’s cache memory on 100KB data size on virtual machine which use local hard drive (VMFSS) and NFS protocol as virtual machine datastore to storing virtual disk (.vmdk).
The Figure 9 shows the write process to server’s cache
memory using local hard drive is more unstable compared than using NFS protocol.
Fig 9. Write Time to Cache Memory – 100KB data size
The average of write time (ms) from client to server with 100KB data size is shown in Table I. Every rows shows the average of 100 times testing. Average of 1,000 times write testing with 100KB data size to server’s cache memory shows that using NFS protocol as virtual machine datastore is 24.38% faster than using local drive at host hardware.
TABLE I
WRITE TIME TO SERVER’S CACHE MEMORY -100KB DATA SIZE
No. Local Drive NFS
1 0.3227733 0.2932900 2 0.3760763 0.2896637 3 0.4554326 0.2945069 4 0.3478442 0.2956532 5 0.3703460 0.2957401 6 0.3447231 0.2963665 7 0.3861392 0.2986223 8 0.3761321 0.2956834 9 0.3331197 0.2974705 10 0.3626582 0.2978439 Avg 0.36752447 0.29548405
Figure 10 shows the result of read time (ms) from client to
server’s cache memory on 100KB data size. The graph shows
that read time by using NFS protocol more stable compared by using local hard drive on host hardware.
Fig 10. Read Time to Cache Memory – 100KB data size 0
0.2 0.4 0.6
1 2 3 4 5 6 7 8 9 10
Write Time (ms) - 100KB
to Server's Cache Memory
Local NFS
0 1 2
1 2 3 4 5 6 7 8 9 10
Read Time (ms) - 100KB
to Server's Cache Memory
e-ISSN : 2443-2229 Jurnal Teknik Informatika dan Sistem Informasi Volume 3 Nomor 1 April 2017
The average of read time (ms) needed from client to server’s cache memory with 100KB data size is shown in Table II. Average of 1000 times read testing with 100KB data
size to server’s cache memory shows that using NFS as virtual machine datastore is 509.67% faster than using local drive at host hardware.
TABLE II
READ TIME TO SERVER’S CACHE MEMORY -100KB DATA SIZE
No. Local Drive NFS
1 0.8973481 0.1562289 2 1.1820205 0.1465906 3 1.4616412 0.1541129 4 0.5558776 0.1507121 5 0.2318107 0.1543894 6 1.8124936 0.1529284 7 0.8802639 0.1535888 8 0.9002681 0.1537114 9 0.2330693 0.1541873 10 1.1792473 0.1545411 Avg 0.93340403 0.15309909
Figure 11 shows the value of write time (ms) from client to server’s cache memory on 1MB data size. The graph shows the using of local hard drive are more stable compared with NFS protocol on 1MB than 100KB data size.
Fig 11. Write Time to Cache Memory – 1MB data size
The average of write time (ms) needed from client to server with 1MB data size is shown in Table III.
TABLE III
WRITE TIME TO SERVER’S CACHE MEMORY –1MB DATA SIZE
No. Local Drive NFS
1 2.4297315 2.2070025 2 2.3809750 2.2113293 3 2.3138561 2.2205531 4 2.3894056 2.2096884 5 2.3703614 2.3598893 6 2.3432618 2.5560472 7 2.3619025 2.1904816 8 2.3555105 2.1920535 9 2.3333875 2.0934884 10 2.3435219 2.1927912 Avg 2.36219138 2.24333245
Average of 1000 times write testing with 1MB data size to
server’s cache memory shows that using NFS as virtual machines datastore is 5.29% faster than using local drive at host hardware.
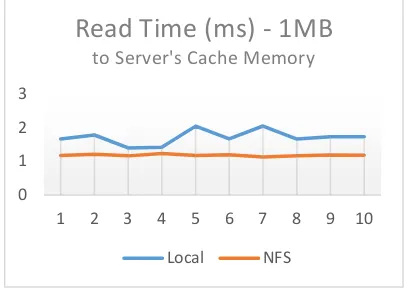
Figure 12 shows the value of read time (ms) from client to server’s cache memory on 1MB data size. The graph shows the read process on 1MB data size by using NFS protocol are more stable and faster than using local drive as virtual machine datastore.
Fig 12. Read Time to Cache Memory – 1MB data size
Table IV shows the average of 1000 times read testing on
1MB data size to server’s cache memory. The using of NFS is 45.01% faster than using local drive as virtual machine datastore.
TABLE IV
READ TIME TO SERVER’S CACHE MEMORY –1MB DATA SIZE
No. Local Drive NFS
1 1.6581289 1.1766468 2 1.7769015 1.2073970 3 1.3960516 1.1613709 4 1.4138687 1.2313505 5 2.0455276 1.1735411 6 1.6627443 1.1972251 7 2.0456758 1.1247076 8 1.6585109 1.1625198 9 1.7281476 1.1858430 10 1.7276530 1.1800396 Avg 1.71132099 1.18006414
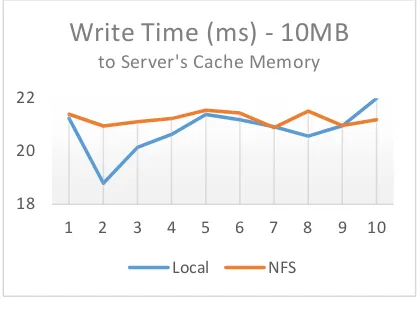
Figure 13 shows the value of write time (ms) from client to server on 10MB data size. The graph shows the write
testing with 10MB data size to server’s cache memory on
local drive and NFS are both unstable value compared with previous test.
The Table V shows the average of 1000 times write testing on both servers. The using of local drive is 2.12% faster than using NFS as virtual machine datastore. Compared with
previous testing on smaller datasize, write data to server’s
cache memory that using local drive as virtual machine datastore on 10MB data size show faster results than using NFS protocol.
0 1 2 3
1 2 3 4 5 6 7 8 9 10
Write Time (ms) - 1MB
to Server's Cache Memory
Local NFS
0 1 2 3
1 2 3 4 5 6 7 8 9 10
Read Time (ms) - 1MB
to Server's Cache Memory
Jurnal Teknik Informatika dan Sistem Informasi e-ISSN : 2443-2229 Volume 3 Nomor 1 April 2017
Fig 13. Write Time to Cache Memory – 10MB data size
TABLE V
WRITE TIME TO SERVER’S CACHE MEMORY –10MB DATA SIZE
No. Local Drive NFS
1 21.2407821 21.4034873 2 18.7942882 20.9534845 3 20.1486679 21.1149016 4 20.6350253 21.2316414 5 21.3881703 21.5485224 6 21.1889365 21.4456097 7 20.9265949 20.8925960 8 20.5718300 21.5166040 9 20.9605279 20.9692456 10 21.9976195 21.1947304 Avg 20.78524426 21.22708229
Figure 14 shows the value of read time (ms) from client to server 10MB data size. The graph shows the using local drive are more unstable than NFS as datastore.
Fig 14. Read Time to Cache Memory – 10MB data size
The Table IV shows the result of 1000 times testing read data from client to server’s cache memory on 10MB data size by using of NFS as virtual machine datastore is 12.35% faster than using local drive.
TABLE VI
READ TIME TO SERVER’S CACHE MEMORY –10MB DATA SIZE
No. Local Drive NFS
1 18.9812338 11.5216015 2 11.4377432 11.4557662 3 13.7364794 11.3425241 4 13.1597428 11.3561308 5 11.6862156 11.4530614 6 12.6336952 11.6170974 7 12.7788510 13.5841254 8 12.5122481 11.2879391 9 11.9090408 11.3533452 10 12.0038139 11.4834139 Avg 13.08390638 11.6455005
Figure 15 shows the value of write time (ms) from client to server’s cache memory on 100MB data size. The graph shows that the using of local drive and NFS are both unstable than smaller data size on previous test.
Fig 15. Write Time to Cache Memory – 100MB data size
The Table VII shows the average of 1000 times write
testing to server’s cache memory on 100MB data size by
using local drive as virtual machine datastore is 3.51% faster than NFS.
TABLE VII
WRITE TIME TO SERVER’S CACHE MEMORY –100MB DATA SIZE
No. Local Drive NFS
1 205.6173631 216.7695078 2 206.3029872 204.7207051 3 198.8206734 206.6124627 4 208.3145364 210.5396421 5 204.1249096 213.9944990 6 206.6413029 206.4118865 7 203.3173913 213.6243310 8 206.1648641 213.6666022 9 204.7953219 223.4595259 10 206.6063254 215.6265829 Avg 205.0705675 212.5425745 18
20 22
1 2 3 4 5 6 7 8 9 10
Write Time (ms) - 10MB
to Server's Cache Memory
Local NFS
0 5 10 15 20
1 2 3 4 5 6 7 8 9 10
Read Time (ms) - 10MB
to Server's Cache Memory
Local NFS
190 200 210 220 230
1 2 3 4 5 6 7 8 9 10
Write Time (ms) - 100MB
to Server's Cache Memory
e-ISSN : 2443-2229 Jurnal Teknik Informatika dan Sistem Informasi Volume 3 Nomor 1 April 2017
Figure 16 shows the values of read time (ms) from client to server’s cache memory on 100MB data size. The graph clearly shows that the using local drive is need less time than NFS on read 100MB data size.
Fig 16. Read Time to Cache Memory – 100MB data size
The Table VIII shows the average of 1000 times read
testing on 100MB data size to server’s cache memory. The
test results show that the using of local drive as virtual machine datastore is 8.90% faster than using NFS on 100MB read test scenario.
TABLE VIII
READ TIME TO SERVER’S CACHE MEMORY –100MB DATA SIZE
No. Local Drive NFS
1 117.6023214 127.4876240 2 120.9903297 124.5415373 3 117.8610673 128.9027952 4 117.2513944 126.6516907 5 116.0152739 127.4876240 6 116.9644377 124.5415373 7 114.9893922 128.9027952 8 115.4930069 126.6516907 9 114.0547803 130.3600002 10 116.2309486 125.9291211 Avg 116.7452952 127.1456416
ii. Write/Read from Client to Server’s Hard Drive
The second testing scenario is sending data from client to
server’s hard drive. Figure 17 to 24 shows the performance different on write/read time (ms) from client to server which using local datastore (VMFSS) and NFS protocol as virtual machine datastore.
The Figure 17 shows the results of 1000 times write
testing on 100KB data size to server’s hard drive. Same as
previous scenario, for every 100 times testing will be conducted average calculation. The graph clearly shows that the using local drive is faster than NFS as virtual machine
datastore on write 100KB data size to server’s hard drive.
Fig 17. Write Time to Server’s Hard Drive– 100KB data size
The Table IX shows the average of 1000 times write
testing results on server’s hard drive on 100KB data size. The
results show that the write time on virtual machine that used local drive as virtual machine datastore is 40.58% faster than using NFS.
TABLE IX
WRITE TIME TO SERVER’S HARD DRIVE –100KB DATA SIZE
No. Local Drive NFS
1 1.2692339 1.7658046 2 1.2613508 2.0487450 3 1.3590300 1.7592541 4 1.3642295 1.6378762 5 1.2587541 2.0578476 6 1.4187532 1.6919528 7 1.1473697 1.8511347 8 1.1379583 1.8861857 9 1.2552401 1.6193669 10 1.2229089 1.5283764 Avg 1.26948285 1.7846544
The Figure 18 shows the 1000 times read testing on
100KB data size on server’s hard drive. The graph shows the
read process on virtual machine that use NFS as datastore is unstable and slower compared with using local drive.
Fig 18. Read Time to Server’s Hard Drive– 100KB data size 110
120 130 140
1 2 3 4 5 6 7 8 9 10
Read Time (ms) - 100MB
to Server's Cache Memory
Local NFS
0 0.5 1 1.5 2 2.5
1 2 3 4 5 6 7 8 9 10
Write Time (ms) - 100KB
to Server's Hard Drives
Local NFS
0 1 2
1 2 3 4 5 6 7 8 9 10
Read Time (ms) - 100KB
to Server's Hard Drives
Jurnal Teknik Informatika dan Sistem Informasi e-ISSN : 2443-2229 Volume 3 Nomor 1 April 2017
The Table X shows the average of 1000 times read testing
to server’s hard drives. The result shows that using local drive as virtual machine datastore is 285.12% faster than using NFS.
TABLE X
READ TIME TO SERVER’S HARD DRIVE –100KB DATA SIZE
No. Local Drive NFS
1 0.2727091 1.1009283 2 0.2532925 1.4479928 3 0.2650531 0.9169837 4 0.2740736 1.4086522 5 0.2796387 1.0301360 6 0.2850377 1.0751110 7 0.2731174 1.0475101 8 0.2846108 0.7864894 9 0.2864403 0.8413505 10 0.2896118 0.9882189 Avg 0.2763585 1.06433729
Figure 19 shows the values of write time (ms) from client
to server’s hard drives on 1MB data size. The graph clearly shows that the using local drive is need less time than NFS on writing 1MB data size to server’s hard drives.
Fig 19. Write Time to Server’s Hard Drive– 1MB data size
TABLE XI
WRITE TIME TO SERVER’S HARD DRIVE –1MB DATA SIZE
No. Local Drive NFS
1 2.6951906 4.6125644 2 2.4538437 4.5276795 3 2.6429746 4.6541678 4 2.6237479 4.5839958 5 2.6098378 4.4526557 6 2.6108253 4.4808464 7 2.6094093 4.5075496 8 2.6389205 4.6009523 9 2.7065288 4.8241163 10 2.8184016 5.0088768 Avg 2.64096801 4.62534046
The Table XI shows the result of measuring write speed
from client to server’s hard drive on 1MB data size. The test
conducted 1000 times and shows that the write time (ms)
using local drive as virtual machine datastore is 75.13% faster than NFS on writing 1MB data size.
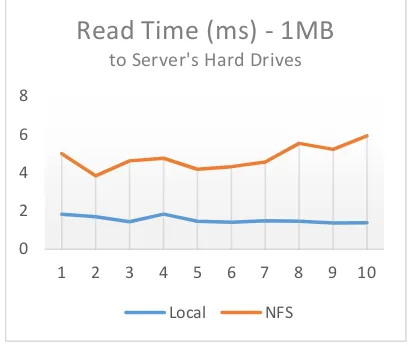
Figure 20 shows the values of read time (ms) from client
to server’s hard drives on 1MB data size. The graph clearly
shows that the using local drive is need less time than NFS on reading 1MB data size.
Fig 20. Read Time to Server’s Hard Drive– 1MB data size
The Table XII shows the result of measuring read speed
from client to server’s hard drive on 1MB data size. The test
conducted 1000 times and shows that the read time (ms) using local drive as virtual machine datastore is 212.13% faster than NFS on reading 1MB data size.
TABLE XII
READ TIME TO SERVER’S HARD DRIVE –1MB DATA SIZE
No. Local Drive NFS
1 1.8280787 4.9922166 2 1.7018325 3.8379347 3 1.4340294 4.6196290 4 1.8379318 4.7546660 5 1.4574793 4.1798378 6 1.4069189 4.3161234 7 1.4892594 4.5611101 8 1.4590108 5.5375688 9 1.3681861 5.2294828 10 1.3829000 5.9326323 Avg 1.53656269 4.79612015
Figure 21 shows the values of write time (ms) from client
to server’s hard drives on 10MB data size. The graph clearly shows that the using local drive is need less time than NFS on writing 10MB data size.
0 2 4 6
1 2 3 4 5 6 7 8 9 10
Write Time (ms) - 1MB
to Server's Hard Drives
Local NFS
0 2 4 6 8
1 2 3 4 5 6 7 8 9 10
Read Time (ms) - 1MB
to Server's Hard Drives
e-ISSN : 2443-2229 Jurnal Teknik Informatika dan Sistem Informasi Volume 3 Nomor 1 April 2017
Fig 21. Write Time to Server’s Hard Drive– 10MB data size
The Table XIII shows the result of measuring write speed
from client to server’s hard drive on 10MB data size. The test
conducted 1000 times and shows that the write time (ms) using local drive as virtual machine datastore is 74.52% faster than NFS on writing 10MB data size.
TABLE XIII
WRITE TIME TO SERVER’S HARD DRIVE –10MB DATA SIZE
No. Local Drive NFS
1 27.1478046 43.0757329 2 24.4528828 42.1070175 3 24.6816513 43.2469012 4 23.1744430 43.2497131 5 24.0107874 44.0722654 6 25.6908536 43.9439595 7 24.5191706 44.9724713 8 24.6346203 42.5227648 9 24.9806222 41.6700380 10 24.4733174 43.5520640 Avg 24.77661532 43.24129277
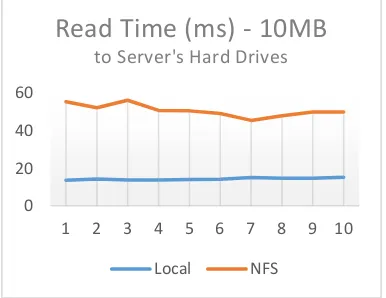
Figure 22 shows the values of read time (ms) from client
to server’s hard drives on 10MB data size. Same as the
previous test with smaller data size, the graph clearly shows that the using local drive is need less time than NFS on writing 10MB data size.
Fig 22. Read Time to Server’s Hard Drive– 10MB data size
TABLE XIV
READ TIME TO SERVER’S HARD DRIVE –10MB DATA SIZE
No. Local Drive NFS
1 13.6111554 55.4404134 2 14.2858530 52.3000522 3 13.7428692 56.3048110 4 13.7763704 50.8230918 5 14.0682058 50.6481013 6 14.1392855 49.2817658 7 15.0144403 45.5446373 8 14.6455623 48.1021028 9 14.6736816 49.9587382 10 15.2351220 49.9417438 Avg 14.31925455 50.83454576
The Table XIV shows the average of 1000 times read
testing on 10MB data size to server’s hard drives. The test
results show that the reading time using of local drive as virtual machine datastore is 255.00% faster than using NFS on 10MB data size.
Figure 23 shows the values of write time (ms) from client
to server’s hard drives on 100MB data size.
Fig 23. Write Time to Server’s Hard Drive – 100MB data size
The Table XV shows the average of 1000 times write
testing on 100MB data size to server’s hard drive. The using
of local drive as virtual machine datastore is 85.50% faster than NFS on writing test with 100MB data size.
TABLE XV
WRITE TIME TO SERVER’S HARD DRIVE –100MB DATA SIZE
No. Local Drive NFS
1 274.3238606 417.0823187 2 279.8248629 409.0026006 3 234.8885168 449.6597092 4 234.4858092 447.0694994 5 233.5891321 456.4545487 6 248.3101872 430.8372765 7 236.5735981 452.3911742 8 241.9112925 449.6875946 9 258.0254186 477.5778424 10 236.4137314 501.0387831 Avg 242.0793223 449.0801347 0
10 20 30 40 50
1 2 3 4 5 6 7 8 9 10
Write Time (ms) - 10MB
to Server's Hard Drives
Local NFS
0 20 40 60
1 2 3 4 5 6 7 8 9 10
Read Time (ms) - 10MB
to Server's Hard Drives
Local NFS
0 200 400 600
1 2 3 4 5 6 7 8 9 10
Write Time (ms) - 100MB
to Server's Hard Drives
Jurnal Teknik Informatika dan Sistem Informasi e-ISSN : 2443-2229 Volume 3 Nomor 1 April 2017
Figure 24 shows the values of read time (ms) from client
to server’s hard drives on 100MB data size.
Fig 24. Read Time to Server’s Hard Drive– 100MB data size
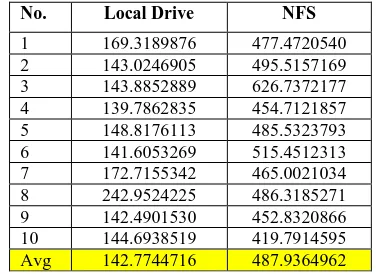
The Table XVI shows the average of 1000 times read
testing on 100MB data size to server’s hard drive. The using
of local drive as virtual machine datastore is 241.75% faster than NFS on reading test with 100MB data size.
TABLE XVI
READ TIME TO SERVER’S HARD DRIVE –100MB DATA SIZE
No. Local Drive NFS
1 169.3189876 477.4720540 2 143.0246905 495.5157169 3 143.8852889 626.7372177 4 139.7862835 454.7121857 5 148.8176113 485.5323793 6 141.6053269 515.4512313 7 172.7155342 465.0021034 8 242.9524225 486.3185271 9 142.4901530 452.8320866 10 144.6938519 419.7914595 Avg 142.7744716 487.9364962
iii. Round-trip Time from Client to Server
The third testing scenario is measuring RTT value from client to server. The testing was conducted by sending the various size of data packet to server and measure the delay from source to destination and vice versa. When we need to calculate a data and send to be processed on server, we need to know the transmit time needed between client-server, regardless of the time required in the calculations on the server. Figure 25 shows the RTT values between client-server in 4000 times write/read test. The test was conducted when
we did testing on schenario 1 (write/read to server’s cache
memory).
Fig 25. Round-trip Time
The Figure 25 shows the graph from 40 times testing with 100 data packet in a test. The average RTT in 4000 times testing by using local drive is 1.15ms and 1.09ms for using NFS as virtual machine datastore. Therefore, the using of NFS is 6.15% faster than local drive as virtual machine datastore.
VI.CONCLUSION AND FUTURE WORK
This research proposed the using of NFS protocol on NAS storage as vSphere ESXi datastore. The using of NFS can
improve manageability on upgrading server’s storage space.
The test results on write process from client to server’s cache memory shows the using of NFS are more stable and faster than local drive as virtual machine datastore on 100KB and 1MB data size, until 10MB and 100MB data size testing that shows the using of local drive become more faster than NFS. The write process to server’s cache memory shows contradiction between NFS and local drive as virtual machine datastore on the used of data size. The test on smallest data size (100KB) shows NFS are faster than local drive. However, after the data size is enlarged, the results shows increased speed on the using of local drive and decrease the speed on the use of NFS as virtual machine datastore.
Same as the results of write test, the read test to server’s
cache memory showed the same pattern. On the testing using a small data shows the use of NFS are faster than local drive. After the data size is enlarged, the results shows the using of local drive becomes better than NFS. Therefore, the use of NFS as virtual machine datastore is suitable for data communication on the cache memory that uses a small data size. The local drive is suitable for data communication on the cache memory that uses a bigger data size.
The test results on write/read speed from client to server’s
hard drive shows the using of local drive at host hardware as virtual machine datastore are faster than using NFS. The write speed by using local drive as datastore aproximately 70% faster than using NFS. The read speed by using local drive aproximately 250% faster than using NFS.
The RTT test shows the using of local drive and NFS approx showed almost the same performance. The using of
0 200 400 600 800
1 2 3 4 5 6 7 8 9 10
Read Time (ms) - 100MB
to Server's Hard Drives
Local NFS
0.5 1 1.5 2
1 3 5 7 9 11 13 15 17 19 21 23 25 27 29 31 33 35 37 39
Rount-trip Time Delay (ms)
e-ISSN : 2443-2229 Jurnal Teknik Informatika dan Sistem Informasi Volume 3 Nomor 1 April 2017
NFS as virtual machine datastore is just 6.15% faster than local drive after 4000 times testing with various data size.
There are still needed to measure the using of NFS as virtual machine datastore in more diverse data size to get more accurate results related to perfomance compared to using local drive at host hardware. Also considering the security aspects by using NFS as virtual machine datastore, for the ease of data tapping over the network when the write/read is in process. The security enhancement in the use of NFS as datastore can be done by configuring security protocol for authentication and encrypted data communication. However, there are still need further testing to measure the impact of security methods which will be used related to the data communication performance.
REFERENCE
[1] Avanade, “Server Virtualization: A Step Toward Cost
Efficiency and Business Agility,” Avanade Inc,
Seattle, Washington, 2009.
[2] J. C. Flores Cruz dan T. Atkison, “Digital Forensics
on a Virtual Machine,” dalam Proceedings of the 49th Annual Southeast Regional Conference, 2011. [3] B. D dan H. E, “Computer Forensics Analysis in a
Virtual Environment,” International Journal of Digital Evidance, vol. 6, 2007.
[4] M. A. Siddiqui dan H. Kamal, “A Proposed Approach for Deploying Network Attached Storage by
Configuring Virtual Switch In ESXi,” dalam
International Journal of Scientific and Engineering Research, 2014.
[5] V. Stewart, M. Slisinger, L. Touchette dan P.
Learnmonth, “NetApp and VMWare vSphere Storage Best Practices,” NetApp Technical Report, 2009.
[6] I. Zhang, T. Denniston, Y. Baskakov dan A.
Garthwaite, “Optimizing VM Checkpointing for Restore Performance in VMWare ESXi,” dalam
USENIX Annual Technical Conference, 2012.
[7] D. Sarddar dan R. Bose, “Architecture of Server Virtualization Technique Based on VMWare ESXI
server in the Private Cloud for an Organization,”
International Journal of Innovation and Scientific Research, vol. 12, pp. 284-294, 2014.
[8] H. F. Kazan, L. Perneel dan M. Timmerman,
“Benchmarking the Performance of Microsoft Hyper -V server, VMware ESXi and Xen Hypervisors,” Journal of Emerging Trends in Computing and Information Sciences, vol. 12, 2013.
[9] J. Hiner, B. Detwiler dan T. Bowers, Executive's guide to Virtualization in the Enterprise, Louisville:
TechRepublic, 2013.
[10] C. D. Graziano, “A Performance Analysis of Xen and KVM Hypervisors for Hosting the Xen World
Project,” Iowa State University, 2011.
[11] P. Dwivedi, “Application of Virtualization
Technology in Networked,” International Journal of Electronics and Communication, vol. 3, pp. 165-174, 2014.
[12] K. Rai, A. Sharma dan M. Tanwar, “Operating System
Virtualization,” International Journal of Innovative Research in Tehcnology, vol. 1, no. 5, 2014.
[13] Oracle, System Administrator Guide: Oracle Solaris Containers-Resource Management and Oracle Solaris Zones, Oracle Corporation, 2010.
[14] C. Gurr, “Fasilitating Microsoft Windows Vista
Migration Through Application Virtualization,” Dell
Power Solutions, 2008.
[15] S. R. Signh, “Virtualization and Information Security - A Virtualized DMZ Design Consideration Using
VMWare ESXi 4.1,” Unitec Institute of Technology, 2012.
[16] VMWare, VMWare, 2017. [Online]. Available: www.vmware.com/solutions/consolidation/mission critical.Html.
[17] C. Brenton, “Virtualization Security,” Cloud Security Alliance white papers.
[18] R. U. e. al., “Intel Virtualization Technology,” IEEE Internet Computing, vol. 35, 2005.
[19] VMWare , “Architecture of VMWare ESXi,” VMWare, 2008.
[20] F5 Networks, “Trends in Enterprise Virtualization
Technologies,” F5 Networks, 2008.
[21] S. Lowe, Mastering VMWare VSphere 5, Wiley India/Goels Computer Hut, 2012.
[22] M. Padovano, “System and method for accessing a storage area network as network attached storage”. US Paten US6606690 B2, 12 Aug 2003.
[23] H. Gobioff, G. Gibson dan D. Tygar, “Security for
Network Attached Storages Devices,” U.S.
Department of Defense, 1997.
![Fig 1. Architecture of operating system-based virtualization [1]](https://thumb-ap.123doks.com/thumbv2/123dok/884268.475538/7.595.376.535.464.692/fig-architecture-operating-based-virtualization.webp)