in Britain than in Germany?
A Longitudinal Perspective
Stephen P. Jenkins
Christian Schluter
a b s t r a c t
We analyze why child poverty rates were much higher in Britain than in Western Germany during the 1990s, using a framework focusing on pov-erty transition rates. Child povpov-erty exit rates were significantly lower, and poverty entry rates significantly higher, in Britain. We decompose these cross-national differences into differences in the prevalence of ‘‘trigger events’’ (changes in household composition, household labor market at-tachment, and labor earnings), and differences in the chances of making a poverty transition conditional on experiencing a trigger event. The lat-ter are the most important in accounting for the cross-national differences in poverty exit and entry rates.
I. Introduction
Germany and the United Kingdom are the two largest and most eco-nomically successful nations in the European Union, but Germany better protects children from low income. For example, according to the Statistical Office of the European Community, in 1993, 13 percent of German children lived in households
Stephen Jenkins is a professor at the University of Essex, research professor at DIW Berlin, and re-search fellow at IZA Bonn and CHILD Turin. Christian Schluter is a reader at the University of South-ampton and research associate at CASE, LSE. The paper uses data from public-use BHPS and GSOEP files together with the 2001 edition of the Cross-National Equivalent File (data available via http:/ / www.data-archive.ac.uk and http:/ /www.human.cornell.edu/pam/gsoep/gspindex.cfm). The Stata code used for data extraction and analysis is available from Jenkins beginning June 2003 through May 2006 from Jenkins (email: stephenj@essex.ac.uk). Revised version of a paper presented at the Confer-ence on Cross-National Comparative Research Using Panel Surveys, ISR, University of Michigan Ann Arbor, October 7–26, 2000, and at a NZ Ministry of Social Policy Conference, ISER (Essex), and CASE (LSE). Research funded by the Anglo-German Foundation. We also benefited from ISER’s core funding from the U.K. Economic and Social Research Council and the University of Essex and CASE’s core funding from the ESRC. For helpful comments and suggestions, we thank our conference discus-sant Dan Hamermesh, James Banks, Rich Burkhauser, Joachim Frick, John Hills, Dean Lillard, John Micklewright, Lars Osberg, Lucinda Platt, Gert Wagner, conference and seminar participants, and two anonymous referees.
[Submitted March 2001; accepted February 2002]
with incomes below half the national average income, but in Britain the proportion was more than double this figure, 32 percent (Eurostat 1997; the 12-country EU-average was 20 percent). The cross-national differences in child poverty rates have been reflected in differences in political interest in the topic in the two countries. The current U.K. government has pledged to halve the number of poor children within ten years and to eliminate child poverty altogether within 20 years (Depart-ment of Social Security 1999). By contrast, children’s poverty is much less of a political issue in Germany. In this paper we address the question of why child poverty rates differ between Britain and Germany using an analysis of differences in rates of movement into and out of poverty, and decomposing differences in poverty transi-tion rates into differences in the prevalence of ‘‘trigger events’’ precipitating poverty transitions and differences in the chances of making a poverty transition conditional on experiencing a trigger event.
The distinctive contributions of our analytical approach are, first, its cross-national comparisons and, second, the focus on transition rates and their systematic decompo-sition.The first feature is motivated by the large cross-national differences in child poverty rates: they suggest that Britain has something to learn from Germany about how to protect children from low income. And arguably Britain’s experience also provides cautionary lessons for Germany, as pressure grows to increase labor market flexibility and to introduce reforms to the welfare state similar to those instituted in Britain over the last two decades. The lessons to be learned depend on how differ-ences in German and British poverty patterns relate to differdiffer-ences in labor markets, marriage markets, and welfare states. We shed light on these issues using the decom-positions of transition rates—the second feature of our approach. Although our appli-cation is to two specific countries and to children, the analytical framework is one that also can be used in a number of other contexts.
Why take a longitudinal perspective to explaining child poverty rates? If one uses a cross-section perspective, the natural temptation is to explain cross-national poverty differences in terms of differences in the prevalence of ‘‘problem groups’’ such as lone parent families or workless households, and differences in the risk of poverty for each group. This strategy is problematic because there are substantial movements into and out of problem groups between one year and the next—households form and split; people gain and lose jobs—so the policy target is a moving one. When constructing explanations of poverty patterns it is more natural to relate behavior to transition probabilities rather than to the (state) probability of being poor, particularly since the factors that determine entry (or re-entry) to the ranks of the poor differ from the factors determining escape from poverty (as we show below). Recognizing the relevance of the dynamic dimension to explanations of poverty also has implica-tions for anti-poverty policy, changing its emphasis from supplementing incomes toward providing routes out of poverty and preventing falls into poverty (Ellwood 1998, p. 49; Treasury 1999, p. 5).
The relevance of a longitudinal perspective also can be seen from consideration of the identity summarizing the evolution of the poverty rate: this year’s child poverty rate (ht) is equal to last year’s child poverty rate times the retention rate (one minus
the exit ratext), plus the entry rate (et) times one minus the proportion of children
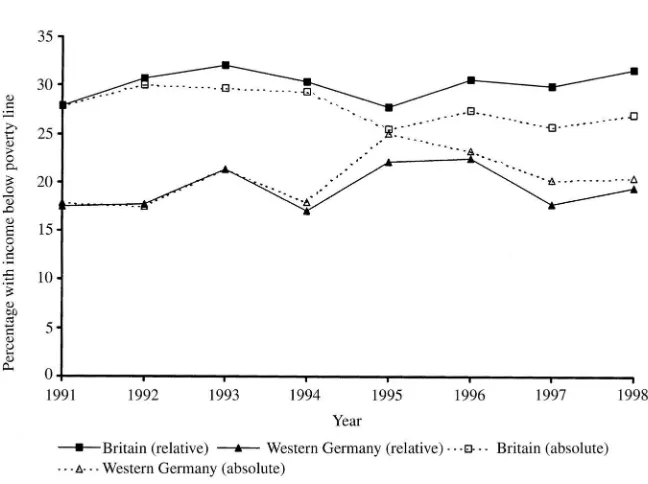
Figure 1
Child Poverty Rates (Percentages) in Britain and Western Germany, 1991–8, by Poverty Line Type
Source: Authors’ calculations from BHPS and GSOEP data
Note: The relative poverty line is 60 percent of contemporary national median income. The absolute poverty line is 60 percent of 1991 median income in Britain. Definitions explained in Section III.
(1) ht⫽et/(et⫹xt).
Thus cross-national differences in poverty rates depend only on cross-national differ-ences in poverty entry and exit rates if there is no trend in poverty rates in either country.
The relevance of Equation 1 as an organizing principle for analysis is underscored by the fact that cross-sectional child poverty rates were stable during the 1990s in both Britain and Western Germany. This is demonstrated in Figure 1, which shows that the trends in child poverty rates for each country were flat, for both a relative and an absolute poverty standard. (More precise definitions are provided later.) The greatest deviations from the flat trend occurred in the mid-1990s in each country, but one should be cautious of reading too much into these variations, as they are within the bounds of sampling variation. A 95 percent confidence band for each annual poverty rate covers about 5 percentage points for Britain and slightly more in Western Germany.
• household income changes between one year and the next, and poverty transi-tions in particular, are precipitated by ‘‘trigger events’’ such as changes in household members’ labor market attachment and earnings, or changes in their household composition; and
• these events have different impacts on the risk of a poverty transition.
It is these two dimensions that we isolate in our decompositions. We relate differ-ences between Britain and Western Germany in child poverty transition rates to cross-national differences in probabilities of trigger events, and differences in proba-bilities of a poverty transition conditional on event occurrence.1The trigger events
considered are:
• changes in the number of workers in a child’s household (working full-time and in total);
• changes in a child’s household labor earnings, holding the number of workers fixed;
• movements into and out of a single-adult household; and
• changes in the number of household members, holding household type fixed.
We argue that it is primarily cross-national differences in the chances of making a poverty transition conditional on experiencing a trigger event, rather than differ-ences in the prevalence of trigger events per se, that explain why child poverty exit rates in Britain are lower and poverty entry rates are higher than in Western Germany. The results point to the importance of the welfare-state-related differences as the principal source of Anglo-German differences in child poverty rates. In particular, relative to British children, German children are better protected against the conse-quences of adverse labor market events, and positive labor market events are re-inforced to a greater extent.
The rest of the paper is structured as follows. In Section II we set out our analytical framework. We briefly discuss in Section III what existing evidence suggests are the main sources of Anglo-German differences in child poverty transition rates, con-sidering differences in labor and marriage markets and the welfare state. In Section IV, we introduce our cross-nationally comparable data sets, subfiles from the British Household Panel Survey and German Socio-Economic Panel, and explain key defi-nitions such as the poverty line and trigger events. Child poverty transition rates for Britain and Western Germany in the 1990s are reported and discussed in Section V. The decomposition and analysis of child poverty transition rates follows in Sec-tions VI (poverty exits) and VII (poverty entries). Section VIII provides further dis-cussion and concluding comments.
II. A Framework for Examining Cross-National
Differences in Poverty Transition Rates
To fix ideas, suppose that there is a set of mutually exclusive events j⫽1, . . . ,J, which trigger exits from poverty. Then, among those children in a given country at risk of exit from poverty between one year and the next, the probability of exit is given by the sum of the probabilities for children that exit by each of the different events:
(2) pr(exit poverty)⫽
冱
J
j⫽1
pr(exit poverty via eventj).
Each term on the righthand side can be written as the product of the probability of each event and the probability of exit conditional on event occurrence:
(3) pr(exit poverty)⫽
冱
J
j⫽1
pr(exit poverty|eventj)pr(eventj).
By similar arguments, one can relate the probability that an at-risk child will enter poverty due to a set of mutually exclusive trigger events k ⫽ 1, . . . , K, to the probabilities of each event and the probability of poverty entry conditional on event occurrence:
(4) pr(enter poverty)⫽
冱
K
k⫽1
pr(enter poverty|eventk)pr(eventk).
It follows that cross-national differences in poverty exit rates can be decomposed into a weighted sum of cross-national differences in event prevalence probabilities and cross-national differences in event-conditioned poverty transition probabilities:
(5) ∆pr(exit poverty)⫽
冱
J
j⫽1
∆pr(exit poverty|eventj)wj⫹
冱
Jj⫽1
∆pr(eventj)zj
where ∆is the cross-national difference operator, wj⫽θpr(eventj)WG ⫹(1⫺θ)
pr(eventj)GB,zj⫽(1⫺θ)pr(exit poverty|eventj)WG⫹θpr(exit poverty|eventj)GB,
and 0 ⱕθⱕ1. A similar expression can be derived for cross-national differences in poverty entry rates.
or dissolution). Second, and related, with this strategy we also can compare cross-national differences in probabilities that children are born poor—Equation 3 only refers to the experience of existing children.
The third reason for focusing on decomposition components is that it is important to calculate these separately for different groups of children at risk of a poverty transition. For example, the outcomes and processes affecting exits from poverty by children in lone parent households differ from those for children in married couple households—(re)marriage is a potential route out of poverty for the former group but not the latter. Aggregation of within-group differences over at-risk subgroups would be possible in principle, but the value-added is relatively low. The strengths of our analytical approach derive from its transparent focus on the sources of the differences within each group.
The decompositions help to uncover the relative importance of the three key types of institution—labor market, marriage market, and welfare state—in explaining cross-national poverty differences.2 The effects of differences in labor market or
marriage market institutions (for example, differences in the nature and extent of active labor market policies, or differences in matrimonial law) will be revealed most obviously through differences in the probabilities of the relevant trigger events. By contrast, differences in welfare states will be most obviously revealed by cross-national differences in poverty transition exit and entry rates among those experienc-ing each event. The primary goal of Western welfare states is to directly modify the outcomes associated with various events using cash transfers (social assistance and social insurance benefits, and taxes).3 One factor complicating the linking of the
welfare state effect with differences in event-conditioned poverty transition probabil-ities is that the chances of escape from (or falling into) poverty for an at-risk group depend not only on the size of the event-related income change but also on the distance of the at-risk group from the poverty line, and distances may differ cross-nationally (earnings and income inequality are lower in Germany than in Britain). We controlled for distance-from-the-line effects in sensitivity analyses (discussed below).
III. Anglo-German Differences in Child Poverty
Transition Rates: Some Priors
Existing evidence provides mixed suggestions about why Britain has lower child poverty exit rates and higher child poverty entry rates than Germany does. The reasons are that some factors offset each other, the sources of the stylized facts are diverse, and the information does not necessarily refer to families with children.
2. Arguably differences in the health of the national macro-economy are another potential source of poverty differences. Our prior, however, is that macroeconomic differences reveal themselves primarily through labor market differences (which we do examine).
A. Differences in the Prevalence of Labor Market and Demographic Trigger Events
Consider first the relative prevalence of labor market and demographic trigger events. Britain is typically cited as having a more ‘‘flexible’’ labor market than Germany, and greater turnover between employment and unemployment. See, for example, Nickell (1997). On this basis one might expect that earnings mobility among persons not changing jobs to be greater in Britain than in Germany, but this may not be so: it is now well-established that Germany has higher earnings mobility than the United States (Burkhauser et al. 1998; Schluter and Trede 1999). One expects higher rates of both job loss and job gain in Britain than in Germany, but this has ambiguous implications for poverty. Higher risks of job loss lead to higher poverty entry rates, other things equal, but higher risks of job gain lead to higher poverty exit rates.
A similar argument applies to marriage market events—again existing evidence suggests that turnover is higher in Britain.4But higher risks of divorce and separation
are consistent with a higher child poverty entry rate, whereas a higher marriage risk is consistent with a higher child poverty exit rate. Fertility rates are lower in Germany than in Britain (Eurostat 2000), a factor contributing to a smaller proportion of chil-dren born into poverty.
B. Differences in Financial Consequences for Those Experiencing Trigger Events
The expected Anglo-German contrast is more clear-cut if one considers the financial consequences associated with trigger events, but here too there are factors that com-plicate conclusions. The standard view is that the German welfare state provides a better financial cushion against adverse events such as job loss than the British wel-fare state (at least over the short-term). For instance Germany provides earnings-related unemployment insurance and unemployment assistance, whereas in the United Kingdom unemployment insurance is flat-rate.5
Estimated income replacement rates vary, depending on assumptions about, for instance, household composition, work record, and earnings levels. The OECD re-cently calculated that in 1997 an unemployed married couple with two children would receive, if on unemployment insurance, a net income out of work that was 73 percent of net income at work (assuming average earnings), whereas the replace-ment rate for the corresponding U.K. family would be 64 percent (OECD 1999). Ditch et al. (1996, p. 74) estimate the net replacement rate in 1995 for a couple at half average earnings with one child aged two to be 93 percent in Germany and 62 percent in the United Kingdom. For a couple with two children, the corresponding ratios would be 101 percent and 69 percent.
Just as a high replacement ratio may be taken as evidence that one country pro-vides a better cushion against adverse events such as unemployment, a high ratio also suggests that the financial returns to the average unemployed person from taking a job are lower. If this disincentive effect is sufficiently effective, then the only
people who take jobs will be those with sufficiently high financial gains from taking a job. In this case, the probability of moving out of poverty conditional on taking on more work is likely to be higher in the high-replacement ratio country (Germany rather than Britain in this case).
Large negative income changes associated with divorce and separation have been documented for a range of countries. Burkhauser et al. (1990, 1991) drew attention to similar impacts in Germany and the United States, and Jarvis and Jenkins (1997) reported findings for Britain that were in the same range. The most plausible explana-tion for cross-naexplana-tional similarities is that gender inequalities in the labor market and home that are common across countries are more important than differences in struc-ture and coverage of the welfare state (see Holden and Smock 1991 for elaboration). Whether the positive income effects associated with (re)partnering by a lone mother are larger in Germany or Britain is also not clear. On the one hand, the German tax system provides strong financial rewards to marriage especially through its income-splitting rules (the United Kingdom has independent taxation of men and women). On the other hand, these rewards also provide an incentive for a married woman not to work. If (re)partnering is with someone with low labor attachment (and who remains so), then the reduction in the risk of poverty associated with (re)partnering may be relatively low.
In sum, the most clear-cut hypotheses about Anglo-German differences are:
• the probability of job gain, and the associated conditional probability of exit-ing poverty, are each higher in Britain than in Germany (havexit-ing offsettexit-ing impacts on cross-national differences in the overall poverty exit rate).
• the probability of job loss, and the associated conditional probability of enter-ing poverty, are each higher in Britain than in Germany (haventer-ing reinforcenter-ing impacts on cross-national differences in the overall poverty entry rate).
• the probability of household formation is higher in Britain than in Germany (contributing to a higher poverty exit rate in Britain), but
• the probability of household dissolution is also higher in Britain (contributing to a lower poverty exit rate in Britain).
The evidence concerning Anglo-German differences in the conditional probabilities of poverty transition associated with demographic changes is less clear-cut. Overall, the fact that there are many factors potentially at work, some of which may offset others, underlines the need for a systematic disaggregated analysis.
IV. Data and Definitions
A. The BHPS and GSOEP, and Sample Numbers(foreign-born residents and their children) recruited abroad during the economic booms of the 1960s. Original sample respondents have been followed and they (and co-resident adults) have been interviewed at approximately one year intervals subse-quently. Children in original sample households also have been interviewed in their own right when they became adults. We use survey weights in our analysis in order to account for differential nonresponse and attrition (and the differential sampling probabilities of GSOEP guest worker sample members).
We focus on the period 1991–98 because the BHPS does not cover the 1980s as the GSOEP does. Our German sample for each year consists of the adults and chil-dren residing in the La¨nder (states) that comprised the former West Germany ‘‘West-ern Germany’’ for short.6We do not consider those living in the former East
Ger-many: the huge changes in the region’s economy and institutions over the 1990s after reunification would muddy the cross-national comparison with Britain. In any case, we calculate that child poverty rates in Eastern Germany fell significantly over this period (Jenkins et al. 2001), whereas they changed relatively little in both Britain and Western Germany (Figure 1).
Our analysis subsamples consist of those individuals in households with non-missing data on income and household composition. For Britain there is information over the eight waves for some 18,731 different individuals of whom some 4,819 are children—defined by us to be those individuals aged under 17 years—resulting in 99,876 person-year observations (23,169 for children, 76,707 for adults). For West-ern Germany, there is information for some 16,450 individuals (4,494 children), resulting in 95,023 person-year observations (20,988 for children, 74,035 for adults). We have unbalanced panels for each country. Only about one-third of all the children ever present in each panel were present in all eight waves, the main reason being that a significant number of them were born after 1991. Taking each cross-section of data separately, there are approximately 2,500 children in Western Germany and approximately 2,800 in Britain. Although these are relatively large samples when all children are considered together, the numbers in some subgroups (notably lone parent and ‘‘other’’ households—defined below) are quite small in any given year: some 200–300 children or fewer (with the number of households smaller still). Hence most analysis of subgroups is based on data pooled from all eight waves. Two factors reduce sample sizes a little further in some calculations (and are reflected in larger standard errors). First, variables summarizing the total number of workers in a household (defined below) have missing values for households in which there was at least one adult that did not provide an interview.7Second, in our analysis of
poverty entries and exits we focus attention on those individuals who were children at two consecutive waves.
B. The Definition of Income and the Poverty Line
We count an individual as being poor if the needs-adjusted real net annual income of the household to which he or she belongs—‘‘income’’ for short—is less than
6. More specifically, we use persons from GSOEP samples A–D if they satisfy the condition about current residence. We do not use new supplementary sample E (the 1998 Erga¨nzung sample).
the poverty line. Household net income is the sum across all household members of cash income from all sources (income from employment and self-employment, investments and savings, private and occupational pensions, and other market in-come, plus cash, social security, and social assistance receipts), minus direct taxes. The needs adjustment is done using an equivalence scale according to which each household income was deflated by a household equivalence factor,m, where
(6) m⫽[(number of adults)⫹α*(number of children)]β, andα
⫽0.7,β⫽0.75.
This equivalence scale is one of the two-parameter scales recommended by the U.S. National Research Council Panel on Poverty and Family Assistance (Citro and Mi-chael 1995). In order to consider the sensitivity of results to changes in the equiva-lence scale, we repeated our analyses using three other scales: (α,β)⫽(0.7, 0.5), (0.5, 0.75), (0.5, 0.5).8The effects of changing the scale on poverty transition rate
patterns were minor (Jenkins and Schluter 2001). Incomes were deflated to 1998 prices using a national price index (source: IMF Financial Statistics). Household income measures are based on variables available in the 2001 edition of the Cross-National Equivalent File, a derived variable subfile of comparable cross-national data from the GSOEP and the BHPS (and the U.S. PSID and Canadian SLID): see Burkhauser et al. (2000) and Bardasi et al. (1999) for further details.
The poverty line that we use is 60 percent of contemporary national median in-come, a threshold recommended by the Eurostat Task Force (1998) for cross-national poverty comparisons. For Britain, this corresponds to a 1991 poverty line of £4,665 per annum, slightly higher cutoffs in each successive year, with a 1998 poverty line of £5,166, some 11 percent higher than the 1991 one. These changes reflect the economic growth over the decade as the economy came out of recession after 1991. Germany’s recession came later, starting around 1992–93, with recovery not until the end of the period that we consider. As a result, median income, and the poverty line we use, followed a relatively flat trend over time. The poverty lines are DM 15,195 for survey year 1991 and DM 15,008 for 1998 (about 1 percent lower than the 1991 level), varying in between by at most 5 percent.
The use of a poverty line that varies in value according to the distribution being considered—a ‘‘relative’’ poverty line by contrast with an ‘‘absolute’’ poverty line that is fixed in real terms across years and countries—is potentially controversial. Measures of relative poverty are sensitive to differences in inequality as well as the incidence of low income per se (and relative poverty rates may rise even if all in-comes have risen). But this is a property of relative measures, rather than a funda-mental criticism. Relative poverty lines of the type that we employ are widely ac-cepted in Europe. It is a specification reflecting the European Union’s definition of poverty.9Moreover the U.K. government has officially adopted this relative poverty
8. See Jenkins and Cowell (1994) for analysis of the sensitivity of poverty and inequality indices to changes inαandβ. They show that the scale with (α,β)⫽(0.5, 0.75) broadly corresponds to the semi-official British equivalence scale (the so-called ‘‘McClements before housing costs’’ one). With this scale, the British child poverty rates are lower than reported here, and correspond more closely to those reported in the official poverty statistics (for example, Department of Social Security 2000).
fraction-of-national-definition for monitoring progress toward its goal of eradicating child poverty (De-partment of Social Security 1999). The report of the U.S. Research Council Panel on Poverty and Family Assistance also suggested that the U.S. official poverty line should be updated in line with secular income growth (Citro and Michael 1995).
We repeated all our analysis using an absolute poverty line set equal to 60 per-cent of the 1991 British median income (£4,665, or DM 15,355 when converted at the 1991 OECD purchasing power parity). Our results changed little (Jenkins and Schluter 2001). The reason is that, over the 1990s, not only was secular growth in median income relatively small, but the shape of the income distribution changed hardly at all, in both countries.
For both fraction-of-median-based absolute and relative poverty lines, child pov-erty rates are higher in Britain than in Germany—that is, the povpov-erty line corresponds to a higher percentile of the income distribution in Britain than Germany. One might argue in this case that the nature of the population at risk of a poverty transition is rather different in each country, thereby introducing noncomparability into the analy-sis. To address this concern we also repeated our analysis using a low-income thresh-old equal to the 20th percentile of the all-persons income distribution in each country in each year, thus ensuring that exactly 20 percent of persons were poor. The effect was to narrow estimated cross-national differentials in many decomposition esti-mates, but the general tenor of our conclusions was not altered (Jenkins and Schluter 2001).
Given a definition of the poverty line, we define a poverty entry as a change in income from being above the line in one year to below the line in the subsequent year. A poverty exit is a change in income from below the line to above the line. Arguably these definitions are oversensitive to small changes in income for individu-als close to the poverty line, and may pick up ‘‘nongenuine’’ poverty transitions. To check the robustness of our results, we redefined poverty exits as an income increase from below the poverty line to at least 10 percent above the poverty line, and a poverty entry as an income fall from above the poverty line to at least 10 percent below the poverty line. The change in definition reduced the estimated mag-nitude of each poverty transition statistic, for both countries, but did not change the cross-national pattern of differences and thence our conclusions (Jenkins and Schluter 2001).
C. The Definition of Demographic and Labor Market Variables, and Trigger Events
We classified children in several ways according to the type of household they lived in and by household labor market attachment. Changes in classifications between one year and the next were used to define trigger events.
We defined a ‘‘lone parent household’’ to be a household containing one adult plus one or more children. A ‘‘married couple household’’ is a household containing two or more adults with or without children, where the spouse of the head of
hold is present. (‘‘Married’’ refers to both legal marriages and cohabiting unions.) Some 15 percent of British children and 9 percent of Western German children lived in lone parent households (pooled data for 1991–98). About 80 percent of all children lived in married couple households in Britain and 90 percent in Western Germany. The remaining group of ‘‘other’’ households comprised two or more adults living together with or without children and where the household head has no spouse pres-ent. Included under this heading may have been a lone parent and her children sharing the household with unrelated adults (for example, another lone parent family) or the lone parent’s own parents. Thus our ‘‘lone parent household’’ group did not include all lone parents and their children. On the other hand, the fraction of all children in the ‘‘other’’ group was small: 4 percent in Britain, 2 percent in Western Germany. We defined an adult household member to be a ‘‘worker’’ if his or her annual labor earnings were positive, and he or she worked at least 52 hours over the reference year (defined below). Full-time workers were those who worked 1,500 or more hours per annum. For each child we calculated the number of workers and the number of full-time workers in his or her household.
Trigger events were identified from year-on-year changes in demographic and labor market characteristics of each child’s household. For example, ‘‘demographic’’ events include a change in household size (conditioning on no change in household type), and entry to and departure from a lone parent household. ‘‘Labor market’’ events include a change in the number of workers (full-time and in total), and a change in real (unequivalized) household labor earnings of at least 20 percent condi-tioned on there being no change in the total number of workers in the household.10
Our aim was to distinguish between job gains and losses and ‘‘pure’’ earnings changes, where the latter are driven primarily by changes in the annual work hours of household members that did not involve job change(s). The threshold of 20 percent was chosen to ensure that transitory earnings variations were not counted as events. Each event was considered independently, one at a time, though we also considered some jointly occurring events.
D. The Reference Periods for Income, Household Characteristics, and Trigger Events
Age, sex, and household type and composition are variables measured at the date of interview in each survey year, which is typically in the autumn for BHPS respondents (October is the modal interview month) and in the spring for GSOEP respondents (March is the modal interview month). The reference period over which annual household income (and labor earnings) are calculated is, for the BHPS, the 12 months up to September 1 of the survey year (for example from September 1, 1996 to August 31, 1997 for survey year 1997) and, for the GSOEP, the reference period is the calendar year prior to the survey year. In both surveys, household incomes are de-rived by aggregating the incomes of all the household members present at the time of the interview (incomes of members who left during the year are not counted).
There is therefore a potential mismatch in timing between demographic events over the yeart⫺1 totand changes in annual income.11In particular the reference
period for annual income for households surveyed in yeart partially overlaps the survey date at yeart⫺1. As a result, authors such as Burkhauser et al. (1986), Burk-hauser et al. (1990, 1991), and DiPrete and McManus (2000), have taken events measured between interviews att⫺1 andtand compared them with annual household incomes at yearst⫺1 andt⫹1. The problem with this convention is that calculations of incomes att⫹1 may be based on a different set of individuals than those present att: there is substantial flux in household membership over time. Hence the income change calculation may reflect this subsequent change rather than the trigger event of interest.12Observe too that trigger events relating to arrivals and departures of
household members already have some impact on yeartincome, because household incomes are calculated only for the individuals forming the household at the yeart interview.
In our view, therefore, the appropriate choice of observation window width for income changes is not clear-cut (and may depend on the particular event under con-sideration). We considered income changes both between yearst⫺1 andtand be-tween yearst⫺1 andt⫹1. The largest differences between corresponding statistics are likely to arise in the changes in poverty risks estimated to be associated with significant changes in household composition, as with a household split forming a lone parent household. In this case, the immediate income change—typically a sharp fall—is likely to differ from the net change in circumstances over a longer period (during which eligibility for government transfers or child support is established). By contrast changes in income between t and t⫺1 are better matched with the changes betweentandt⫺1 in household labor earnings or the number of workers in the household—these variables have the same reference period, by construction.
V. Anglo-German Differences in Child Poverty
Transition Rates
Before proceeding to the decomposition analysis, we summarize the cross-national differences in annual poverty exit and entry rates for children that are to be examined. The poverty line is 60 percent of contemporary national median income. Table 1 displays the transition rates broken down by child’s household type in the year prior to the potential transition. Also shown are the pooled cross-sectional poverty rates for each group.
The estimates in the first row of Table 1, for all children, are the basis of our earlier claim that child poverty exit rates are lower, and child poverty entry rates
Table 1
Annual Poverty Rates and Poverty Exit and Entry Rates for Children (pooled data, 1991–98)
Percentage Percentage
Percentage Poor Exiting Poverty Entering Poverty
Western Western Western
Child’s Household Type Britain Germany Britain Germany Britain Germany
All children 30.1 19.4 25.0 36.1 11.3 7.1
(0.5) (0.6) (1.0) (2.1) (0.5) (0.5)
Lone-parent household 68.1 49.1 20.4 33.4 24.9 17.1
(1.3) (0.3) (1.5) (5.1) (2.4) (3.5)
Married couple household 22.4 16.3 27.3 36.2 9.9 6.4
(0.5) (0.6) (1.3) (2.3) (0.5) (0.5)
‘‘Other’’ household 46.4 33.3 27.1 51.2 23.1 16.7
(2.6) (3.6) (4.1) (7.9) (3.2) (5.0)
Note: All cross-national differences in corresponding rates are statistically significant withp⬍0.01, except for the differences in the entry rates for children in lone-parent households (p⫽0.07) and ‘‘other’’ house-holds (p⫽0.28). Standard errors (adjusted for the nonindependence of the incomes of multiple children per household) are shown in parentheses. Transition rates calculated as the number of poverty transitions between yearst⫺1 andt, divided by the number of children at risk of a transition in yeart⫺1 (sample restricted to individuals who are children at yearst⫺1 andt; child’s household type measured att⫺1). Poverty line⫽60 percent of contemporary national median income.
are higher, in Britain than in Western Germany. (Differences are statistically signifi-cant: see the table note.13) The difference in exit rates (25 percent compared to 36
percent) is much larger in absolute terms than the difference in entry rates (11 percent compared to 7 percent), but in proportionate terms the differential is larger for the entry rate (and larger than four-tenths in both cases).
The all-children differentials in transition rates are echoed when one considers children in each of the three household type subgroups separately. At the same time there are some cross-national similarities. For example, in both Britain and Western Germany, children from lone parent households have below (national) average pov-erty exit rates and above average povpov-erty entry rates. Children from married couple households in both countries below average poverty entry rates (poverty exit rates are about average).
VI. Trigger Events and Movements Out of Child
Poverty
We analyze exits from poverty by children in lone-parent households separately from those by children in married couple households. The demographic trigger events considered are a fall in the child’s household size—this corresponds, for example, to an older sibling becoming nondependent or leaving home—plus, for the former group, leaving a lone-parent household (for example by (re)marriage of the custodial parent). The other trigger events analyzed are labor market ones: an increase in the number of workers, full-time workers in particular, and increases in labor earnings with no change in the number of workers.
A. Exits from Poverty by Poor Children in Lone-Parent Households
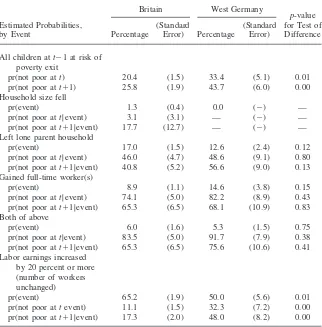
The estimates for poor children from lone-parent households are shown in Table 2. The first row of the table shows the exit rates for this group as a whole over a one-year interval (t⫺1 to t)—as shown earlier in Table 1—whereas the second row shows the exit rate for the period t⫺1 tot⫹1). With a longer observation window exit rates are slightly higher in both countries, but the statistically significant cross-national differential persists. The remaining rows of Table 2 report the estimates of the two types of statistics for five trigger events: pr(event) defined over the period t⫺1 to t, and pr(poverty exit|event) for each of the two observation periods. De-creases in household size are very rare, so we do not consider this event further. Many of the estimates are imprecisely estimated—a consequence of the small number of lone parent households in West Germany. But some patterns emerge nonetheless.
We look first at the cross-national differences in the probability of trigger events. Table 2 suggests that the chances of moving out of a lone-parent household over a one-year interval are larger in Britain than Western Germany (17 percent compared to 13 percent,p⫽0.12). The cross-national relativity is reversed, however, for the chances of gaining a full-time worker: in Britain the probability is about 0.09 but almost 0.15 in Western Germany (though the difference is of borderline statistical significance: p⫽0.15). On the other hand, the probability of the joint occurrence of these two events is much the same in the two countries, 5–6 percent. Put another way, of those children with gains in the number of full-time workers, in Britain the majority also moved out of a lone-parent household, whereas a minority did in West-ern Germany.
The most striking cross-national difference in trigger event occurrence is in the prevalence of an increase in real household labor earnings, experienced by almost two-thirds of British children, but only about one-half of Western German children (65 percent versus 50 percent,p⫽0.01). Both estimates are much larger than the probability of increases in the number of full-time workers. Thus it appears that, in both countries, increases in annual work hours (for already-working households) are more common among poor lone-parent households than are moves into full-time work.
Table 2
Poverty Exits by Poor Children in Lone-Parent Households (pooled data, 1991–98)
Britain West Germany
p-value Estimated Probabilities, (Standard (Standard for Test of by Event Percentage Error) Percentage Error) Difference All children att⫺1 at risk of
poverty exit
pr(not poor att) 20.4 (1.5) 33.4 (5.1) 0.01 pr(not poor att⫹1) 25.8 (1.9) 43.7 (6.0) 0.00 Household size fell
pr(event) 1.3 (0.4) 0.0 (⫺) — pr(not poor att|event) 3.1 (3.1) — (⫺) — pr(not poor att⫹1|event) 17.7 (12.7) — (⫺) — Left lone parent household
pr(event) 17.0 (1.5) 12.6 (2.4) 0.12 pr(not poor att|event) 46.0 (4.7) 48.6 (9.1) 0.80 pr(not poor att⫹1|event) 40.8 (5.2) 56.6 (9.0) 0.13 Gained full-time worker(s)
pr(event) 8.9 (1.1) 14.6 (3.8) 0.15 pr(not poor att|event) 74.1 (5.0) 82.2 (8.9) 0.43 pr(not poor att⫹1|event) 65.3 (6.5) 68.1 (10.9) 0.83 Both of above
pr(event) 6.0 (1.6) 5.3 (1.5) 0.75 pr(not poor att|event) 83.5 (5.0) 91.7 (7.9) 0.38 pr(not poor att⫹1|event) 65.3 (6.5) 75.6 (10.6) 0.41 Labor earnings increased
by 20 percent or more (number of workers unchanged)
pr(event) 65.2 (1.9) 50.0 (5.6) 0.01 pr(not poor attevent) 11.1 (1.5) 32.3 (7.2) 0.00 pr(not poor att⫹1|event) 17.3 (2.0) 48.0 (8.2) 0.00
Note: Standard errors (adjusted for the nonindependence of the incomes of multiple children per household) are shown in parentheses. Events refer to changes between yearst⫺1 andt. Total (unweighted) number of children at risk of poverty exit⫽1668 (Britain), 394 (Western Germany). Poverty line⫽60 percent of contemporary national median income.
small for departures from lone parenthood, though the estimates themselves are quite high in each country: just under one half. When the observation period is extended a further year, a cross-national differential is more apparent, with the conditional poverty exit rate becoming higher for Western Germany than Britain (57 percent versus 41 percent,p⫽0.13).
Western Germany, 82 percent (though the cross-national difference is not statistically significant). Extension of the observation period moderates these estimates some-what, to a probability of around two-thirds in both countries. Experience of both events increases the conditional poverty exit rates, as expected, though by less in Britain than Western Germany.
There is a striking, statistically significant, difference in poverty exit chances for those experiencing increases in household labor earnings. About one-third of the German children experiencing this event left poverty over the same period, compared to just over one-tenth of British children (32 percent versus 11 percent,p⫽0.00). The cross-national differential is even marked after a further year: 48 percent com-pared to 17 percent (p⫽0.00).
Assembling the evidence, we can point to several related reasons why poverty exit rates for children in poor lone-parent households are higher in Western Germany than Britain. In Germany the likelihood of a move into full-time work is higher, and when this occurs, it has a greater poverty reduction impact than in Britain (subject to caveats about statistical significance). Although increases in labor earnings due to increases in work hours among already-working households are more common in Britain than in Western Germany, this factor contributes to reducing the cross-national differential in poverty exit rates. What must be offsetting this are, for exam-ple, the much larger chances in Western Germany of poverty exit associated with an earnings increase. Similarly the higher rate of departure from lone parenthood for British children contributes to reducing poverty exit differentials, but this factor is offset by the larger positive financial consequences of repartnering for German children.
Overall it appears that the cross-national difference in child poverty exit rates is explained more by the differences in what happens to income conditional on more work (or repartnership), rather than more work per se. This in turn suggests the key importance of the German tax and benefit system for reinforcing the income impact of more work. In this light, the results suggest that recent British active labor market policies such as the New Deal for Lone Parents, intended to increase employment rates, will indeed have an anti-poverty effect, particularly if they increase the pro-portion of lone parents working full-time, but these policies will be significantly reinforced if the rewards from working also are increased. Thus other recent British policy initiatives in the late 1990s—after the time span of our data—that raised the benefits paid to parents working full-time (first via Family Credit and, since October 1999, the Working Family Tax Credit) are measures likely to reduce the cross-national differential in child poverty exit rates in future.14
B. Exits from Poverty by Poor Children in Married Couple Households
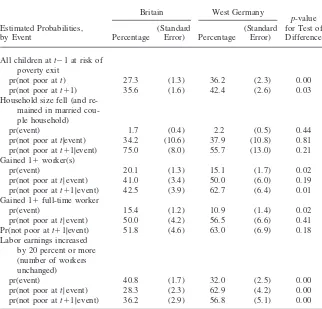
Anglo-German differences in poverty exit rates for poor children in married couple households are large: around 27 percent in Britain compared with about 36 percent in Western Germany (p⫽0.00). This differential remains if the observation period is extended a further year (the exit rates are then 36 percent and 42 percent
Table 3
Poverty Exits by Poor Children in Married Couple Households (pooled data, 1991–98)
Britain West Germany
p-value Estimated Probabilities, (Standard (Standard for Test of by Event Percentage Error) Percentage Error) Difference All children att⫺1 at risk of
poverty exit
pr(not poor att) 27.3 (1.3) 36.2 (2.3) 0.00 pr(not poor att⫹1) 35.6 (1.6) 42.4 (2.6) 0.03 Household size fell (and
re-mained in married cou-ple household)
pr(event) 1.7 (0.4) 2.2 (0.5) 0.44 pr(not poor att|event) 34.2 (10.6) 37.9 (10.8) 0.81 pr(not poor att⫹1|event) 75.0 (8.0) 55.7 (13.0) 0.21 Gained 1⫹worker(s)
pr(event) 20.1 (1.3) 15.1 (1.7) 0.02 pr(not poor att|event) 41.0 (3.4) 50.0 (6.0) 0.19 pr(not poor att⫹1|event) 42.5 (3.9) 62.7 (6.4) 0.01 Gained 1⫹full-time worker
pr(event) 15.4 (1.2) 10.9 (1.4) 0.02 pr(not poor att|event) 50.0 (4.2) 56.5 (6.6) 0.41 Pr(not poor att⫹1|event) 51.8 (4.6) 63.0 (6.9) 0.18 Labor earnings increased
by 20 percent or more (number of workers unchanged)
pr(event) 40.8 (1.7) 32.0 (2.5) 0.00 pr(not poor att|event) 28.3 (2.3) 62.9 (4.2) 0.00 pr(not poor att⫹1|event) 36.2 (2.9) 56.8 (5.1) 0.00
Note: Standard errors (adjusted for the nonindependence of the incomes of multiple children per household) are shown in parentheses. Events refer to changes between yearst⫺1 andt. Total (unweighted) number of poor children at risk of poverty exit⫽3,410 (Britain), 2,464 (Western Germany). Poverty line⫽60 percent of contemporary national median income.
tively, p⫽0.03). See Table 3, which also displays probabilities broken down by types of trigger event.
increases in household labor earnings among already-working households and, as for children in poor lone-parent households, the proportion is higher in Britain than in Western Germany, 41 percent compared with 32 percent (p⫽0.00). Other things equal, these differences would lead to higher poverty exit for Britain which of course is not the actual case. Working in the opposite direction are the cross-national differ-ences in the financial consequdiffer-ences of the trigger events.
Among Western German children with an increase in the number of household members working, 50 percent also exit poverty, but among British children experi-encing the same event, the fraction is lower at 41 percent, though not statistically significant (p⫽0.19). However, after a further year, the differential is even larger and statistically significant: 63 percent compared to 43 percent (p⫽0.01). A similar pattern is observed for the cross-national differentials in poverty exit chances associ-ated with an increase in the number of full-time workers (but the small cell sizes mean that the cross-national difference is statistically insignificant).
Particularly striking is the cross-national difference in poverty exit rates associated with an increase in household labor earnings among already-working households. Almost two-thirds of German children experiencing this event leave poverty after a year, but less than one-third of British children (63 percent versus 28 percent, p⫽0.00). Another year later the cross-national differential is smaller but still large: the proportions that are nonpoor are 57 percent and 36 percent, respectively (p⫽ 0.00).
Overall, the estimates suggest that, as was the case for children in lone-parent households, Anglo-German differences in child poverty arise from differences in the financial consequences associated with events rather than differences in event prevalence. Indeed, by themselves the latter would imply higher exit rates in Britain. The potential importance of policies recently introduced in Britain, such as the Work-ing Family Tax Credit—available to all low-income workWork-ing parents, not only lone parents—is again underlined.
VII. Trigger Events and Movements into Child
Poverty
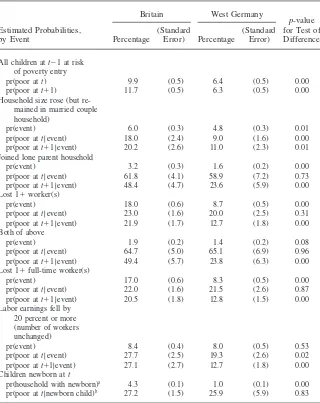
We now turn to consider entries to poverty. We only analyze what happens to nonpoor children from married couple households as sample numbers for nonpoor children in other household types are small. The estimates are reported in Table 4. The first row shows that poverty entry rates among all children in the at-risk group are higher in Britain than in Western Germany (10 percent compared with 6 percent,p ⫽0.00) and this differential is slightly larger still if a two-year interval is used (12 percent compared with 6 percent,p⫽0.00).
Table 4
Poverty Entries by Nonpoor Children in Married Couple Households (pooled data, 1991–1998)
Britain West Germany
p-value Estimated Probabilities, (Standard (Standard for Test of by Event Percentage Error) Percentage Error) Difference
All children att⫺1 at risk of poverty entry
pr(poor att) 9.9 (0.5) 6.4 (0.5) 0.00 pr(poor att⫹1) 11.7 (0.5) 6.3 (0.5) 0.00 Household size rose (but
re-mained in married couple household)
pr(event) 6.0 (0.3) 4.8 (0.3) 0.01
pr(poor att|event) 18.0 (2.4) 9.0 (1.6) 0.00 pr(poor att⫹1|event) 20.2 (2.6) 11.0 (2.3) 0.01 Joined lone parent household
pr(event) 3.2 (0.3) 1.6 (0.2) 0.00
pr(poor att|event) 61.8 (4.1) 58.9 (7.2) 0.73 pr(poor att⫹1|event) 48.4 (4.7) 23.6 (5.9) 0.00 Lost 1⫹worker(s)
pr(event) 18.0 (0.6) 8.7 (0.5) 0.00
pr(poor att|event) 23.0 (1.6) 20.0 (2.5) 0.31 pr(poor att⫹1|event) 21.9 (1.7) 12.7 (1.8) 0.00 Both of above
pr(event) 1.9 (0.2) 1.4 (0.2) 0.08
pr(poor att|event) 64.7 (5.0) 65.1 (6.9) 0.96 pr(poor att⫹1|event) 49.4 (5.7) 23.8 (6.3) 0.00 Lost 1⫹full-time worker(s)
pr(event) 17.0 (0.6) 8.3 (0.5) 0.00
pr(poor att|event) 22.0 (1.6) 21.5 (2.6) 0.87 pr(poor att⫹1|event) 20.5 (1.8) 12.8 (1.5) 0.00 Labor earnings fell by
20 percent or more (number of workers unchanged)
pr(event) 8.4 (0.4) 8.0 (0.5) 0.53
pr(poor att|event) 27.7 (2.5) 19.3 (2.6) 0.02 pr(poor att⫹l|event) 27.1 (2.7) 12.7 (1.8) 0.00 Children newborn att
pr(household with newborn)a 4.3 (0.1) 1.0 (0.1) 0.00
pr(poor att|newborn child)b 27.2 (1.5) 25.9 (5.9) 0.83
Note: Standard errors (adjusted for the nonindependence of the incomes of multiple children per household) are shown in parentheses. Total (unweighted) number of nonpoor children att⫺1 at risk of poverty en-try⫽11,630 (Britain), 12,682 (Western Germany). Poverty line⫽60 percent of contemporary national median income.
a. Proportion of married couple households attcontaining a newborn child. (The German figure is an underestimate: see text.)
for much of the difference in poverty entry rates. Moreover, the incidence of falls in household labor earnings (for example, because of working hours reductions that do not involve job loss itself ) is the same in both countries, 8 percent. What does play a marked role are differences in job loss rates. In Britain 18 percent of children experienced a decrease in the number of workers, which is twice the corresponding fraction for Western Germany, 9 percent (p⫽0.00). There is the same differential in the prevalence of decreases in the number of full-time workers (17 percent versus 8 percent,p⫽0.00).
Turning now to the poverty outcomes for children experiencing the various trigger events, we see that the choice of the observation period for income change makes a noticeable difference to the conclusions that might be drawn. For both countries, extension of the interval from one year to two leads to a reduction in the estimated proportion entering poverty and for all the trigger events (with the exception of increases in household size, and newborn children, which are discussed below). Al-though the one-year poverty entry rates are broadly similar in the two countries for each event, the fall in entry rate with the lengthening of the observation period is greater for Germany, thereby revealing a statistically significant cross-national differ-ential over the two-year interval.
Among children moving into a lone-parent household between the interviews in yearst⫺1 andt, for example, about 60 percent of children enter poverty between income yearst⫺1 andt, in both countries. But the poverty entry rate for the interval t⫺1 tot⫹1 is about 48 percent for British children, twice the corresponding entry rate for German children (24 percent,p⫽0.00). It seems that there is a sharp short-term reduction in income associated with family dissolution in both countries but, after a period of adjustment in which circumstances improve, the net effect is that greater protection against poverty is provided to German children relative to British children. A similar pattern arises with the loss of one or more workers from the household (whether full-time or not), though the poverty risks involved are somewhat smaller. Approximately one-fifth of children enter poverty in the short-run in both countries, but if the two-year observation window is used, the entry rate is around 13 percent in Western Germany but still more than one-fifth in Britain (p⫽0.00). As expected, the interval-length effect is more muted for the estimates of poverty entry rates for children who experience decreases in household labor earnings, but it remains the case that protection against joining the ranks of ‘‘working poor’’ households is less in Britain than in Western Germany. The one-year conditional entry rates are 28 percent and 19 percent respectively (p⫽0.02).
The last two rows of Table 4 provide information about the contributions to the child poverty rate by children born into already poor households. (All the calculations reported so far were based on samples of children already present in the household at yeart⫺1.) It appears that the proportion of households with a newborn child in an average year is much higher in Britain than in Western Germany: just over 4 percent compared to just 1 percent (p⫽0.00). This is, however, an overestimate of the true differential, with bias arising from the way these children are identified in the surveys.15In addition, the proportion of newborn children that were born into
poor households is much the same in both countries, about one-quarter. Both sets of statistics suggest that differences in fertility and the experiences of newborn children contribute little to Anglo-German differences in child poverty rates.
Overall, the picture for child poverty entries is not symmetric to that of poverty exits. In particular the greater prevalence of trigger events in Britain relative to West-ern Germany (for most events) now contributes to the cross-national differential in the poverty transition rate rather than offsetting it. The other main difference from the exit rate analysis is that the largest conditional poverty entry rate is for the ‘‘joining a lone-parent household’’ event, whereas the largest conditional poverty exit rate is associated with increases in the number of full-time workers. These results are con-sistent with earlier research about the population as a whole for the United States (Bane and Ellwood 1986) and Britain (Jenkins 2000; Jenkins and Rigg 2001), show-ing that the impact of demographic events was greater for poverty entries than for poverty exits.
What the entry rate decomposition analysis shares with the exit rate analysis, though, is the finding of the Anglo-German differential in the financial changes asso-ciated with given events, and this suggests once more the important role of the Ger-man welfare state. The GerGer-man tax and benefit system provides better protection to children’s incomes against adverse events than the British system does, not just better reinforcement of positive events. This is unsurprising, given the greater role played by social insurance rather than means-tested social assistance in the German welfare state.16The greater demographic and labor market turnover in Britain brings these
effects more into play in the context of poverty entries—intensifying the effects of welfare state differences—rather than offsetting them as for exits. Recent British active labor market initiatives have concentrated on increasing movements from un-employment into work and making work pay (see earlier). Our results for poverty entries highlight a potential payoff to policies in Britain that prevent job loss and promote job retention rates for those individuals who already have or get a job.
VIII. Discussion and Concluding Comments
Our aim has been to provide a longitudinal perspective on why child poverty rates are higher in Britain than in Western Germany. We argued that there was a payoff to rephrasing the question in terms of poverty transition rates: why are child poverty exit rates lower, and child poverty entry rates higher, in Britain than in Western Germany? To address these issues we have used a form of decomposition analysis, comparing cross-nationally the prevalence of events that trigger poverty (changes in household composition and household labor market attachment or earn-ings) and the chances of making a poverty transition conditional on experiencing a
in March each year, and BHPS interviews in October, so the chances of observing a newborn child (as defined) are lower in the GSOEP than in the BHPS.
trigger event. It turns out that the latter type of difference appears to be the most important, for both poverty exits and poverty entries.
These conclusions are robust to adjustments for errors in measurement of poverty transitions, and changes in the definition of the poverty line and in the equivalence scale used to adjust income for differences in needs. We also have raised questions about the appropriate reference period over which to measure the income changes associated with trigger events, an issue that has received insufficient attention in previous work. As it happens, the choice does affect some estimates, but the patterns of Anglo-German differentials remain robust.
Another issue, raised earlier, was whether Anglo-German differences in event-conditioned poverty transition rates genuinely reflect welfare state differences, or may simply arise from children being closer to the poverty line in Western Germany than they are in Britain. (Among poor children in lone-parent households in Britain the median ratio of income to the poverty line att⫺1 was 0.63, compared to 0.66 in Western Germany. For poor children in married couple households, the median ratios were 0.74 and 0.78, respectively, and for nonpoor children in married couple households, 1.72 and 1.59.) In fact, distance from the line effects are only likely to be relevant for poverty exits: if they had affected event-conditioned poverty entry rates, then we would have expected estimates to have been higher for Western Ger-many than for Britain, but the reverse was the actual case. We re-estimated all the event-conditioned poverty exit and entry probabilities controlling for distance from the poverty line, but the results were consistent with the findings described earlier.17
In sum, we are confident that the observed differences in child poverty transition rates primarily reflect differences between the German and British welfare states, in particular the German one providing a greater cushion against adverse events and better reinforcement of positive events. Differences in the prevalence rates of trigger events do, of course, also play a reinforcing role via poverty entries—a notable example being the greater risk of job loss in Britain compared to Western Germany. These empirical findings are of course consistent with the arguments rehearsed in Section II.
Our decomposition methods have applicability beyond Anglo-German compari-sons of child poverty (transition) rates. For example, there are potential applications to poverty transitions across a different set of countries (such as the European Union, perhaps based on European Community Household Panel data), or to different popu-lation subgroups (such as the elderly, with an appropriate redefinition of the relevant trigger events). The methods also could be applied to comparisons based on other types of transition data, for example, about unemployment or receipt of specific types
of cash transfer such as disability benefits. (For unemployment exits, one might distinguish between events such as recall to the same employer, re-employment with a different employer, retirement, economic inactivity.) In these cases, the decomposi-tion analysis may be more straightforward than for poverty transidecomposi-tions: if the proba-bility of a transition conditional on each event equals one, then the comparisons reduce to comparisons of probabilities of event prevalence.
References
Atkinson, Anthony B. 1998. Poverty in Europe. Oxford: Blackwell Publishers.
Bane, Mary Jo, and David T. Ellwood. 1986. ‘‘Slipping Into and Out of Poverty: The Dy-namics of Spells.’’Journal of Human Resources21(1):1–23.
Bardasi, Elena, Stephen P. Jenkins, and John A. Rigg. 1999. ‘‘Documentation for Derived Current and Annual Net Household Income Variables, BHPS Waves 1–7.’’ Working Pa-per 99-25, Institute for Social and Economic Research. Colchester: University of Essex. Downloadable from http:/ /www.iser.essex.ac.uk/pubs/workpaps/wp99-25.php.
Burkhauser, Richard V., Karen C. Holden, and Daniel A. Myers. 1986. ‘‘Marital Disrup-tion and Poverty: The Role of Survey Procedures in Artificially Creating Poverty.’’ De-mography23(4):621–31.
Burkhauser, Richard V., Greg J. Duncan, Richard Hauser, and Roland Berntsen. 1990. ‘‘Economic Burdens of Marital Disruptions: A Comparison of the United States and the Federal Republic of Germany.’’Review of Income and Wealth36(4):319–33.
———. 1991. ‘‘Wife or Frau, Women Do Worse: A Comparison of Men and Women in the United States and Germany after Marital Dissolution.’’Demography28(3):353–60. Burkhauser, Richard V., Douglas Holtz-Eakin, and Stephen Rhody. 1998. ‘‘Mobility and
Inequality in the 1980s: A Cross-National Comparison of the United States and Ger-many.’’ InThe Distribution of Household Welfare and Household Production,ed. Ste-phen P. Jenkins, Arie Kapteyn, and Bernard M.S. van Praag, 111–75. Cambridge: Cam-bridge University Press.
Burkhauser, Richard V., Barbara A. Butrica, Mary C. Daly, and Dean Lillard. 2001. ‘‘The Cross-National Equivalent File: a Product of Cross-National Research.’’ InSoziale Sicherung in einer dynamischen Gesellschaft,ed. Irene Becker, Notburga Ott, and Gabriele Rolf, 354–76. Frankfurt and New York: Campus-Verlag.
Citro, Constance F., and Robert T. Michael, eds. 1995.Measuring Poverty. A New Ap-proach.Washington D.C: National Academy Press.
Daly, Mary. 2000.The Gender Division of Welfare. The Impact of the British and German Welfare States.Cambridge: Cambridge University Press.
Department of Social Security 1999.Opportunity for All. Tackling Poverty and Social Ex-clusion.First Annual Report, Cm 4445. London: Her Majesty’s Stationery Office. Department of Social Security, 2000.Households Below Average Income 1994/5–1998/9.
Leeds: Corporate Document Services.
DiPrete, Thomas A., and Patricia A. McManus. 2000. ‘‘Family Change, Employment Tran-sitions, and the Welfare State: Household Income Dynamics in the United States and Germany.’’American Sociological Review65(3):343–70.
Ditch, John, Helen Barnes, and Jonathan Bradshaw. 1996.A Synthesis of National Family Policies 1995.York: University of York for Commission of the European Communities. Duncan, Greg J., Bjo¨rn Gustafsson, Richard Hauser, Gu¨nther Schmauss, Hans Messinger,
Ellwood, David T. 1998. ‘‘Dynamic Policy Making: An Insider’s Account of Reforming US Welfare.’’ InThe Dynamics of Modern Society: Policy, Poverty and Welfare,ed. Lutz Leisering and Robert Walker, 49–59. Bristol: The Policy Press.
Eurostat. 1997. ‘‘Income Distribution and Poverty in EU12—1993.’’ InStatistics in Focus. Population and Social Conditions 1996–7,1997–6, 1–8. Luxembourg: Eurostat. ———. 2000.Eurostat Yearbook. A Statistical Eye on Europe. Data 1988–98.
Luxem-bourg: Eurostat.
Eurostat Task Force. 1998. ‘‘Recommendations on Social Exclusion and Poverty Statis-tics.’’ Document CPS/98/31/2. Luxembourg: Eurostat.
Gottschalk, Peter, and Sheldon Danziger. 2001. ‘‘Income Mobility and Exits from Poverty by U.S. Children.’’ InThe Dynamics of Child Poverty in Industrialised Countries,ed. Bruce Bradbury, Stephen P. Jenkins, and John Micklewright, 135–53. Cambridge: Cam-bridge University Press.
Holden, Karen C., and Pamela J. Smock. 1991. ‘‘The Economic Costs of Marital Dissolu-tion: Why Do Women Bear a Disproportionate Cost?’’Annual Reviews of Sociology17: 51–78.
Jarvis, Sarah, and Stephen P. Jenkins. 1997. ‘‘Marital Splits and Income Changes: Evi-dence from the British Household Panel Survey.’’Population Studies53(2):237–54. Jenkins, Stephen P. 2000. ‘‘Modelling Household Income Dynamics.’’Journal of
Popula-tion Economics13(4):529–67.
Jenkins, Stephen P., and Frank A. Cowell. 1994. ‘‘Parametric Equivalence Scales and Scale Relativities.’’Economic Journal104(425):891–900.
Jenkins, Stephen P., and John A. Rigg. 2001.The Dynamics of Poverty in Britain.Report No. 157, Department for Work and Pensions. Leeds: Corporate Document Services. Downloadable from http:/ /www.dss.gov.uk/asd/asd5/rrep157.html.
Jenkins, Stephen P., and Christian Schluter. 2001. ‘‘Why Are Child Poverty Rates Higher in Britain than in Germany? A Longitudinal Perspective.’’ Working Paper 2001-16, Insti-tute for Social and Economic Research. Colchester: University of Essex. Downloadable from http://www.iser.essex.ac.uk/pubs/workpaps/wp2001-16.php.
Jenkins, Stephen P., Christian Schluter, and Gert G. Wagner. 2001.Child Poverty in Brit-ain and Germany.London: Anglo-German Foundation. Downloadable from http:/ / www.agf.org.uk/pubs/pdfs/1278web.pdf.
Nickell, Stephen. 1997. ‘‘Unemployment and Labour Market Rigidities: Europe Versus North America.’’Journal of Economic Perspectives11(3):55–74.
OECD. 1999.Benefit Systems and Work Incentives. Country Chapters.Paris: OECD. http:/ /www.oced.org/els/spd/index.htm (accessed September 2000).
Piachaud, David, and Holly Sutherland. 2001. ‘‘Reducing Child Poverty in Britain: an As-sessment of Government Policy.’’Economic Journal111(469):F85–F101.
Picot, Garnett, Myles Zyblock, and Wendy Pyper. 1999. ‘‘Why Do Children Move Into and Out of Low Income: Changing Labour Market Conditions or Marriage and Divorce?’’ Research Paper No. 132, Analytical Studies Branch. Ottawa: Statistics Canada. Downloadable from http://www.statcan.ca/cgi-bin/downpub/listpub.cgi?cat-no⫽11F0019MIE99132.
Preston, Ian. 1995. ‘‘Sampling Distributions for Relative Poverty Statistics.’’Applied Statis-tics44(1):91–99.
Schluter, Christian, and Mark Trede. 1999. ‘‘Local versus Global Assessments of Mobil-ity.’’ Discussion Paper No. 4/99, Department of Statistics and Econometrics. Cologne: University of Cologne.