Full Terms & Conditions of access and use can be found at
http://www.tandfonline.com/action/journalInformation?journalCode=vjeb20
Download by: [Universitas Maritim Raja Ali Haji] Date: 11 January 2016, At: 21:03
Journal of Education for Business
ISSN: 0883-2323 (Print) 1940-3356 (Online) Journal homepage: http://www.tandfonline.com/loi/vjeb20
Can Technology Improve Large Class Learning? The
Case of an Upper-Division Business Core Class
Denise Stanley
To cite this article: Denise Stanley (2013) Can Technology Improve Large Class Learning? The Case of an Upper-Division Business Core Class, Journal of Education for Business, 88:5, 265-270, DOI: 10.1080/08832323.2012.692735
To link to this article: http://dx.doi.org/10.1080/08832323.2012.692735
Published online: 06 Jun 2013.
Submit your article to this journal
Article views: 242
CopyrightC Taylor & Francis Group, LLC ISSN: 0883-2323 print / 1940-3356 online DOI: 10.1080/08832323.2012.692735
Can Technology Improve Large Class Learning?
The Case of an Upper-Division Business Core Class
Denise Stanley
California State University, Fullerton, Fullerton, California, USA
Larger classes are often associated with lower student achievement. The author tested the hypothesis that the introduction of personal response systems significantly improves scores in a 250-seat classroom, through the channels of improved attendance and engagement. She focused on how continuous participation with the technology could change learning results. The author found that overall attendance rose when the response system was introduced. Regression results show student exam performance during the semester with technology was improved significantly by I-Clicker points per session rather than attendance, while the reverse holds true regarding unannounced quizzes.
Keywords: academic performance, interactive technology, managerial economics
Traditional wisdom suggests larger classes mean lower stu-dent achievement rates or no difference in outcomes (Kokke-lenberg, Dillon, & Christry, 2008). Reduced attendance rates and less student engagement are among the most frequent problems with the large room setting (Nelson & Hauck, 2008). Lab sections, breakout groups, online posting of lec-ture notes, and classroom response systems represent a few of the methods to make student learning in a large classroom more equal to that in a small one.
In this study I used regression techniques to determine if personal response systems significantly impact student out-comes in intermediate economics. Unlike previous studies treating the response system participation as a dichotomous effect, here I analyze how the continuous usage of the re-sponse systems affects student engagement and rapid learn-ing as compared to attendance enhancements per se. I also differentiate whether the response systems impact surprise assessments in the same manner as planned tests.
I first review the literature and outline how response sys-tems could impact learning. I present data on test scores and demographic backgrounds from students in managerial eco-nomics at a large public university setting. I find that the technology improves exam performance more through im-mediate learning gains rather than an attendance boost.
The assistance of Dr. Morteza Rahmatian is greatly appreciated. Correspondence should be addressed to Denise Stanley, California State University, Fullerton, Department of Economics, 800 N. State College Boulevard, Fullerton, CA 92834, USA. E-mail: [email protected]
LITERATURE REVIEW
Personal response systems (e.g., I-Clickers) allow for im-mediate feedback to the instructor and student. They are hand-held devices in which students answer questions elec-tronically in class. These devices could make students more interested in attending and focusing during class. Students are answering anonymously, which could bring in more in-volvement from less confident participants. However, the response systems have an opportunity cost; class minutes spent on technology training and clicking could have been spent on discussion, question-and-answer periods, or other activities.
Nearly all recent statistical analyses compare class sec-tions with the response system against those without. Pos-itive correlations between the response system usage and class grades, quizzes, or exams have been noted for mar-keting (Sprague & Dahl, 2011), psychology and education research methods (Bartsch & Murphy, 2011), earth science (Gray, Steer, McConnell, & Owens, 2010), biology (Cald-well, 2007), and operations management (Yourstone, Krave, & Albaum, 2008). Most studies also include student com-ments, or statistics, showing higher student attendance rates or enthusiasm. For instance, Eastman, Iyer, and Eastman (2011) found high rates of attention and positive attitudes toward the use of the interactive technology in a required marketing course. However, Matus, Summa, and Kuschke (2011) reported no significant gain for capstone business stu-dents using response systems, when compared to their peers in online and lecture sections.
266 D. STANLEY
Bergstrom (2009) first outlined how to teach economics principles interactively using response systems. Salemi (2009) and Ghosh and Renna (2009) then demonstrated stu-dent enthusiasm as evidenced by multiple choice question response levels, higher attendance rates, and positive exit survey opinions. But Johnson and Robson (2008) found no significant difference in the grade distribution nor standard-ized exam scores in a required microeconomics principles class taught with and without response systems.
METHODS
Class Design
Economics 315 (managerial economics) is a required core course within the Bachelor of Arts in Business Administra-tion at a large public university (California State University, Fullerton). The focus instructor lectures with PowerPoint slides and offers four closed-book exams, with the stated policy that the best three would be used for 90% of the student’s final grade. The exams represent the general struc-ture of the course (economic principles, production theory and costs, advanced market structure and failure). The best two of three required surprise in-class quizzes comprise 10% of student grades. Several surprise extra credit writings are used in final grading and provide additional evidence of gen-eral attendance trends. I added up the seven days in which student presence each semester would be noted for either unannounced quizzes or extra credit.
The instructor first started teaching in a large classroom (250 seats) in 2008 and agreed to analyze the response system technology effects in 2010, with the same class time, text-book, and assessments but I-Clickers in the fall. During the first week students practiced answering questions posted on the screen. They then had eight classes in which correct per-sonal response rates formed 5% of their final grades, with less weight placed on quizzes. Each preannounced I-Clicker ses-sion involved five multiple-choice questions across a roughly 20-min section of class. This meant a reduction in the class time normally devoted to student questions.
Specification of the Links Between Section Choice, I-Clickers, and Performance
I work with a general model of student achievement, formed from the idea of the education production function (Maxwell & Lopus, 1995):
K=f (S,I,D,T,Kt−1) (1)
where S=class size (fixed), I=instructor (fixed), D= stu-dent personal demographics and workload management, T=
technology used in classroom (level of I-Clicker attendance and achievement), and Kt−1=knowledge brought to course.
I consider student learning outcomes K on planned ex-ams and surprise quiz scores. The first measure offers an
indication of student overall learning (on a scale of 0–100) whereas the second provides an indication of more immedi-ate understanding (on a scale of 0–10). The previous knowl-edge variables Kt–1are captured in the student’s cumulative
(presemester) grade point average (GPA) and previous grade in the prerequisite economic principles.
Data from a student survey provide information for the demographic and workload variables. These include student age, gender, distance from campus, whether the student was a first-generation college student, hours of work, semester credit load, and whether the student was taking the class sec-tion of his or her choice. I posited that older male students would perform better, as there has been evidence of a gender gap in economics (Anderson et al., 1994). Students whose parents did not attend college could be at a disadvantage in developing study habits and economic and financial literacy. A higher off-campus workload, as well as course load and commuting time, would reduce the time students have to study. Also, students at this campus do not know they are in a large class until the first day. If students end up in a subopti-mal class time, their ability to manage class, family, and paid work responsibilities is diminished; attendance could fall. So I included a binary survey question asking if the observed section had been the student’s top choice at registration.
I tested the hypotheses that the introduction of response systems significantly improves attendance and outcomes in the large-class setting. Initially I compared results across two semesters. But then I explored how the degree of involvement with the personal response systems affects outcomes by fo-cusing on the fall semester data. I created two continuous variables (T): T1, number of response system preannounced session days attended (sessions registered); and T2, mean points earned across sessions (total correct responses regis-tered / T1).
Granting an attendance point per day from the I-Clicker signal could increase grades in a large classroom because it gives students more news about class events. The issue of outsiders sitting in on a student’s I-Clicker session is a clear problem since photo IDs are not checked for each session. But I did not observe a negative correlation between I-Clicker attendance and points and exam scores (i.e., if person A did well on the I-Clicker questions but unprepared student B takes the exam presumably an inverse effect would occur).
The attending, yet unmonitorable, students could con-tinue to use class time on other activities (such as cell phone web browsing). So I chose an additional variable T2 (points earned per session) to gauge student involvement and active learning success. Eastman et al. (2011) considered student engagement as related to the attitude towards the class and attention paid during class. If students have negative percep-tions of a large classroom, they may be less mentally engaged, experience less immediate learning, and demonstrate wrong (or blank) answers to response questions.
Initially I am concerned that unobserved factors affect-ing a student’s involvement with response systems in the
large class could also affect learning outcomes. Unseen het-erogeneous trends such as a student’s home environment, computer usage, and social networking could mean a student who attended or engaged on session days may have an ex-tra advantage on assessments. Thus I consider my outcome regressions below using both endogenous two-stage estima-tors on Equations 2 and 3 and standard ordinary least squares techniques with robust standard errors for Equation 3:
Ti=A+
hbh∗Xhi+ω (2)
(Clicker technology level, where X includes all variables in Z and identifying variable)
Ki=a+λ∗(Ti)+
j[Bj∗(Zji)]+ε (3)
where Ki =fall 2010 student average exam or quiz score,
a=parameter to capture constant performance effect, A=
parameter to capture constant technology level choices,λ=
coefficient on I-Clicker technology degree (days or correct questions), b=coefficients on h demographic factors affect-ing participation, B=coefficients on j demographic factors affecting performance, Ti=degree of student participation
in response technology (days or mean points), Xi=student D
demographic and background knowledge Kt–1variables
(in-cluding age), Zi=student D demographic and background
knowledge Kt–1 variables, andε,ω=the error terms where
ε∼N(0,σ)ω∼N(0, 1).
I kept the equations in level form because the 2.61 kernel density estimate of Equation 3 showed no particular left or right skewness. Additionally, 95% of the observations oc-curred within two standard deviations of the mean score.
RESULTS
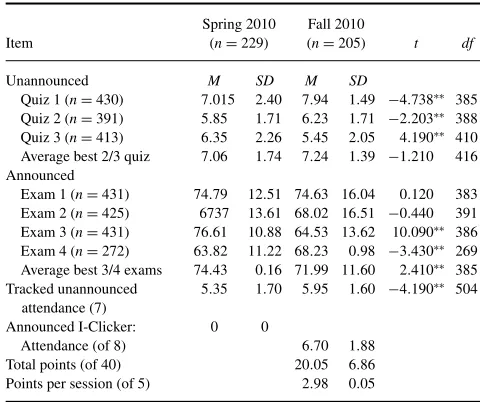
Table 1 provides a casual analysis of the effects of the per-sonal response system treatment. Fall students attended a significantly higher percentage of the seven unannounced tracked days when response systems were part of the ped-agogy. And this attendance is positively correlated with exam scores (Pearson correlation coefficient = 0.26, p =
0.000075). Even though I-Clicker days were announced in advance, some students likely developed a more regular at-tendance pattern in general. The introduction of response technology in the fall appears to improve performance on some quizzes, but not necessarily the outcome on each in-dividual exam. So at first view the results suggest a note of caution regarding response systems, as suggested in Johnson and Robson (2007).
Table 1 also includes explanatory variables for the I-Clicker technology used in the fall. Those attendance days cluster around 5–8 days and are strongly correlated with each student’s total I-Clicker points earned across the semester. However, the student points per session exhibit a different near-normal pattern. The skewness and kurtosis for points
TABLE 1
Unannounced M SD M SD
Quiz 1 (n=430) 7.015 2.40 7.94 1.49 −4.738∗∗ 385
per session was .003 and−.126, respectively; the null hy-pothesis of normality was accepted, with a joint probability chi-square test statistic of 0.06. About one third of the stu-dents answered only 2–3 questions correct per session.
The group means in Table 2 demonstrate most of the students are men, and over one third of the sample were first-generation college students. They tended to be young students working at least part-time and carrying almost a full course load. Most commuted at least 30 min to class. More than 10% considered the enrolled (large) class to have not been their first choice. Students demonstrated a moderate overall GPA and generally earned a C grade in the prerequi-site course. There are few significant differences across the semesters, except for the response system group having a smaller class load and less family college experience, which could have given the fall group a disadvantage.
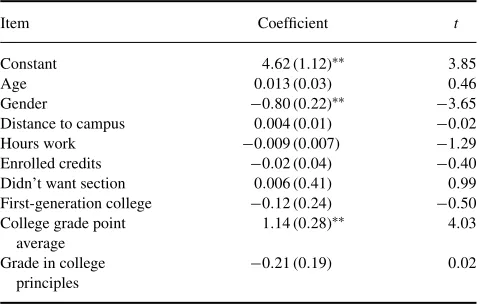
First-stage results of Equation 2 factors determining I-Clicker attendance and points per session are listed in the Appendix. I used gender and age to identify the participation processes (Equation 2) apart from outcomes (Equation 3) in a IV Tobit estimation. The joint significance of the instruments was F(1, 158) = 4.39 for the case of points per session and 12.61 on attendance level, with the later suggesting an acceptable instrument. Note that higher GPA students attended sessions more frequently and demonstrated successful active learning. Male students attended less, while older students scored fewer points per session. Distance should affect attendance, but here it plays an insignificant role perhaps due to campus impaction in which admission standards vary by local or nonlocal area student residence. But I accept the hypothesis of exogeneity between I-Clicker attendance and exams and quizzes, Wald test: χ2(1, N =
268 D. STANLEY
TABLE 2
Student Demographics and Academic Background Across Semesters/Technology
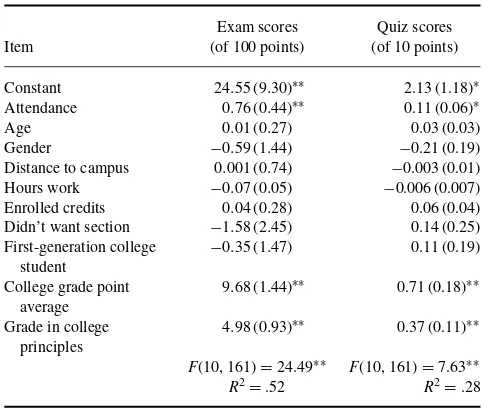
Tables 3 and 4 (using the ordinary least squares results) outline the processes affecting exam and quiz scores during the fall 2010 semester. The large F statistics demonstrate the overall significance of the regressions, with background knowledge being most important. Overall GPA and grades in principles increase scores by at least a half letter grade on exams. No gender gap appeared in the exam or quiz results, which follows the results of Marcal, Hennessy, Curren, and Roberts (2005) regarding marketing.
The results suggest a moderate, significant, effect of the response systems technology on student assessments. I turn first to attendance days in Table 3. I expect the technology to impact quiz results to a greater degree since they fall soon after the response system exercise. However quizzes are surprise assessments so students may not have all notes handy, and the coefficient on response system attendance is barely significant in Table 3. There are 100 points possible on each exam, and attending all eight possible I-Clicker days can raise the score on the margin by over a half grade (six points) compared to a student with no attendance on those days, with all other variables at their means.
And there is a modest score boost for low- and high-achieving students. I considered student characteristics at the actual values but then placed observations in a low (2.0) or high (4.0) GPA regime. The predicted score for low
GPA-TABLE 3
Fall I-Clicker Attendance Effects (n=172)
Exam scores Quiz scores Item (of 100 points) (of 10 points)
Constant 24.55 (9.30)∗∗ 2.13 (1.18)∗
,∗∗p<.05. Data in parentheses represents robust standard errors for associated coefficients.
type students increased from 57.05 to 64 for attending the eight response system sessions, while that of the high GPA-type students rose from 76.40 to 83.35, after controlling for background factors.
Table 4 demonstrates that active learning and engage-ment during the session matters. If a student answers all five questions correctly every session, exam scores rise signifi-cantly by nearly two letter grades (18 points). I predict that a student, with mean GPA and demographic characteristics, answering just one question correct per session would earn 64.50 points while one answering all five questions correct on average earns 79 points. Thus engagement during class
TABLE 4
Fall I-Clicker Performance Effects (n=172)
Exam scores Quiz scores Item (of 100 points) (of 10 points)
Constant 22.23(10.39)∗∗ 2.29 (1.24)∗
∗p<.10,∗∗p<.05. Data in parentheses represents robust standard
errors for associated coefficients.
appears to have a greater impact on student exams than does mere attendance during announced sessions. There are 10 points possible on each surprise quiz, and the effect of each correct response system question is insignificant in Table 4. Student GPA and prerequisite knowledge drive the results, and in this specification a small reverse gender bias appears.
DISCUSSION
The results suggest attendance and active learning go to-gether to increase student performance. But more successful response system sessions increase exam scores the most. It is possible that those who were the most active in answering questions successfully were those who most quickly learned with technology. Whether this relates to student learning styles and speed of material acquisition—or whether it relates to the instructor’s incentive grading technique to emphasize points—remains to be explored. But this suggests that ade-quate time for technology training—perhaps in an ungraded prerequisite session before the semester—is essential to keep all students on par.
The lack of correlation between response system atten-dance, but not achievement, and quiz results remains puz-zling. This means that if a student attends an I-Clicker day, but answers no question correctly, he or she may still have some quiz score benefit from the technology. This class pres-ence may be providing students with networking opportuni-ties and medium-term knowledge. Concept learning may not exist across a week period or in a surprise setting; but stu-dents can integrate their active learning sessions with deeper studying for an announced exam even a month later. This suggests instructors should provide follow-up tools, such as question and answer handouts after each session.
CONCLUSION
Large-sized classrooms will continue at many universities. This experiment expands the research around large-class pedagogies by offering a method to analyze the continu-ous treatment effects of response technologies on student learning. The treatment involved a moderate number of re-sponse system multiple-choice questions appropriate for the problem-solving emphasis of the class with only a small sac-rifice of class time.
Several trends emerge. First, the personal response sys-tems tend to boost unannounced class attendance overall in both semesters, and this raises scores. But the direct ef-fect of the response systems across the semesters appears mixed. Second, the degree of technology usage matters. I found that the fall 2010 semester students who partici-pated with full I-Clicker attendance received almost a half grade higher on average exam scores than students without such attendance. And points earned per session significantly raised exam scores. Interestingly, higher scores on quizzes
are significantly related more to session attendance than performance.
Overall I found the greatest benefits to student learning—and semester grades—come through how the re-sponse technology boosts overall attendance and promotes active engagement. I stress the need to encourage participa-tion through incentives such as rewarding correct responses in addition to actual attendance. Such a scheme also could discourage cheating in which a friend merely shows up and clicks for a registered student. Other surprise assessments across the semester are also important.
Limitations of the study include its focus on a single-sized room for 250 students. Whether personal response sys-tems can boost attendance and learning in even larger rooms (500 students) or smaller rooms (40 students) remains un-clear. In addition, I have not explored learning trends across different assessment formats and response system vendors. The instructor relied on in-class multiple choice questions, and student work on other problem-solving exercises (graph-ing, mathematical calculations) with response systems could show a wider variation of outcomes.
REFERENCES
Anderson, G., Benjamin, D., & Fuss, M. (1994). The determinants of suc-cess in university introductory economics courses.Journal of Economic Education,25, 99–119.
Bartsch, R., & Murphy, W. (2011). Examining the effects of an electronic classroom response system on student engagement and performance.
Journal of Educational Computing Research,44, 25–33.
Bergstrom, T. (2009). Teaching economic principles interactively: A canni-bal’s dinner party.Journal of Economic Education,40, 366–384. Caldwell, J. (2007). Clickers in the large classroom: Current research and
best-practice tips.CBE-Life Sciences Education,6, 9–20.
Eastman, J., Iyer, R., & Eastman, K. (2011). Business students’ perceptions, attitudes, and satisfaction with interactive technology: An exploratory study.Journal of Education for Business,86, 36–43.
Ghosh, S., & Renna, F. (2009). Using electronic response systems in eco-nomics classes.Journal of Economic Education,40, 354–364. Gray, K., Steer, D., McConnell, D., & Owens, K. (2010). Using a
student-manipulated model to enhance student learning in a large lecture class.
Journal of College Science Teaching,40, 86–95.
Johnson, M., & Robson, D. (2008). Clickers, student engagement and per-formance in an introductory economics course: A cautionary tale.CHEER (Computers in Higher Education),20, 4–12.
Kokkelenberg, E., Dillon, M., & Christry, S. (2008). The effects of class size on students grades at a public university.Economics of Education Review,27, 221–233.
Marcal, L., Hennessy, J., Curren, M., & Roberts, W. (2005). Do business communication courses improve student performance in introductory marketing?Journal of Education for Business,80, 289–294.
Matus, J., Summa, K., & Kuschke, R. (2011). An analysis of technology-enhanced pedagogy and learning: Student response systems (clickers)— Tool or toy?International Journal of Business and Social Science,2, 6–13.
Maxwell, N., & Lopus, J. (1995). A cost effectiveness analysis of large and small classes in the university.Educational Evaluation and Policy Analysis,17, 167–178.
Nelson, M., & Hauck, R. (2008). Clicking to learn: A case study of em-bedded radio-frequency based clickers in an introductory management
270 D. STANLEY
information systems course.Journal of Information Systems Education,
19, 55–64.
Salemi, M. (2009). Clickenomics: Using a classroom response system to in-crease student engagement in a large-enrollment principles of economics course.Journal of Economic Education,39, 385–404.
Sprague, E., & Dahl, D. (2009). Learning to click: An evaluation of the personal response system clicker technology in introductory marketing courses.Journal of Marketing Education,32, 93–103.
Yourstone, S., Kraye, H., & Albaum, G. (2008). Classroom questioning with immediate electronic response: Do clickers improve learning?Decision Sciences Journal of Innovative Education,6, 75–88.
APPENDIX TABLES
TABLE A1
First-Stage Results on I-Clicker Attendance
Item Coefficient t
Constant 4.62 (1.12)∗∗ 3.85
Age 0.013 (0.03) 0.46
Gender −0.80 (0.22)∗∗ −3.65
Distance to campus 0.004 (0.01) −0.02 Hours work −0.009 (0.007) −1.29 Enrolled credits −0.02 (0.04) −0.40 Didn’t want section 0.006 (0.41) 0.99 First-generation college −0.12 (0.24) −0.50 College grade point
average
1.14 (0.28)∗∗ 4.03
Grade in college principles
−0.21 (0.19) 0.02
Waldχ2(9)=259.32,n=172,F(9, 163)=4.23∗ ∗.
∗p<.10,∗∗p<.05. Data in parentheses represents robust standard errors
for associated coefficients.
TABLE A2
First-Stage Results on I-Clicker Points per Session
Item Coefficient t
Constant 2.25 (0.36)∗∗ 6.16
Age −0.02 (0.009)∗∗ −2.15
Gender 0.003 (0.07) 0.04
Distance to campus 0.002 (0.004) 0.05 Hours work 0.005 (0.003)∗∗ 2.04
Enrolled credits −0.004 (0.01) −0.33 Didn’t want section −0.16 (0.10) −1.51 First-generation college −0.07 (0.07) −1.04 College grade point
average
0.30 (0.09)∗∗ 3.31
Grade in college principles
0.09 (0.06) 1.47
Waldχ2(9)=293.91,n=172,F(9, 163)=3.60∗∗
∗p<.10,∗∗p<.05. Data in parentheses represents robust standard errors
for associated coefficients.