Full Terms & Conditions of access and use can be found at
http://www.tandfonline.com/action/journalInformation?journalCode=ubes20
Download by: [Universitas Maritim Raja Ali Haji] Date: 11 January 2016, At: 22:29
Journal of Business & Economic Statistics
ISSN: 0735-0015 (Print) 1537-2707 (Online) Journal homepage: http://www.tandfonline.com/loi/ubes20
Medicare Health Plan Choices of the Elderly: A
Choice-With-Screening Model
Qian Li & Pravin K. Trivedi
To cite this article: Qian Li & Pravin K. Trivedi (2012) Medicare Health Plan Choices of the Elderly: A Choice-With-Screening Model, Journal of Business & Economic Statistics, 30:1, 81-93, DOI: 10.1198/jbes.2011.0819
To link to this article: http://dx.doi.org/10.1198/jbes.2011.0819
View supplementary material
Published online: 06 Apr 2012.
Submit your article to this journal
Article views: 145
Medicare Health Plan Choices of the Elderly:
A Choice-With-Screening Model
Qian L
IUnited Biosource Corporation, Lexington, MA 02451 (qianli.econ@hotmail.com)
Pravin K. T
RIVEDIDepartment of Economics, Indiana University, Wylie Hall, Bloomington, IN 47405 (trivedi@indiana.edu)
With the expansion of Medicare, increasing attention has been paid to the behavior of elderly persons in choosing health insurance. This article investigates how the elderly use plan attributes to screen their Medicare health plans to simplify a complicated choice situation. The proposed model extends the con-ventional random utility models by considering a screening stage. Bayesian estimation is implemented, and the results based on Medicare data show that the elderly are likely to screen according to premium, prescription drug coverage, and vision coverage. These attributes have nonlinear effects on plan choice that cannot be captured by conventional models. This article has supplementary material online.
KEY WORDS: Limited decision-making ability; Markov chain Monte Carlo; Two-stage discrete choice model.
1. INTRODUCTION
Since the inception of the Medicare program in 1965, Medi-care reforms have encouraged the participation of various types of private plans to provide elderly persons with more avenues to obtain benefits beyond the basic fee-for-service (FFS) Medi-care and its supplements. Debates about the efficiency of these reforms have been ongoing for a long time. The main critiques point to the complexity related to the vast array of health plans available. But advocates believe that the large selection helps people find the plan that best fits their needs. The recent debates on Medicare Part D, which established a voluntary prescription drug benefit and became effective in 2006, also have similar features (Duggan, Healy, and Morton 2008).
We cannot evaluate the pros and cons of these policies with-out fully understanding how the elderly choose health plans. Within the framework of the standard random utility models (RUMs), agents compare and evaluate all options and then choose the best; thus they benefit from expansion of the choice set. Many previous studies have analyzed Medicare health plan choices in the RUM framework (e.g. Dowd, Feldman, and Coulam 2003; Atherly, Dowd, and Feldman 2004). But this framework has limitations when plans are complex and many plans are available. Studies have found that many Medicare beneficiaries are confused and find it difficult to compare fea-tures of available plans (Atherly 2001). Elderly persons also are likely to make suboptimal choices. For example, enrollment in Medicare health plans has been lower than expected, despite the variety and generosity of the program (Frank 2004). In ad-dition, a large proportion of the elderly selected the Medicare Part D plans that did not minimize their expected out-of-pocket drug expenses (McFadden 2006), and most felt that too many alternative plans had been offered (Heiss 2006).
The suboptimality of plan choice can be explained using concepts from the behavioral economics literature (McFadden 2005, 2006; Mullainathan and Thaler 2001; Loewenstein 1999). The complexity of the choice situation comes with a cost, often referred to as information overload (e.g., Eppler and Mengis
2003). Decision rules may be implemented by agents to re-strict the choice set and thereby reduce information overload (Tversky 1972; Tversky and Kahneman 1979; Johnson et al. 1993). The Centers for Medicare and Medicaid Services (CMS) uses attribute screening to help the elderly choose health plans. The Medicare website (https:// www.medicare.gov/ find-a-plan/ questions/ home.aspx, as accessed in 2008) provides an online “Health Plan Finder” tool that elderly persons can use to search for and compare health plans serving their residential area. The tool has two parts. For all available plans, the first part provides information on premiums, network restrictions, and whether the plan covers prescription drugs, vision services, dental services, and physical exam. The second part describes detailed plan ben-efits for the plans selected from the first part.
In analyses of health plan choice, a number of studies have considered psychological factors as part of the plan evalua-tion in the standard RUM framework (e.g., Frank 2004; Buch-mueller 1997; Strombom 2002; Frank and Lamirand 2007). In this article, we analyze health plan choice as a process consis-tent with the use of simple decision rules to reduce the choice set.
Studies in marketing science have analyzed consumers’ choice in a two-stage decision process, in which consumers first screen all of the available alternatives and then choose among the alternatives that passed the screening. Roberts and Lattin (1997) and Gilbride and Allenby (2004) have reviewed this lit-erature. The reduced choice set in the second-stage of the deci-sion process is usually unobservable to researchers. Following Gilbride and Allenby (2004), the probability of choosing alter-nativejcan be modeled as pr(j)=Cpr(j|C)×pr(C), where
Cdenotes the choice set in the second stage of the decision pro-cess. The two-stage model can relax some restrictive properties of the standard RUMs. In the standard RUMs, offering more
© 2012 American Statistical Association Journal of Business & Economic Statistics January 2012, Vol. 30, No. 1 DOI: 10.1198/jbes.2011.08191
81
options cannot increase the choice probability for the existing alternatives (Rieskamp, Busemeyer, and Mellers 2006); how-ever, in the two-stage model, more choice options may induce the agents to screen, and then an existing alternative may have a higher chance to be chosen, conditional on passing the screen.
Screening rules considered in the literature fall into two broad classes, compensatory rules and noncompensatory rules. Compensatory rule applies when an alternative is included in the second stage if its utility contribution exceeds the cognitive cost (Hauser and Wernerfelt 1990). Search models that analyze plan choice based on a comparison of costs and benefits of an additional search are essentially compensatory (McCarthy and Tchernis 2009). Noncompensatory rules rely on alternative at-tributes. An alternative passes the screen if all attributes (con-junctive rule) or at least one attribute (dis(con-junctive rule) are sat-isfactory. Noncompensatory rules are more likely to be used by agents because they require less effort to screen than compen-satory rules, which is especially relevant in the choice of health insurance, where many alternatives are offered and/or the alter-natives have many attributes (Bettman, Luce, and Payne 1998; Schram and Sonnemans 2011). The conjunctive rule has shown the best empirical performance among several screening rules (Gilbride and Allenby 2004).
The choice-with-screening model proposed in this study is a two-stage discrete choice model with a conjunctive screening rule, which is consistent with how the elderly choose their plans through the “Health Plan Finder” tool. Specifically, it assumes that the elderly screen health plans according to attributes, and that a plan can pass the screening if and only if all of its at-tributes can pass the corresponding cutoffs, where the cutoff values reflect the individual’s demand for the attributes. Con-ditional on the demographics, individual demand for each at-tribute is random and independent. After screening, the plan choice in the second stage of the decision process is analyzed using the “standard” random coefficient multinomial probit (RCMNP) model, where the individual’s preference for plan attributes also depends on the demographic data. The screen-ing behavior cannot be observed, and no data are available to indicate how the elderly value the attributes in the screening stage. Moreover, because of the large dimension of plan offers, estimating the probabilities of all possible second-stage choice sets is impossible. These features make the Bayesian approach computationally more attractive than maximum likelihood esti-mation.
The choice-with-screening model embodies additional non-linearity relative to RCMNP, and thus comes with additional parametric and functional form assumptions. This could po-tentially improve the fit to the data, but also requires that the data contain sufficient variation to identify the model. Despite the conceptual and practical difficulties in identification, the choice-with-screening model provides a useful sensitivity anal-ysis for the conclusions of the standard models. By using an RCMNP model, a flexible version of RUMs, as a benchmark, we set a high hurdle for the choice-with-screening model. Both models are estimated by Bayesian methods with similar priors, so the functional form is the main potential source to differen-tiate the identification between the two.
Our proposed screening model is an extension of the model of Gilbride and Allenby (2004). First, we link the probabil-ity that a plan attribute will be used as screen to the demand
for the attribute. This provides an economic explanation and a flexible specification of screening. For example, it can be assumed that when elderly people screen plans, they consider each attribute independently, conditional on observable factors. Moreover, we allow the demand for attributes and the resulting screening to be determined jointly across attributes by some un-observable factors. To illustrate the concept of the choice-with-screening model, we assume independent demand for attributes. We also incorporate demographic data to explain heterogeneity in choice behaviors, and analyze revealed choices of Medicare health plan instead of an analysis based solely on product at-tributes from hypothetical situations, as done by Gilbride and Allenby (2004).
To the best of our knowledge, this is the first empirical study of screening behavior in health insurance choice, a setting in which the existence of a plethora of plans with multiplicity of attributes makes the concept of information overload quite plausible and makes the screening model a more plausible de-scription than standard models (Schwartz 2004). Our screening model for the choice of Medicare health plans is relevant to modeling choices in other Medicare markets, such as Medicare Part D plans.
2. MEDICARE HEALTH PLANS
The basic Medicare FFS program has two main parts. Part A covers hospitalization and skilled nursing care. Most people are automatically enrolled in Part A without a premium require-ment when they turn 65. Disabled persosn and those with end-stage renal disease (ESRD) may also be eligible. Part B, which covers physician services and most outpatient care, is volun-tary and requires a monthly premium ($54 in 2002). More than 90% of the Part A enrollees also buy Part B. Therefore, the ba-sic Medicare FFS can be considered the default plan for the elderly. More than 90% of Medicare beneficiaries obtain addi-tional coverage from other resources, which can be categorized as plans supplementing the basic Medicare FFS, such as Medi-gap plans, employer-sponsored retiree plans, and Medicaid, and Medicare health plans, which are replacements for the basic Medicare FFS and its supplements.
Medicare health plans are provided by private insurers who contract with the CMS annually. In exchange for a payment from the CMS, the insurers agree to offer benefits to Medi-care beneficiaries in a specified service area. The plan benefits should at least be equal to those offered by the basic Medicare FFS. The plans may charge a premium for extra benefits, but only community rating is allowed. In the open enrollment pe-riod, any elderly person without ESRD can choose a Medicare health plan serving the residential area to cover the next year’s health care expenses. The enrollees also must enroll in Part B and pay the Part B premium in addition to the premium charged by the Medicare health plan.
3. MODEL SPECIFICATION
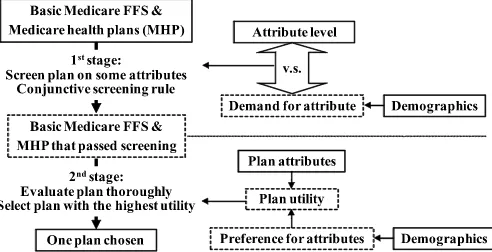
The decision process in the choice-with-screening model is presented in Figure 1. Each individual follows a two-stage de-cision process to choose one health plan from the basic Medi-care FFS and MediMedi-care health plans. In the first stage, he or she
Figure 1. Two-stage decision process of elderly person. The solid boxes represent observable data; the dashed boxes, unobservable in-formation.
screens Medicare health plans according to some plan attributes and follows a conjunctive screening rule, in which a plan can pass the screening if and only if all of the attributes can pass the screening. An attribute can pass the screening if its level can satisfy the demand for it. After screening, the beneficiary obtains a reduced choice set, from which he or she thoroughly evaluates each plan and selects the one with the highest utility. The plan utility depends on plan attributes and individual pref-erence. Both the demand for the attribute in the first stage and the preference for attribute in the second stage can be driven by demographics. To control for interest in the status quo, elderly persons are assumed not to screen the basic Medicare FFS. If all Medicare health plans are screened out, then the basic Medicare FFS will be the only plan in the second-stage choice set and will be chosen for sure.
3.1 Choice-With-Screening Model
The choice-with-screening model is specified based on the two-stage decision process described earlier. Suppose that health plan choices are independent across years, given observ-able factors. Then, for beneficiary h in year t, the two-stage decision process can be expressed as
yhtj=1 ifzhtj=arg max The first stage of the decision process is the screening stage, where the indicator function I(x˜htk,γ˜h)=1 if plan k
for individualh in yeart passes the screening and enters the second-stage choice set. The variablex˜htkcontains the attribute
information considered in screening, and the parameterγ˜h rep-resents individual demand for attributes. The relationship be-tweenx˜htkandγ˜hdefines the screening rule, which we discuss
in Section 3.2.
In the second stage of the decision process, variablezhtk is
the latent utility of plankfor individualhin yeart. The choice indicatoryhtj=1 is observed if thejth plan passes the
screen-ing and gives the highest utility in the second-stage choice set, which consists of all plans that passed the screening. This is an-alyzed using the RCMNP model with the following plan utility: zhtj=x′htjβh+εhtj, εhtj∼iid N(0,1), (3.2)
wherexhtj is a vector of plan attributes and βh is the
individ-ual preference parameter. The error term εhtj is independent
across individuals (h), years (t), and plans (j). Following Rossi, McCulloch, and Allenby (1996), the heterogeneity of individ-ual preference is imposed hierarchically by a linear regression model,
β′h=Dh×+eh, eh∼iid N(0,Vβ), (3.3)
whereDhis a row vector containing a constant term and
indi-vidual demographic information,is the coefficient,ehis the
normal error term independent across individuals, andVβis the
variance–covariance matrix of the regression.
The RCMNP imposes a simple error term in the latent util-ity equation, but can analyze both the heterogeneutil-ity and the posterior uncertainty of individual preference. The model also can capture complicated correlation patterns between the alter-natives. To see this, combine Equations (3.2) and (3.3):zhtj=
x′htj(Dh×)′+x′htje′h+εhtj=x′htj(Dh×)′+uhtj. Note that
there is no restriction imposed on Vβ; then cov(uhtj,uhtk)=
xhtjVβx′htk is generally not equal to 0, and var(uhtj)=1+
xhtjVβx′htj reflects a heteroscedastic error term. Allenby and
Rossi (1999) examined this issue in more detail.
3.2 Modeling the Screening Stage
Elderly persons are assumed to apply a conjunctive screening rule, in which a plan cannot enter the second-stage choice set if it has any attribute level that cannot satisfy the demand. In this article, attributes analyzed in the first stage of the model are defined as screening attributes, and they are possible screens. Which attributes are screening attributes is an a priori assump-tion; however, the data determine which screening attribute has a higher demand and thus is more likely to be used as a screen. The conjunctive screening rule is formed by products of in-dicator functions, where each inin-dicator function is a screening on an attribute,
I(x˜htj,γ˜h)=1, iff m
I(x˜htjm>fm(γ˜hm))=1, (3.4)
wherex˜htjmis themth screening attribute of planjfor
individ-ualh in yeart,γ˜hm is the individual demand for this attribute,
andfm(·)is a nondecreasing mapping from the individual
de-mand that defines a lower threshold or a cutoff value for the mth screening attribute. The functional form offm(·)depends
on the property of the screening attribute. The demand for the attribute is a linear regression on demographic variables, with error terms independent across individuals and attributes.
When the attribute has continuous values (e.g., premium), fm(·)is assumed to be an identity function, so that the demand
level serves as the cutoff value,
fmc(γ˜hmc )= ˜γhmc , (3.5) where the superscriptcmeans that the specification is applied to continuous attributes. The demand is
˜
γhmc = ˜D′hαcm+uhmc , uchm∼N(0, σm2), (3.6) whereD˜hcontains a constant term and demographic variables,
αcm determines the impact of demographics on screening, and uchmis the error term with varianceσm2.
An attribute also can take on discrete values (x˜htjm =
0,1,2, . . .). For example, the generosity of drug coverage can be ranked in several levels. In this case, fm(·)needs to be a
nondecreasing step function for identification purposes. In this study, the demand is assumed to have two levels: high demand and low demand. For an individual with high demand, only plans with positive attribute levels(˜xhtjm=1,2, . . .)can enter
the second-stage choice set, but the generosity of the plan at-tribute has no effect on screening given positive atat-tribute levels. Thus the high demand can be interpreted as an aversion to a zero attribute level. On the other hand, when the demand is low, any attribute level(x˜htjm=0,1,2, . . .)can pass the screening; that
is, the attribute is not used as a screen. Then the low demand can be considered to represent the individual’s indifference to the attribute in the screening stage.
For the case of high demand, any cutoff value between 0 and 1 (say 0.5) will ensure that only positive attribute levels pass the screen. For the case of low demand, a negative cutoff value (say−0.5) will ensure that no plan is screened out by this at-tribute. Then demand for the discrete screening attribute can be specified as the following latent variable model:
fmd(γ˜hmd )= where the superscriptdmeans that the specification is applied to discrete attributes.
In the screening, lower thresholds for attributes are defined. Premium is a possible screen in the study of health plan choice. But because of the budget constraint, the elderly may con-sider only plans that cost less than a certain price. So a neg-ative premium should be the argument in the screening rule, and thus the demand for negative premium (with a variance ofσ−2PREMIUM)reflects the upper threshold of premium in the screening. If all plan offers have a premium lower than the up-per threshold, then the individual is not using premium to screen plans. For a discrete screening attribute, the probability of be-ing used as a screen is equal to pr[ ˜γhmd >0]. Because demand is stochastic, different individuals can use different screening attributes or none of the screening attributes to screen. But the basic Medicare FFS is assumed to always pass the screening, which reflects people’s interest in the default plan and ensures a nonempty second-stage choice set.
4. MARKOV CHAIN MONTE CARLO ESTIMATION
We adapted the Bayesian analysis of the two-stage model proposed by Gilbride and Allenby (2004) to estimating the choice-with-screening model. The estimation uses MCMC methods in conjunction with a data augmentation approach (Tanner and Wong 1987).
Suppressing the subscripts in Equations (3.1)–(3.8), the structure of the screening model follows
y|z,I(x˜,γ˜),
z|x,β, β|D,,Vβ,
˜
γ| ˜D,α, σ2,
where the variance of the demand for screening attribute σ2
equals 1 for discrete attributes. After imposing conjugate prior distributions of the hyperparameters (,Vβ,α, σ2), the
pos-terior distribution of the hyperparameters can be simulated by drawing iteratively from the conditional distributions,
z|y,I(x˜,γ˜),x,β, (4.1) The detailed estimation algorithm is provided in Appendix A, and its performance is checked by a simulation study.
The conditional distribution of latent utility for plans in the second-stage choice set (4.1) is a normal distribution truncated from above by the latent utility of the chosen plan. If none of the Medicare health plans pass the screening and only the basic Medicare FFS is in the second-stage choice set, then the trunca-tion does not apply. In additrunca-tion, for the Medicare health plans not in the second-stage choice set, latent utility follows a non-truncated normal distribution. It is the existence of screening that leads to various latent utility distributions.
For individualh, the conditional distributions of the demand for themth screening attributes (4.5) have the expression
p[ ˜γhm|·] ∝
which is a normal distribution truncated on the supportt{p[yht|
zht,mI(x˜htm>fm(γ˜hm))]} =1. It is not analytically tractable
and thus is simulated using the accept–reject sampling (A– R) method, in which efficiency is easier to control com-pared with the Metropolis–Hastings (M–H) method (Chib and Greenberg 1995). The indicator functionp[yht|zht,mI(x˜htm>
fm(γ˜hm))] =1 ifγ˜hmleads to a second-stage choice set, where
the chosen plan is included and gives the highest latent utility. Otherwise, the value ofγ˜hmis not consistent with the observed
data or the augmented data. The inconsistency arises when ran-dom draws fromp[ ˜γhm|αm, σm2]lead to a second-stage choice
set that does not include the chosen plan, or a second-stage choice set that includes some plans whose utilities are drawn from the nontruncated normal distribution in Equation (4.1) and are higher than the utility of the chosen plan. In the model, the chosen plan must have all of its attributes pass the screen-ing, but its utility might not be the upper threshold for some plan utilities in the simulation. This feature can detect imper-missible values forγ˜hmfor all of the years’ choices and ensures
convergence of the Bayesian estimation.
5. DATA
Two datasets provided by the CMS are matched to con-struct the sample analyzed in this study. The Medicare Current Beneficiary Survey (MCBS), a nationally representative sam-ple of the Medicare beneficiaries, contains demographic and plan choice information. The Medicare Health Plan Compare (MHPC) dataset provides information of the Medicare health plans offered to the elderly. A detailed explanation of the data preparation is available on request.
5.1 Medicare Current Beneficiary Survey
The sample is selected from 2002 Access to Care file in MCBS, which includes 15,142 individuals who completed a personal interview. To focus on the Medicare health plan choices, observations are dropped if individuals were not iden-tified as “aged, no ESRD” by the CMS (n=2543) or were enrolled in any of the following plan types: Medicaid and other public plans (n=3459), employer-sponsored plans (n=4926), or Medigap plans (n=4462). After deleting observations in the foregoing categories, the sample contains 2866 observa-tions of individuals who either had only the basic Medicare FFS (n=1282) or had a Medicare health plan (n=1584).
Furthermore, observations are dropped if they changed their plan or residential area (n=717). Some 52% of the remaining
sample did not purchase any Medicare health plan. These bene-ficiaries were asked if they had heard of Medicare health plans and if they knew the availability of such plans. A beneficiary who did not know of the existence of Medicare health plans in his or her choice set was excluded from the analysis. This led to a sample of 1466 observations with 1026 Medicare health plan enrollees.
5.2 Medicare Health Plan Compare
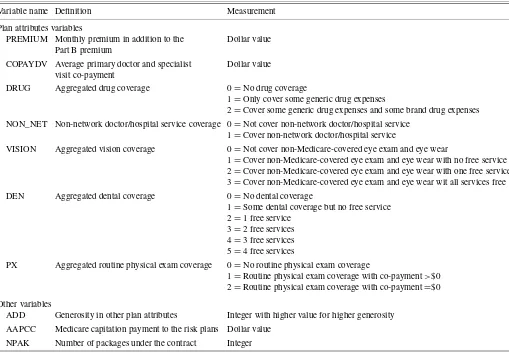
The 2002 MHPC provided plan attribute information for 567 plans (451 basic plans plus 116 optional packages) under 169 contracts signed between CMS and private insurers. The plan information includes the premium and the cost-sharing arrange-ments for a total of 38 health care categories. To control the number of parameters in the model, only seven attributes are considered in the study, including monthly premium, prescrip-tion drug coverage, non-network doctor/hospital service cov-erage, vision covcov-erage, dental covcov-erage, routine physical exam coverage, and doctor/specialist visit copayment. The health ser-vice coverage is aggregated into several levels to measure plan generosity. The definition and measurement of the plan at-tributes are presented in Table 1.
Other variables are also used to describe the health plans. A variable “ADD” is created to indicate plan generosity cap-tured by attributes other than the seven basic attributes to con-trol for the omitted plan attributes. Assuming that the Medicare
Table 1. Variables used to describe Medicare health plans
Variable name Definition Measurement
Plan attributes variables
PREMIUM Monthly premium in addition to the Dollar value Part B premium
COPAYDV Average primary doctor and specialist Dollar value visit co-payment
DRUG Aggregated drug coverage 0=No drug coverage
1=Only cover some generic drug expenses
2=Cover some generic drug expenses and some brand drug expenses NON_NET Non-network doctor/hospital service coverage 0=Not cover non-network doctor/hospital service
1=Cover non-network doctor/hospital service
VISION Aggregated vision coverage 0=Not cover non-Medicare-covered eye exam and eye wear
1=Cover non-Medicare-covered eye exam and eye wear with no free service 2=Cover non-Medicare-covered eye exam and eye wear with one free service 3=Cover non-Medicare-covered eye exam and eye wear wit all services free DEN Aggregated dental coverage 0=No dental coverage
1=Some dental coverage but no free service 2=1 free service
3=2 free services 4=3 free services 5=4 free services
PX Aggregated routine physical exam coverage 0=No routine physical exam coverage
1=Routine physical exam coverage with co-payment>$0 2=Routine physical exam coverage with co-payment=$0
Other variables
ADD Generosity in other plan attributes Integer with higher value for higher generosity AAPCC Medicare capitation payment to the risk plans Dollar value
NPAK Number of packages under the contract Integer
health plans are actuarially competitive, then among Medicare health plans inferior to the other competing plans in all of the seven basic attributes, the variable ADD is set to 1 for the plan with the least inferior basic attributes and to 2 for the plan with the second least inferior attributes, and so forth. The variable is 0 for plans not inferior in basic attributes. Another variable is the 2002 Adjusted Area Per Capita Cost (AAPCC) obtained from the State County file released by the CMS. AAPCC is the county-specific reimbursement rate for the Medicare health plans. A higher AAPCC is associated with a more generous plan in the area (Kaiser Family Foundation 2004). The number of plans under the contract, an index of insurers’ market power, is also used to describe the plans.
5.3 Matching the Medicare Current Beneficiary Survey to Medicare Health Plan Compare
Data from MCBS are matched to MHPC by county and zip code. Among the 1466 elderly persons selected from MCBS, 433 were excluded because plan information on their residen-tial area is not available in MHPC. For each Medicare health plan enrollee, MCBS reports under which contract the plan was issued. This contract was matched to the plan contracts serving the enrollee’s residential area provided by MHPC. A successful match was achieved for all but 66 of the remaining 723 Medi-care health plan enrollees, resulting in the final sample of 967 elderly persons with 657 Medicare health plan enrollees.
MCBS only identifies the contract serving the Medicare health plan enrollee, and does not specify the plan chosen by the enrollee. Because the insurer is allowed to provide multi-ple plans under each contract, strategies are needed to impute the specific plan choice for the Medicare health plan enrollees. Previous works (e.g., Atherly, Dowd, and Feldman 2004; Brand 2005) has assumed that plan enrollees choose the cheapest plan under the chosen contract. The strategy used in this study first tries to match the beneficiary’s description of a plan provided by MCBS to the plan information in MHPC, and if the plan choice is still not specified, then assumes that the plan with the most generous basic attributes is the choice.
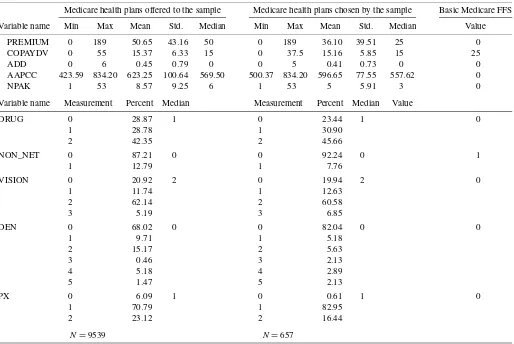
The size of the final Medicare health plan choice set for the 967 elderly persons ranged from 1 to 60 (mean 9.86±9.11). Stacking all of the choice sets, a total of 9539 Medicare health plans were offered to the sample. The descriptive statistics of the plans offered and the plans chosen by the sample are pre-sented in Table 2. The table also lists the variable values for the basic Medicare FFS. Note that the variable PREMIUM is the premium of the Medicare health plan, which is additional to the Part B premium.
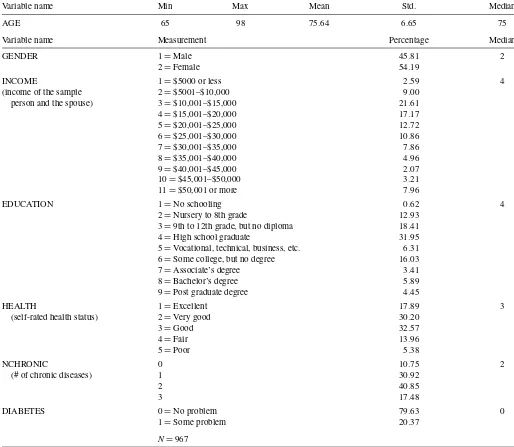
The beneficiary’s age, sex, income, education level, and self-rated health status are expected to affect the plan choice. Atherly, Dowd, and Feldman (2004) showed that the number of chronic diseases affects an individual’s desire for drug cover-age. They also showed that elderly persons with diabetes sys-tematically choose Medicare health plans with vision coverage,
Table 2. Descriptive statistics of plan variables
Medicare health plans offered to the sample Medicare health plans chosen by the sample Basic Medicare FFS
Variable name Min Max Mean Std. Median Min Max Mean Std. Median Value
PREMIUM 0 189 50.65 43.16 50 0 189 36.10 39.51 25 0 COPAYDV 0 55 15.37 6.33 15 0 37.5 15.16 5.85 15 25
ADD 0 6 0.45 0.79 0 0 5 0.41 0.73 0 0
AAPCC 423.59 834.20 623.25 100.64 569.50 500.37 834.20 596.65 77.55 557.62 0
NPAK 1 53 8.57 9.25 6 1 53 5 5.91 3 0
Variable name Measurement Percent Median Measurement Percent Median Value
DRUG 0 28.87 1 0 23.44 1 0
1 28.78 1 30.90
2 42.35 2 45.66
NON_NET 0 87.21 0 0 92.24 0 1
1 12.79 1 7.76
VISION 0 20.92 2 0 19.94 2 0
1 11.74 1 12.63
2 62.14 2 60.58
3 5.19 3 6.85
DEN 0 68.02 0 0 82.04 0 0
1 9.71 1 5.18
2 15.17 2 5.63
3 0.46 3 2.13
4 5.18 4 2.89
5 1.47 5 2.13
PX 0 6.09 1 0 0.61 1 0
1 70.79 1 82.95
2 23.12 2 16.44
N=9539 N=657
Table 3. Descriptive statistics of sample demographic
Variable name Min Max Mean Std. Median
AGE 65 98 75.64 6.65 75
Variable name Measurement Percentage Median
GENDER 1=Male 45.81 2
2=Female 54.19
INCOME 1=$5000 or less 2.59 4
(income of the sample 2=$5001–$10,000 9.00 person and the spouse) 3=$10,001–$15,000 21.61
4=$15,001–$20,000 17.17
5=$20,001–$25,000 12.72
6=$25,001–$30,000 10.86
7=$30,001–$35,000 7.86
8=$35,001–$40,000 4.96
9=$40,001–$45,000 2.07
10=$45,001–$50,000 3.21
11=$50,001 or more 7.96
EDUCATION 1=No schooling 0.62 4
2=Nursery to 8th grade 12.93 3=9th to 12th grade, but no diploma 18.41 4=High school graduate 31.95 5=Vocational, technical, business, etc. 6.31 6=Some college, but no degree 16.03 7=Associate’s degree 3.41 8=Bachelor’s degree 5.89 9=Post graduate degree 4.45
HEALTH 1=Excellent 17.89 3
(self-rated health status) 2=Very good 30.20
3=Good 32.57
4=Fair 13.96
5=Poor 5.38
NCHRONIC 0 10.75 2
(# of chronic diseases) 1 30.92
2 40.85
3 17.48
DIABETES 0=No problem 79.63 0
1=Some problem 20.37
N=967
given that diabetes is a leading cause of blindness in the United States. Therefore, the model considers the number of chronic diseases (including bone problems, heart problems, and cancer) and an indicator for diabetes. Demographic data for the sample are presented in Table 3.
5.4 Specification of Variables
Here we apply the choice-with-screening model described by Equations (3.1)–(3.8) to the dataset constructed earlier. Vectorx
in Equation (3.2) contains all of the variables in Table 1 to de-scribe plans in the second-stage choice set. The screening at-tributesx˜in Equation (3.4) are assumed to be negative monthly premium, prescription drug coverage, non-network service cov-erage, vision covcov-erage, dental covcov-erage, and routine physical exam coverage. These are the plan features listed in the first part of the Health Plan Finder on the Medicare website (as accessed in 2008). Only the negative monthly premium is a continuous screening attribute.
Vector Din Equation (3.3) contains the demographic vari-ables in Table 3 to explain the individual preference in the sec-ond stage of the decision process. Demeaned demographic val-ues are used, so that the coefficient of the constant term inD
is equal to the expected individual preference evaluated at the average demographic values in the sample. This can be shown by rewriting Equation (3.3) as
β′h= [1,d∗
h] ×
∗1 ∗2
+eh
=(∗1+ ¯d∗
h ×
∗
2)+(d
∗
h − ¯d
∗
h)×
∗
2+eh
≡1+dh×2+eh,
where d∗
h are the original demographic variables,
¯
d∗
h are the
sample means ofd∗
h, anddhare the demeaned values. The
vec-torD˜his assumed to contain only a constant term at this point,
because a larger sample size is needed to identify more param-eters in this vector. Then the coefficients in Equations (3.6) and
Table 4. Coefficient estimates for the first stage in the choice-with-screening model
Posterior mean (std.) ofα
Negative monthly Prescription drug Non-network Vision Dental Routine exam premium coverage coverage coverage coverage coverage
Constant −92.59 −0.47 −7.59 −1.04 −13.74 1.39 (−2.98) (−0.11) (−1.55) (−0.21) (−1.58) (−0.29)
Prob. of used as screen
50% of 0.32 0.00 0.15 0.00 0.91
the sample (0.04) (0.00) (0.05) (0.00) (0.05)
NOTE: Bold type indicates that more than 90% of the posterior draws have the same sign as the posterior mean.
(3.8) represent the mean demand for screening attributes. With this specification, the probability for a discrete attribute being used as a screen is pr[ ˜γhmd >0] =(αdm), where (·) is the standard normal cumulative distribution function.
6. ESTIMATION RESULTS
A total of 50,000 draws are generated according to the MCMC algorithm in Appendix A. The first 40,000 iterations are discarded, and every twentieth draw is collected to estimate the parameters. Tables 4 and 5 report data on the posterior dis-tribution of the hyperparametersαand, respectively. To save space, the tabled do not report estimation results for Vβ and
σ−2PREMIUM. The posterior distributions are described by poste-rior mean and standard deviation. The tables also indicate the consistency between the signs of the posterior draws and the sign of the posterior mean. If more than 90% of the posterior draws have the same sign as the posterior mean, then we can say with some confidence that the posterior mean has a nonzero value. The plots of the posterior draws show that the estimation converges, albeit somewhat slowly.
6.1 Coefficient Estimates for the First Stage of the Model
The posterior distribution ofα, the mean demand for screen-ing attributes, is given in the first row of Table 4, and the corre-sponding probability for each attribute to be used as a screen is presented in the second row. Note that the result applies only to the Medicare health plans, because the elderly are assumed to not screen the basic Medicare FFS.
The mean demand for the continuous screening attribute (i.e., the negative monthly premium) reflects the expected cutoff value. The posterior mean shows that on average, the elderly only consider Medicare health plans with a monthly premium below $93. According to this estimate, the premium screening will apply for 50% of the elderly persons in the sample.
For the aggregated health service coverage, the mean de-mand needs to be converted through the step function (3.7) to reflect the screening behavior. The screening probability, pr[ ˜γhmd >0] =(αmd), is evaluated at each posterior draw of
αmd. It shows that the elderly tend to use the drug coverage and vision coverage as screens. Drug coverage screening is twice as likely to be used as vision coverage screening. However, the screening probability is near zero for the coverage of
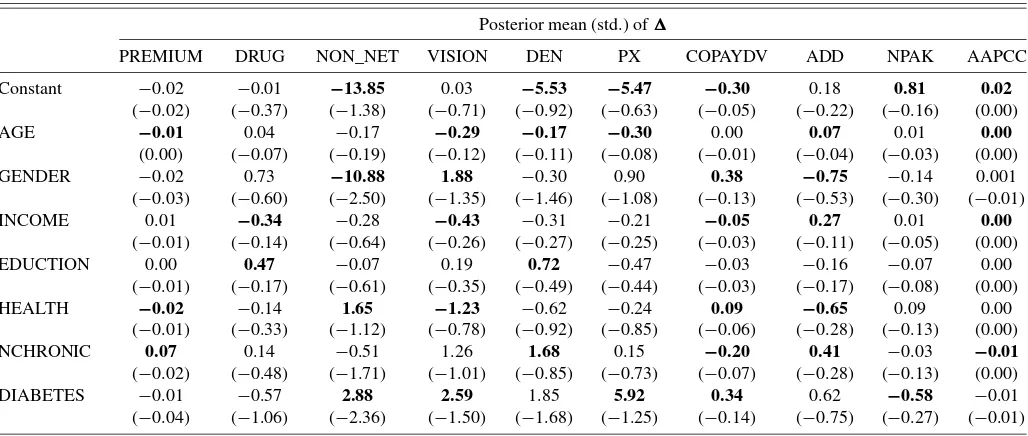
non-Table 5. Coefficient estimates for the second stage in the choice-with-screening model
Posterior mean (std.) of
PREMIUM DRUG NON_NET VISION DEN PX COPAYDV ADD NPAK AAPCC
Constant −0.02 −0.01 −13.85 0.03 −5.53 −5.47 −0.30 0.18 0.81 0.02 (−0.02) (−0.37) (−1.38) (−0.71) (−0.92) (−0.63) (−0.05) (−0.22) (−0.16) (0.00) AGE −0.01 0.04 −0.17 −0.29 −0.17 −0.30 0.00 0.07 0.01 0.00
(0.00) (−0.07) (−0.19) (−0.12) (−0.11) (−0.08) (−0.01) (−0.04) (−0.03) (0.00) GENDER −0.02 0.73 −10.88 1.88 −0.30 0.90 0.38 −0.75 −0.14 0.001 (−0.03) (−0.60) (−2.50) (−1.35) (−1.46) (−1.08) (−0.13) (−0.53) (−0.30) (−0.01) INCOME 0.01 −0.34 −0.28 −0.43 −0.31 −0.21 −0.05 0.27 0.01 0.00
(−0.01) (−0.14) (−0.64) (−0.26) (−0.27) (−0.25) (−0.03) (−0.11) (−0.05) (0.00) EDUCTION 0.00 0.47 −0.07 0.19 0.72 −0.47 −0.03 −0.16 −0.07 0.00
(−0.01) (−0.17) (−0.61) (−0.35) (−0.49) (−0.44) (−0.03) (−0.17) (−0.08) (0.00) HEALTH −0.02 −0.14 1.65 −1.23 −0.62 −0.24 0.09 −0.65 0.09 0.00
(−0.01) (−0.33) (−1.12) (−0.78) (−0.92) (−0.85) (−0.06) (−0.28) (−0.13) (0.00) NCHRONIC 0.07 0.14 −0.51 1.26 1.68 0.15 −0.20 0.41 −0.03 −0.01 (−0.02) (−0.48) (−1.71) (−1.01) (−0.85) (−0.73) (−0.07) (−0.28) (−0.13) (0.00) DIABETES −0.01 −0.57 2.88 2.59 1.85 5.92 0.34 0.62 −0.58 −0.01 (−0.04) (−1.06) (−2.36) (−1.50) (−1.68) (−1.25) (−0.14) (−0.75) (−0.27) (−0.01)
NOTE: Bold type indicates that more than 90% of the posterior draws have the same sign as the posterior mean.
network service and dental service. Among the discrete screen-ing attributes, the routine physical exam coverage has the high-est mean demand; this is not surprising, given that 94% of the Medicare health plans cover some routine exam expenses, as shown in Table 2.
6.2 Coefficient Estimates for the Second Stage of the Model
Estimates of the coefficientis reported in Table 5. The ta-ble shows how demographic data affect an individual’s prefer-ence for plan attributes after screening. The second-stage choice set includes the basic Medicare FFS along with Medicare health plans that passed the screening.
The first row of Table 5 presents the estimate correspond-ing to the constant term inDh, which represents the average
expected preference in the sample. It can be seen that after screening, on average the elderly prefer a plan with network restriction (NON_NET=0), which is a traditional feature of managed care plans. Surprisingly, in the second stage of the de-cision process, on average the elderly prefer a plan with less generous dental coverage or less generous physical exam cov-erage. As expected, a lower copayment for the doctor/specialist visit is preferred. Also, if an insurer were allowed to sell more Medicare health plans or to obtain more AAPCC compensation, then its plan would have a greater chance of being chosen.
The significant negative average tastes for non-network cov-erage and dental covcov-erage can explain why the demand for them is very low in the screening stage. On the other hand, once the plans survive the screening, the elderly on average will not care much about premium, drug coverage, and vision coverage. This demonstrates that a plan attribute used to screen Medicare health plans will play only a small role in the second stage of the decision process. This finding is consistent with the study of Gilbride and Allenby (2004). The average taste for the routine physical exam coverage is negative and large, even though de-mand for this coverage is very high in the screening, indicating how the lack of plans without this coverage affects results in the two-stage parametric functional form.
The impact of demographic heterogeneity on individual pref-erence, relative to the average prefpref-erence, is described by the second to the last row in Table 5. Elderly persons with higher educational levels have a greater preference for drug cover-age. The reason for this, as explained in Atherly, Dowd, and Feldman (2004), is that some Medicare health plans have drug coverage underpriced relative to the actuarial value, and more-educated people can understand this better. Elderly persons with poorer self-rated health (i.e., higher HEALTH level) or with diabetes favor the non-network coverage more than the overall Medicare population, consistent with favorable selec-tion into the managed care plans. As expected, elderly persons with diabetes have a strong desire for the vision coverage. They also have less aversion for the routine physical exam coverage than the overall Medicare population. For the doctor/specialist copayment, elderly persons with more chronic diseases are more sensitive, but those with poor self-rated health or diabetes are less sensitive. The benefits in other plan attributes, as mea-sured by the variable ADD, are more attractive to elderly per-sons who are older and richer and have better self-rated health or more chronic diseases.
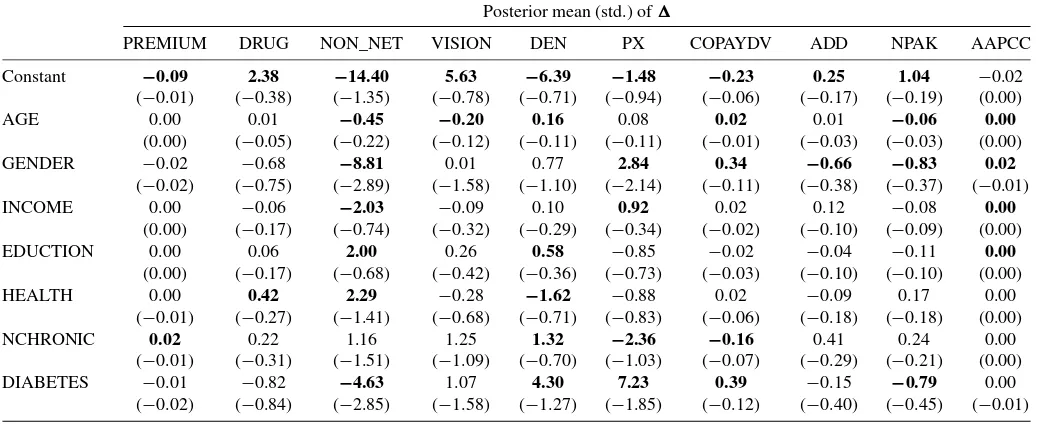
6.3 Comparison With the Conventional Random Coefficient Multinomial Probit Model
We compared the choice-with-screening model with the con-ventional RCMNP model. The concon-ventional RCMNP model does not consider the screening rules (Walker and Ben-Akiva 2002); that is, it assumes that the alternatives will always pass the screening. Thus this model can be considered as a screening model with the restriction that no attributes are used to screen, and it can be expressed by Equation (3.1)–(3.3), with the re-striction thatI(·)=1 always holds. Specifically, for beneficiary h, in yeart, the choice of health planjcan be expressed as
yhtj=1 ifzhtj>zhtkfor allk,
zhtj=x′htjβh+εhtj, εhtj∼iid N(0,1),
β′h=Dh×+eh, eh∼iid N(0,Vβ),
where the variables and parameters have the same interpreta-tion as in the screening model. Estimainterpreta-tion follows steps 1–4 in the algorithm presented in Appendix A, withI(·)set to unity. Again, with diffuse priors, 50,000 posterior draws are gener-ated, and every twentieth draw after the 40,000th iteration is used in the estimation. Based on the final sample, the results of estimation of the coefficientin the conventional RCMNP model are presented in Table 6.
Comparing the first row in Table 5 with the first row in Ta-ble 6 shows that the average preferences in the two models are quite different for the attributes likely to be used as a screen. In the RCMNP model, the average preferences for premium, drug coverage, and vision coverage become statistically significant and have a much larger magnitude. The average preferences for non-network coverage and dental coverage, which are not likely to be used in screening, are similar in the two models.
The estimation results show that the coefficient estimates in the RCMNP model reflect a combination of the effects in the two stages of the screening model. The estimates in the RCMNP model mask the discontinuity and nonlinearity in the individual preference for the plan attributes. When predicting how plan attributes and demographics will affect plan choice, the RCMNP model will give different results from the screen-ing model. We discuss this in detail in the next section.
We also compare the two models in terms of goodness of fit to the data. The log marginal density of the data, calculated us-ing the harmonic mean method of Newton and Raftery (1994), is equal to −210.66 in the screening model and−354.99 in the RCMNP model. This provides evidence that the screening model performs better than the RCMNP model, even though it is less parsimonious. To investigate the predictive power of the models and to reveal the discrepancies between the models and the data, we also conduct posterior predictive check on the re-alized residuals, as suggested by Gelman et al. (2000). The plot of realized residuals under the screening model is very similar to that under the RCMNP model. Both plots show that the mod-els do not have obvious discrepancies with the data, but that the precision of estimation could be improved. This check does not indicate a clear superiority of either specification. Details on the posterior predictive check are provided in Appendix B.
Table 6. Coefficient estimates for the conventional RCMNP model
Posterior mean (std.) of
PREMIUM DRUG NON_NET VISION DEN PX COPAYDV ADD NPAK AAPCC
Constant −0.09 2.38 −14.40 5.63 −6.39 −1.48 −0.23 0.25 1.04 −0.02 (−0.01) (−0.38) (−1.35) (−0.78) (−0.71) (−0.94) (−0.06) (−0.17) (−0.19) (0.00) AGE 0.00 0.01 −0.45 −0.20 0.16 0.08 0.02 0.01 −0.06 0.00
(0.00) (−0.05) (−0.22) (−0.12) (−0.11) (−0.11) (−0.01) (−0.03) (−0.03) (0.00) GENDER −0.02 −0.68 −8.81 0.01 0.77 2.84 0.34 −0.66 −0.83 0.02
(−0.02) (−0.75) (−2.89) (−1.58) (−1.10) (−2.14) (−0.11) (−0.38) (−0.37) (−0.01) INCOME 0.00 −0.06 −2.03 −0.09 0.10 0.92 0.02 0.12 −0.08 0.00
(0.00) (−0.17) (−0.74) (−0.32) (−0.29) (−0.34) (−0.02) (−0.10) (−0.09) (0.00) EDUCTION 0.00 0.06 2.00 0.26 0.58 −0.85 −0.02 −0.04 −0.11 0.00
(0.00) (−0.17) (−0.68) (−0.42) (−0.36) (−0.73) (−0.03) (−0.10) (−0.10) (0.00) HEALTH 0.00 0.42 2.29 −0.28 −1.62 −0.88 0.02 −0.09 0.17 0.00
(−0.01) (−0.27) (−1.41) (−0.68) (−0.71) (−0.83) (−0.06) (−0.18) (−0.18) (0.00) NCHRONIC 0.02 0.22 1.16 1.25 1.32 −2.36 −0.16 0.41 0.24 0.00
(−0.01) (−0.31) (−1.51) (−1.09) (−0.70) (−1.03) (−0.07) (−0.29) (−0.21) (0.00) DIABETES −0.01 −0.82 −4.63 1.07 4.30 7.23 0.39 −0.15 −0.79 0.00
(−0.02) (−0.84) (−2.85) (−1.58) (−1.27) (−1.85) (−0.12) (−0.40) (−0.45) (−0.01)
NOTE: Bold type indicates that more than 90% of the posterior draws have the same sign as the posterior mean.
6.4 Effects on Choice Probability
In this section we analyze how plan attributes and demo-graphics affect the plan choice. The discussion focuses on the impact of plan attributes, given unchanged demographics.
Effects of Plan Attributes. Because different beneficiaries have different plan offers, it is impossible to calculate the marginal effect based on real choice situations; thus we con-sider hypothetical choice situations for the elderly in the sam-ple. The baseline choice set is constructed to have two plans: the basic Medicare FFS and one hypothetical Medicare health plan.
To calculate the choice probability for the Medicare health plan, the posterior draws of the individual preferenceβh and the individual demand for screening attributesγ˜hare retrieved from the Bayesian estimation and used to simulate the plan choice of the elderly in the hypothetical choice set. The sim-ulation algorithm is presented in Appendix C. Then one plan attribute of the Medicare health plan in the baseline choice set is changed, and the corresponding choice probability is cal-culated. The difference in choice probabilities indicates the marginal impact of the plan attribute.
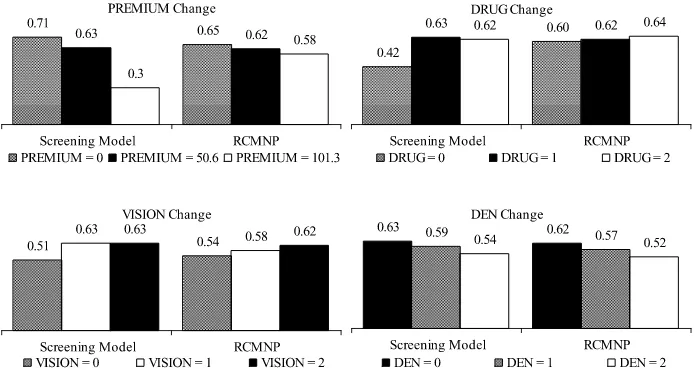
The plan attributes of the Medicare health plan in the base-line choice set take on mean or median values of the Medi-care health plans offered to the sample as described in Table 2; sample medians for discrete attributes and sample means for continuous attributes. More specifically, the Medicare health plan has the following variable values: PREMIUM =50.65, DRUG=1, NON_NET=0, VISION=2, DEN=0, PX= 1, COPAYDV=15.37, ADD=0, NPAK=6, and AAPCC= 623.25. The plan attributes to be studied are monthly premium, drug coverage, vision coverage, and dental coverage. Figure 2 shows the choice probabilities of the Medicare health plan es-timated from the screening model and the RCMNP model. The standard deviations of the estimated probabilities are small (0.01–0.02).
Figure 2 shows that the screening model predicts 63% of the elderly choosing the Medicare health plan in the baseline
choice set. This is consistent with the proportion of 68% Medi-care health plan enrollees in the sample. When the MediMedi-care health plan asks for $50.65 more per month, the premium be-comes $101.30, exceeding the expected premium cutoff of the elderly of $92.59. As a result, the plan is only half as likely to be chosen as before. On the other hand, if the premium decreases from $50.65 to $0, then the plan attracts only 8% more of the elderly. It is obvious that the premium has nonlinear effect on the probability of choosing the Medicare health plan. The non-linearity also exists in the effects of drug coverage and vision coverage. If the plan does not cover any drug expenses, the drug coverage screen will take effect and the plan will lose about 20% of the market compared to the plan with drug coverage. If the plan does not cover any vision expenses, then the vision coverage screen will take effect, and the plan will lose approxi-mately 10% of the market. However, as long as the plan covers some drug and vision service expenses, reducing the generos-ity of these benefits has almost no impact on the plan’s market share. No evidence of a nonlinear marginal effect is seen for plan attributes not likely to be used as screens, such as dental coverage.
Figure 2 also compares the choice probabilities of the Medi-care health plan predicted by the screening model with those predicted by the RCMNP model. When premium, drug cov-erage, or vision coverage changes, affecting the screening, the differences can exceed 5%, and the RCMNP model cannot cap-ture the nonlinearity in the effects of the plan attributes. The differences are <2.44%, when the changes in plan attributes will not affect the screening. Specifically, the impact of dental coverage is similar across the models.
Effects of Demographics. To investigate the effect of de-mographics on plan choice, we construct a hypothetical sam-ple, where the first observation serves as the baseline individual and takes on the median values of the sample as described in Table 3. The other individuals in the sample have one demo-graphic value different from the baseline individual. These in-dividuals are assumed to choose from some hypothetical choice
Figure 2. Probability of choosing a Medicare health plan. Black bars represent the baseline choice situation.
sets. Then, given the posterior draws of the hyperparametersα,
,σ−2PREMIUM, andVβ, the individual demand for a
screen-ing attribute and the individual preference for the attribute af-ter screening can be simulated, and the individual plan choice probability can be calculated using the procedure described in Appendix C.
The hypothetical choice sets imposed are those analyzed in the effects of plan attributes section, where the plan attributes likely to be used as screens are changed. The simulated choice probabilities (not presented here due to space limitations) show that females are more likely than males to choose the Medicare health plan. Moreover, the health-related demographic vari-ables (HEALTH, NCHRONIC, and DIABETES) have stronger marginal effects on plan choice than the other demographics. Individuals with better self-rated health than the baseline indi-vidual tend to favor the Medicare health plan, as do those with more chronic diseases. But individuals with diabetes are less likely to enroll compared with the baseline individual who does not have diabetes. Moreover, fewer health status variables have a large marginal effect in the choice sets where the Medicare health plan are likely to be screened out, that is, the choice sets with PREMIUM=101.3, DRUG=0, or VISION=0. This implies that if screening takes effect, then the demographic data will play a smaller role in the second stage of the decision pro-cess.
Compared with the RCMNP model, the screening model generally predicts a lower Medicare health plan enrollment. In particular, in the choice sets in which the Medicare health plan charges a premium ($101.3) higher than the expected premium cutoff ($92.59) or does not cover any drug expenses (DRUG= 0), the individuals are 10%–30% less likely to choose the plan in the screening model. The findings based on the hypothetical sample are consistent with the impact of the plan attribute based on the real sample, providing evidence that the out-of-sample inferences are reliable.
7. CONCLUSION AND DISCUSSION
How should one econometrically analyze discrete choices when the choice set is large and each element has many choice attributes that are costly to evaluate? Although the RCMNP
model can serve as a benchmark model that allows for heteroge-neous individual preference, it cannot incorporate how people use decision rules to reduce information overload when making choices. The choice-with-screening model extends the RCMNP model with a more flexible functional form and provides a po-tentially useful sensitivity test for the conclusions of the bench-mark model.
We have applied the screening model to analyze choices among Medicare health plans and the basic Medicare FFS in 2002. The model generates results consistent with the bench-mark model, and provides some new findings as well. Sub-stantively, our analysis suggests that elderly persons are most likely to screen Medicare health plans according to premium, followed by prescription drug coverage, and vision coverage. However, after the screening stage, these attributes have little impact on plan choice. Methodologically, our results suggest that the screening model fits the data better.
The screening behavior detected in this study can help ex-plain some puzzles in the Medicare health plan choice of elderly persons and is in line with the results of previous behavioral studies. In the Medicare market, the share of Medicare health plan enrollees in plans with drug coverage declined from 84% in 1999 to 69% in 2003. Meanwhile, average monthly premi-ums of Medicare health plans increased from $32.11 in 1999 to $60.50 in 2002 (Kaiser Family Foundation 2003). Screening on premium and drug coverage can account for the rapid decline in enrollment in the Medicare health plans to 5.0 million enrollees in 2002 from 6.3 million enrollees in 2000, despite the general generosity of the plan benefits.
We interpret choice-with-screening as a response to infor-mation overload, which in turn is associated with subopti-mal choices. These two factors are common concerns in the Medicare program (Atherly 2001; Duggan, Healy, and Morton 2008). Similar concerns also apply in other Medicare sectors, such as Medicare Part D plans where, simultaneous with an expansion of choice alternatives, choice inconsistencies have been documented (Abaluck and Gruber 2009). If the two-stage model is a relatively accurate depiction of choice behavior, then careful plan design and marketing designed for more efficient screening would reduce the incidence of suboptimal choices.
This study has several limitations. First, the study focuses on the choice among Medicare health plans and the basic Medicare FFS. Medicare supplement plans are excluded from the analy-sis because sufficient information on these plans is not publicly available. This leaves open the question of whether the results apply to the entire Medicare population. Second, the robustness of conclusions needs to be tested in larger samples, preferably allowing for many more attributes. Given the great heterogene-ity in the attributes of Medicare health plans, it is difficult to summarize a plan’s benefits with just a few variables. We have considered such variables as the generosity of other plan at-tributes (ADD), Medicare capitation payment (AAPCC), and number of plan packages sold under the plan contract (NPAK) to provide a more comprehensive description of the plan bene-fits. Third, we rely on a fully parametric specification to iden-tify the key nonlinearity that characterizes the screening model. This raises the question of whether our resulting conclusion of the model’s superiority to the benchmark is robust. Finally, the model needs to be extended to allow for correlation across at-tributes. Further research on the extended screening model (Li 2009) shows that, based on year 2001–2002 MCBS data, our findings still hold; the elderly are likely to screen according to premium, drug coverage, and vision coverage, and these at-tributes have nonlinear impact on plan choice.
The ultimate purpose of this study is to provide an innova-tive approach motivated by the behavioral economics to over-come pitfalls in the conventional health plan choice models. Our results may need to be interpreted with caution due to the small sample size and unaccounted for plan attributes, but sim-ilar findings have been reached based on a larger sample in an extended study, and these limitations also apply to the bench-mark model. Based on the choice-with-screening model, further research can be conducted to analyze choice in other Medicare markets and to model more complicated screening behaviors.
SUPPLEMENTARY MATERIALS
Appendix: This document provides additional details on the following materials. Appendix A: implementing the MCMC algorithm described in Section 4; Appendix B: the diagnostic checks based on predictive performance of the two compet-ing models, as described in Section 6.3; and Appendix C: simulation of the plan choice probabilities in Section 6.4. (Screening_Model_JBES_WebAppendix_FINAL.pdf)
ACKNOWLEDGMENTS
We thank Dr. Willard Manning, Dr. John Geweke, and Dr. Timothy J. Gilbride for their comments and suggestions, and this journal’s Editors and Associate Editor for their patient guidance through the review process. The data assistance from the CMS Research Data Assistance Center and the GAUSS code contribution from Peter Lenk are gratefully acknowl-edged.
[Received July 2008. Revised February 2011.]
REFERENCES
Abaluck, J., and Gruber, J. (2009), “Choice Inconsistencies Among the Elderly: Evidence From Plan Choice in the Medicare Part D Program,” Working Paper w14759, NBER. [91]
Allenby, G., and Rossi, P. (1999), “Marketing Models of Consumer Hetero-geneity,”Journal of Econometrics, 89, 57–78. [83]
Atherly, A. (2001), “Supplemental Insurance: Medicare’s Accidental Step-child,”Medical Care Research and Review, 58, 131–161. [81,91] Atherly, A., Dowd, B., and Feldman, R. (2004), “The Effect of Benefits,
Pre-miums, and Health Risk on Health Plan Choice in the Medicare Program,”
Health Services Research, 39, 847–864. [81,86,89]
Bettman, J. R., Luce, M. F., and Payne, J. W. (1998), “Constructive Consumer Choice Processes,”Journal of Consumer Research, 25, 187–217. [82] Brand, K. (2005), “A Structural Model of Health Plan Choice and Health Care
Demand in the Medicare Managed Care Program,” unpublished Ph.D. dis-sertation, University of Virginia. [86]
Buchmueller, T. C., and Feldstern, P. J. (1997), “The Effect of Price on Switch-ing Among Health Plans,”Journal of Health Economics, 16, 231–247. [81] Chib, S., and Greenberg, E. (1995), “Understanding the Metropolis–Hastings
Algorithm,”The American Statistician, 49, 327–335. [84]
Dowd, B. E., Feldman, R., and Coulam, R. (2003), “The Effect of Health Plan Characteristics on Medicare+Choice Enrollment,”Health Services Re-search, 38, 113–135. [81]
Duggan, M., Healy, P., and Morton, F. S. (2008), “Providing Prescription Drug Coverage to the Elderly: America’s Experiment With Medicare Part D,”
Journal of Economic Perspectives, 22 (4), 69–92. [81,91]
Eppler, M. J., and Mengis, J. (2003), “A Framework for Information Overload Research in Organizations: Insights From Organization Science, Account-ing, MarketAccount-ing, MIS,” working paper. [81]
Frank, R. G. (2004), “Behavioral Economics and Health Economics,” working paper, NBER. [81]
Frank, R. G., and Lamirand, K. (2007), “Choice, Price Competition and Com-plexity in Markets for Health Insurance,” working paper. [81]
Gelman, A., Goegebeur, Y., Tuerlinckx, F., and Mechelen, I. V. (2000), “Di-agnostic Checks for Discrete-Data Regression Models Using Posterior Pre-dictive Simulations,”Journal of the Royal Statistical Society, Ser. C, 49, 247–268. [89]
Gilbride, T., and Allenby, G. M. (2004), “A Choice Model With Conjunctive, Disjunctive, and Compensatory Screening Rules,”Marketing Science, 23, 391–406. [81,82,84,89]
Hauser, J. R., and Wernerfelt, B. (1990), “An Evaluation Cost Model of Con-sideration Sets,”Journal of Consumer Research, 16, 393–408. [82] Heiss, F., McFadden, D., and Winter, J. (2006), “Who Failed to Enroll in
Medi-care Part D, and Why? Early Results,”Health Affairs, 25, 344–354. [81] Johnson, E. J., Hershey, J., Meszaros, J., and Kunreuther, H. (1993),
“Fram-ing Probability Distortions, and Insurance Decisions,”Journal of Risk and Uncertainty, 7, 35–51. [81]
Kaiser Family Foundation (2003), “Medicare+Choice, Fact Sheet,” available athttp:// www.kff.org/ medicare/. [91]
(2004), “Medicare Advantage, Fact Sheet,” available athttp:// www.kff. org/ medicare/. [86]
Li, Q. (2009), “The Choice-With-Screening Model With Correlated Cutoffs,” unpublished Ph.D. dissertation, Indiana University. [92]
Loewenstein, G. (1999), “Is More Choice Always Better?” Social Security Brief, National Academy of Social Insurance, 7, 1–7. [81]
McCarthy, I. A., and Tchernis, R. (2009), “Search Costs and Medicare Plan Choice,”Health Economics, 19, 1142–1165. [82]
McFadden, D. (2005), “The New Science of Pleasure, Consumer Behavior and the Measurement of Well-Being,” Frisch Lecture, Econometric Soci-ety World Congress. [81]
(2006), “Free Markets and Fettered Consumers,”American Economic Review, 96, 5–29. [81]
Mullainathan, S., and Thaler, R. H. (2001), “Behavioral Economics,” in Inter-national Encyclopedia of Social & Behavioral Sciences(1st ed.), eds. N. J. Smelser and P. B. Baltes, New York: Pergamon Press. [81]
Newton, M. A., and Raftery, A. E. (1994), “Approximating Bayesian Inference With the Weighted Likelihood Bootstrap,”Journal of the Royal Statistical Society, Ser. B, 56, 3–48. [89]
Rieskamp, J., Busemeyer, J. R., and Mellers, B. A. (2006), “Extending the Bounds of Rationality: Evidence and Theories of Preferential Choice,”
Journal of Economic Literature, 44, 631–661. [82]
Roberts, J. H., and Lattin, J. M. (1997), “Consideration: Review of Research and Prospects for Future Insights,”Journal of Marketing Research, 37, 406– 410. [81]
Rossi, P. E., McCulloch, R., and Allenby, G. M. (1996), “The Value of Purchase History Data in Target Marketing,”Marketing Science, 15, 321–340. [83] Schram, A., and Sonnemans, J. (2011), “How Individuals Choose Health
Insur-ance: An Experimental Analysis,”European Economic Review, 55, 799– 819. [82]
Schwartz, B. (2004),The Paradox of Choice: Why More Is Less, New York: Harper Press. [82]
Strombom, B. A., Buchmueller, T. C., and Feldstern, P. J. (2002), “Switching Costs, Price Sensitivity and Health Plan Choice,”Journal of Health Eco-nomics, 21, 89–116. [81]
Tanner, M. A., and Wong, W. H. (1987), “The Calculation of Posterior Distri-butions by Data Augmentation,”Journal of the American Statistical Asso-ciation, 82, 528–540. [84]
Tversky, A. (1972), “Elimination by Aspects: A Theory of Choice,”Quarterly Journal of Economics, 69, 99–118. [81]
Tversky, A., and Kahneman, D. (1979), “Prospect Theory: An Analysis of De-cision Under Risk,”Econometrica, 47, 263–292. [81]
Walker, J., and Ben-Akiva, M. (2002), “Generalized Random Utility Model,”
Mathematical Social Sciences, 43, 303–343. [89]