Electrical And Mechanical Activity Of The Heart
Erdiansyah Zulyadaini, Hariadi Hariawan, Budi Yuli Setianto
Department of Cardiology and Vascular Medicine, Faculty of Medicine Universitas Gadjah Mada – Dr. Sardjito Hospital, Yogyakarta, Indonesia
Introduction
The regularity and rhythm of contraction of the heart muscles (myocardium) depends on how electrical impulses spreads through the conduction system organized. The process is initiated by electrical stimulation which then causes depolarization. Depolarization is a series of ion transfer through channels that are specifi c to myocardial cell membrane (sarcolemma). These canals spread across the sarcolemma, which include:the Na+ channels, Ca2+ channels, channelK+, Na+-Ca2+exchanger, Na+-K+-ATPase pump and Ca2+active pump. The infl ux of Na+ ions into cell will start depolarization and then spread through conduction system to the rest of the myocardium.1
Depolarization increases levels of Ca2+ which in turn induces the release of Ca2+ from the sarcoplasmic reticulum into the cytosol so that the concentration of Ca2+ will increase. Ca2+ levels will alter the conformation ofcontraction regulating proteins, troponin and tropomyosin, in a way that allows both contractile proteins, actin and myosin, to form connection, and cause contraction. This process is called excitation-contraction coupling.1,2 The entire process of depolarization and repolarization spreads throughout the heart muscles so that all the cells have electric force. Combined electric force around the heart can be recorded by an electrocardiogram. Electrocardiogram in terpretations provide much informations about the structure and function of the heart.1
This literature review will discuss how the electrical impulses generated and propagated so that myocardial cells will contract, how electrocardiogram machine can detect the electrical activity of the heart, and fi nally discuss how this electrical circuit process can form a series of contractions and relaxation so precise that the heart can function optimally.
Discussion
Resting Potential and Acting Potential
At rest there is a difference in electrical charge between the inside and outside of the cell, where the electrical charge inside the cell is more negative than the outside of the cell. Differences in electric charge at rest is called the resting potential. The magnitude of resting potential is determined by the difference in the concentration of all ions inside and outside of the cell, as well as the relative permeability of the ion channels that open.1 As in the nerve cells and muscle cells, the concentration of K+ ions in the myocardium cells is more than the outside of the cell. This happens because of the role of membrane transporters, one of the most important is the Na+-K+-ATPase pump. This protein will connect with energy from ATP hydrolysis to swap 3 Na+ out of the cell with two K+ into the cells thus keeping K+ intracellularconcentrations higher and Na+ intracellular concentrations lower.2
Ion channels that are open at resting position are K+ channels (inward rectifier potassium channel) while Ca2+ channel and Na+ channels are closed. So only K+ is permeable through the membrane of myocardial cells. Because K+ concentration is higher in intracellular, K+ will fl ow out of the cell, reducing the intracellular positive charge and the chargeintracellular will be more negative. The charge change will further retract K+ entry into the cell. Therefore, the fl ow of K+ through K+ channels are open at rest position is dependent on the concentration difference that makes K+ tends to exit the cell, and electrostatic forces will pull it back into the cell. 1
At this balance point, both forces are equal and the movement of K+will be close to zero. When this occurs the electrical potential is called the equilibrium potential of potassium. In the ventricular myocardium of the heart, this electrical potentialmagnitude is -91mV, measured by the Nernst calculation.1 (Figure 1)
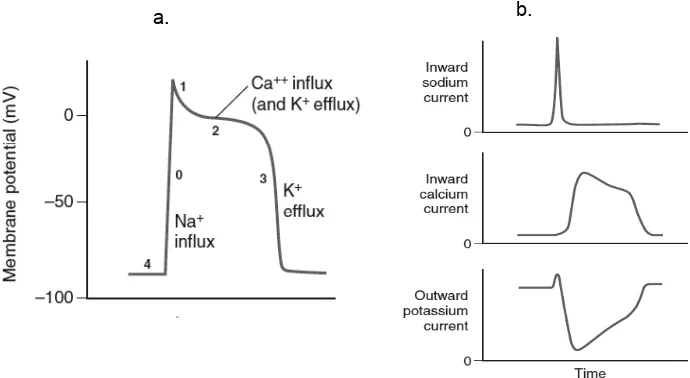
the character that determineselectric potential progression. Before the myocardium cells are stimulated, resting potential remained stable at around -90mV. This condition that happens before depolarization is called phase 4 acting potential. Furthermore, there are 4 phases that refl ect the depolarization and repolarization.1
Phase 0 occurs when there is a stimulus that makes membrane potentialless negative causing the Na+ channels to open. The opening of this canal will lead to Na+ entry into the cell and causing membrane potential to be less negative. This process led to a growing number of Na+ channels open causing a rapid infl ux of Na+. The opening of this canal only happened for a very short amount of time, about a tenth of thousands of seconds only
until the membrane potential reaches -70mV. The movement of Na+ rapid infl ux will overcome the K+ movement balance, causing depolarization where membrane potential becomes positive temporarily. This process is illustrated in the chart action potential as an almost vertical straight line.1
Phase 1 is a short repolarization phase after phase 0. At this phase, K+fl ows out of the cell (effl ux) through a specifi c K+ ion channeltype (delayed rectifi er potassium channel) until the membrane potential approaches 0mV. The next phase, phase 2 is relatively long. In this phase there is a balance between the effl ux of K+ and Ca2+ infl ux through L-type Ca2+ channels. This phase is described as plateau or fl at phase. L-type Ca2+ channels are opened when the membrane Figure 2 (a.) Myocardium’s action potential representative scheme and (b.) ion Na+, Ca2+, and K+relative
[image:2.595.140.396.86.245.2]nett fl ow. Taken from Lin et al., (2011)1
Figure 1. Myocardium cell’s resting potential is determined by the equilibrium between concentration gap dan electrostatic force of K+ . Taken from Lin et at. (2011)1
[image:2.595.125.470.312.501.2]potential reaches -40mV. Infl ux of Ca2+ occurs gradually as the opening of this channel is slow and longer than the Na+ channels.Ca2+ infl ux plays an important role in stimulating the release of Ca2+ from the sarcoplasmic reticulum to the cytosol that is important in the initiation of myocardial cell contraction. Then in phase 3, occurs inactivation of L-type Ca2+ channels, but on the other hand the effl ux of K+ is still ongoing, so that the membrane potential will change back to the resting potential. To keep the ion concentration gradient, the Na+ and Ca2+ inside the cells must be removed through the Na+-Ca2+ exchanger and Ca2+ active pump and Na+-K+-ATP ase.1 Overall chart acting and resting potential can be seen in Figure 2.
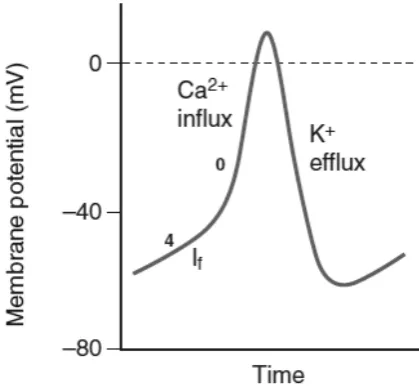
[image:3.595.76.286.529.725.2]Basically, the action potentials in the cells ofthe conduction system have the same pattern. What distinguishes the conduction system is the resting potential that is less negative and faster in phase 0. Meanwhile the pacemaker cells have a different characteristics. The lowest membrane potensial lowest on a pacemaker cells is -60mV, so that the Na+ ion channel, which in myocardium cell is required for depolarization, is always closed. Phase 4 in pacemaker cells are not horizontal, but more inclined. This happens due to the infl ux of ions, especially Na+, which makes the membrane potential tends to be less negative. This fl ow is called a pacemaker current. This fl ow will reach its limit when the L-type Ca2+ channels open,which led to the infl ux of Ca2+ and initiate the depolarization. Because the depolarization of the pacemaker cells is only dependent on the Ca2+, it tends to occur slower and with lower amplitude.1 (Figure 3).
Figure 3. Pacemaker cell’s acting potential. Taken from Lin et al.,(2011)1
Depolarisation Propagation
Interatrial and Internodes pathways
Rhythmic electrical activity of the heart begins with the autodepolarisation processof pacemaker cells located in the sinoatrial node. Sinoatrial node is a collection of specialized myocardial cells that are elliptical with a length of 15 mm, a width of 3 mm, and a thickness of 1 mm. This complex is located in the superior posterolateral wall of the right atrium just below and slightly lateral to the superior vena cava ostium. Fibers in these cell complex’s diameter is a third of the myocardium cell’s diameter, which is about 3-5 micrometers with almost no contractile proteins. These cells are directly related to the atrial myocardium cells.3
The instant depolarization occurs in the sinoatrial node pacemaker cells complex, the spread or propagation of depolarization will head to atrial myocardium cells in the vicinity. Conduction velocity in the atrial myocardium cells reaches 0.3m/sec. In addition to the atrial myocardium cell, depolarization in atrial conduction also went through special fi bers, which are; anterior interatrial pathways connecting the right atrium and left atrium, and three internodal pathways (anterior, medium and posterior). Conduction velocity through these pathwaysare up to 1 m/sec. These pathways’ speed are faster because there are more gap junctions, so that the movement of ions between the cells are easier and faster.3
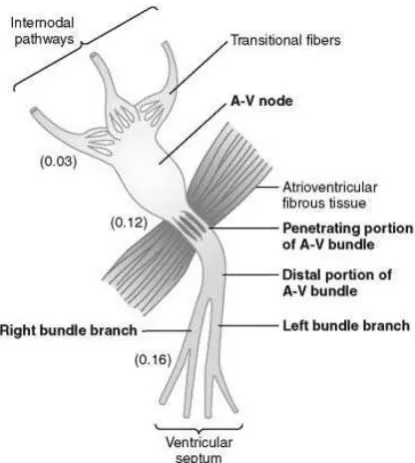
Schematic drawing of conduction transmission slowing can be seen in Figure 4. After passing through the internodal path, impulses will reach the AV node 0.03 seconds after the SA node. In the AV node itself, the transmission of impulses will slow down by 0.09 seconds. Furthermore, the slowdown will occur also when the impulse passes through the His bundle for around 0.04 seconds. Altogether, it accumulates to0.13 seconds. Add in the time it takes to go through internodal pathway, which is about 0.03 seconds, then there is a total slowdown of 0.16 seconds to reach the His bundle branch which then rapidly will be propagated to the ventricular myocardium cells.3
Figure 4. Atrioventricular node complex and its slowdown scheme. Taken from Hall (2011)3
The Purkinje System
After penetrating the dense fi brous tissue, Purkinje conduction system continues to be a bundle of His, where it would be along the ventricular septum 5-15 mm towards the apex of the heart. Then the bundle will separate into 2 branches, right bundle branch and left bundle branch. Both are right along the upper layer endocardium of their own respective ventricle, heading towards the apex and then ramifi es into smaller branches to reach all ventricular chambers. The threadswill then penetrate deep until a third of the myocardium layers that are arranged in spirals. These threads will further progress to be ventricular myocardial cells. The impulses
transmission speed through the Purkinje system is very fast, reaching 1.5-4 m/sec or 150 times faster than the speed of impulse transmission in the AV node. To reach the fi rst ventricular myocardial cell from the furthest Purkinje fi bers, takes 0.03 seconds in the His bundle branches, while to reach the last myocardial cell depolarization, it takes an additional 0.03 seconds. The entire ventricle.s myocardium cells contracts within a mere 0.03 seconds. This is very important either left or right ventricle muscles, synchronizesso that the ejection of blood that can be run effi ciently and effectively.3 Schematic picture of propagation time can be seen in Figure 5.
Figure 5. The heart’s impulse transmition. Taken from Hall (2011)3
Electrocardiography
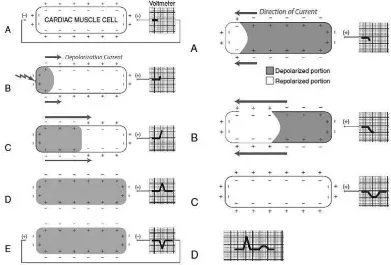
Myocardium Cells Electrical Measurement The basic principle of electrocardiography can be described by impulse transmission examination of a myocardium cell (Figure 6).
[image:4.595.318.516.277.491.2]positive defl ection recorded. When all the cells are already depolarized, then the whole cell surface will be negatively charged homogeneously so that the voltmeter would describe it as a fl at line.4
When a cell is depolarized in the direction away from the (+) electrode, then the voltmeter described it as a negative defl ection. Repolarization is pictured as going from left to right. During this time, the external cell surface charge changes from positive to negative (left to right), but the electric current itself moves from right to left away from the (+) electrode, which is why the voltmeter would describe it as a negative defl ection. Repolarization run slower so the defl ection will be wider with a lower magnitude.4
Electrocardiography Reading
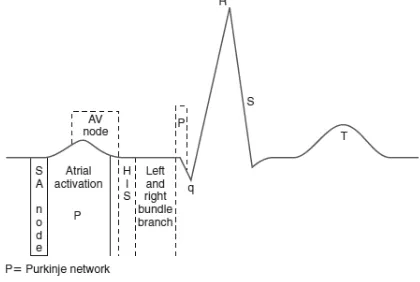
An electrocardiography (ECG) examination results will consist of the P wave, the QRS wave, T wave, PR interval, QRS interval, and ST segment. P wave is the fi rst recorded defl ection, described as a small and curved wave, before the taper and high wave (QRS wave). The early part of the P wave represents the electrical activity of the right atrium, the central part of the P wave represents the end of the initial activation of the right atrium and the left atrial activation, while the end of the
P wave represents the end of left atrial activation. PR interval described as the time it takes for the electrical transmission to pass through the AV node, bundle of His, His bundle branches and Purkinje fi bres untill ventricular myocardium starts depolarizing.5
The QRS complex pictures the spread of ventricular myocardium electrical activation. The electric force recorded is described as sharp and high defl ection. Variations on this complex shape depends on the direction of the resultant vector of the electric force to the electrocardiograph leads. The ST segmentis a segment between the end of the QRS and beginning of T wave. This segment represents a periode when the entire ventricle is going through depolarisation or a periode when the end of depolarisation is superimposed with the beginning of repolarisation that neutralizes each others.5
[image:5.595.102.493.90.355.2]The ST segment is normally in the form of a curve which then continues into the ascending part of the T wave. A horizontal ST segment or forming a sharp angle with the ascending part of the T wave has a certain diagnostic value. The T wave is a wide defl ection, with rounded shape following the QRS, refl ecting ventricular repolarisation phase. Ventricular repolarisationstarts from myocardium’s Figure 6. Measurement using myocardium cell voltmeter during (left) depolarisation and (right)
outermost layer moving toward the endocardial, resulting in T-wave defl ection direction parallel to the direction of QRS.5
[image:6.595.74.284.257.398.2]During repolarization, metabolic process that occurs at the cellular level requires energy so that multiple factors of metabolic, hemodynamic, andphysiologic can affect the process of repolarization and change the morphology of the T wave. Some circumstances that can change the T wave include: exercising, eating, infection, fever, tachycardia, shock, electrolyte disturbances, subarachnoid hemorrhage, drugs, and alcohol.5
Figure 7. An ECG wave. Taken from Khan (2008)5
Electrocardiography Leads
Electrical potential generated by the heart can be transmitted and recorded by electrodes placed on all four extremities and the thorax region. Action potentials recorded by ECG is affected by the dermis, epidermis, ECG electrodes itself, and the mechanical contact between the electrode and the patient’s skin. Cleansing the skin with a mildly abrasive fl uid and the usage of electrolyte paste can increase the electrode-skin contact and reduce artifacts. The electrodes in ECG examination will measure the potential difference between two electrodes or one electrode to the reference electrode. Standard ECG consists of three limb leads, three augmentation leads, and six precordial leads.
Limb leads andaugmentation leads measure the potential difference in the frontal areas of the heart. Lead I measures the potential difference between the left arm with the right arm, leads II measures the potential difference between the left leg with the right arm, while lead III measures the potential difference between the left leg with the left arm. Augmentation leads measure the
potential difference between one electrode to the combined value between 2 other leads, or so-called reference electrode. In short, electrical potential on augmentation leads can be formulated as follows:6
Precordial leads measures the potential difference between the electrode and a reference electrode. Reference electrode used is a combination of all three limb electrodes called Wilson Central Terminal (WCT) which can be formulated as follows6:
A lead can be considered as a vector moving from the negative electrode or reference electrode so that each heart leads have a different vector as well (Figure 8). The electrical activity of the heart is also described as a vector. Vectors in the ventricles of the heart fi rst move in the direction of the inter ventricular septum, moving towards superoinferior, goes into the left ventricle, and then spreads to the lateral and right ventricle. That is why the ECG waveform recordings vary depending on the suitability of the heart vectors and the lead vectors. The amount of defl ection of the ECG recording is also infl uenced by the electrode spacing, and the mass ofthe heart muscle.6
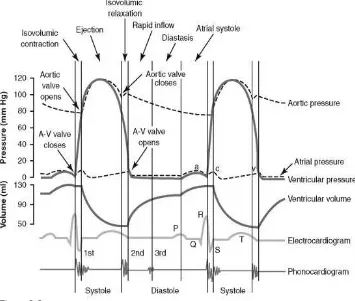
Heart Cycle
atrial depolarization and then followed by atrial contraction immediately after the P wave. After 0.16 seconds from the P wave, QRS wave occurs depicting ventricular depolarization preceding the contraction of ventricles.3
Cardiac cycle consists of a period of relaxation called diastolic, which occurs when the ventricular fi lling, and contraction periods called
[image:7.595.107.492.83.268.2]systolic, which occurs when the ventricles pump blood. The duration of this period is the reciprocal of the frequency of the heart rate. When the heart rate is 72 times per minute, the heart cycle duration is 1/72 minute or about 0,833 seconds. The faster the heart rate, then both periods is also shorter, but the duration decline of systolic periode is not as big as diastolic periode’s. This means that when the Figure 8. Electrocardiograph lead vectors. Taken from Goldberger and Mirvis (2015)6
[image:7.595.119.474.311.612.2]heart rate is very fast, the relaxation period was not enough to fi ll the ventricles with optimal amount of blood before the next contraction.3
Immediately after the ventricle contracts, the AV valve opens. The blood that had been accumulated in the atrium will quicly fills the ventricle. This phase is called the rapid filling phase, and took a third of the diastolic period. During this phase 80% of ventricle’s blood volume is pumped. At the third end of theperiod ventricle is fi lled by the atrium pumps. This mechanism fi lls 20% of the blood volume left into the ventricles. Once fully charged, the entire ventricular AV valve will immediately shut down.3
Systolic period begins as soon as the valve AV closes. This process begins with an increase in ventricular myocardium layer voltage drastically, exceeding the aortic pressure (on the left side of the heart), about 80 mmHg, so that the aortic valve opens. This increased pressure without changes in ventricular volume phase is called isovolumetric contraction phase. The opening of the aortic valve is quickly followed by the rapid ejection phase of the ventricle to pump 70% of itsstroke volume while the other 30% will be ejected twice as slow than the rapid ejection phase, called the slow ejection phase. After the systolic period ends, ventricular myocardium voltagedecreased quickly and suddenly. This decrease in the voltage caused the aorta that was just fi lled with blood from the ventricle, closes aortic valve. Voltage drop in the ventricular myocardium lasted until the pressure is lower than the atrial pressure so that the AV valve will open again.3
Conclusion
The heart’s function as blood pumps run in accordance with the electrical activities and mechanical activities that takes place with a high time precisions. The electrical activity of the heart always precedes the mechanical activity of the heart. Spontaneous acting potentials and
continuously initiated in the sinoatrial node then propagated through internodal to the AV node complex and interatrial pathways to depolarize cells at both the left and right atrial myocardium. After going through a slowdown process in the AV node complex, the transmission of impulses runs quickly through the Purkinje system to depolarize the myocardium of both ventricles so that both ventricles’ contraction are synchronized. The regular and rhytmic process of action potential generation and transmission resulted in effi cient blood pumping movement of atrium and ventricle. Diastolic and systolic period runs based on this electrical activity. By looking at the electrical activity recorded in the electrocardiogram, we should be able to understand the mechanical processes that occurs in the cardiac cycle.
References
Lin YK., Edelman ER., Strtchartz G., Lilly LS. 1.
2011. Basic cardiac structure and function. In: Lily LS (ed). Pathophysiology of heart disease, pp 1-27. Lippincott Williams & Wilkins – Philadelphia.
Rhoades RA., Bell DR. 2009. Medical 2.
physiology princples for clinical medicine 3rd edition. Lippincott Williams & Wilkins - Philadelphia
Hall JE. (eds). 2011. Guyton and Hall textbook 3.
of medical physiology 12th Edition. Saunders Elsevier – Philadelphia.
L i l l y L S . , P o m e d l i S R . 2 0 11 . T h e 4.
electrocardiogram. In: Lily LS (ed). Pathophysiology of heart disease, pp 1-27. Lippincott Williams & Wilkins – Philadelphia. Khan MG. (eds). 2008. Rapid ECG interpretation 5.
3rd edition. Humana Press – New Jersey. G o l d b e r g e r A L . , M i r v i s D M . 2 0 1 5 . 6.